Technology Acceptance, Growth Needs, and Pedagogical Usability as Factors Influencing Teachers’ Perception and Use of the Geometer’s
Sketchpad Software
Chung-Kai Huang
Associate Professor, Department of International Business, National Taipei University of Business
Chang-Hua Chen
Assistant Researcher, Research Center for Curriculum and Instruction, National Academy for Educational Research
Ching-Yuan Chang
Professor, Institute of Education, Tzu Chi University
Chun-Yu Lin
Associate Professor, Department of Business Administration, National Taipei University
Abstract
In this study, teachers’ level of acceptance of current technology, and the pedagogical usability of the dynamic geometry sketchpad (GSP) software, were evaluated for their utility in the teaching of secondary geometry in Taiwan. Here the incorporation of multi-faceted technological factors was considered along with teachers’ growth needs. Relevant instructional designs and usability testing theories were used to develop a survey and a series of tasks, in order to elicit follow-up responses from Taiwanese mathematics teachers. This generic, technology-acceptance-based survey was completed by 124 secondary school mathematics teachers, and 24 secondary school mathematics teachers were invited to participate in the testing of specific context- and task-based pedagogical usability. The findings naturally led to further questions regarding the user- centered design of the GSP software’s functions, as well as mathematics teachers’ growth needs in terms of their professional development.
Keywords: geometry sketchpad software, pedagogical usability, technology acceptance, growth needs
Chun-Yu Lin's E-mail: [email protected] (Corresponding Author)
教師運用動態幾何軟體之研究:
以科技接受、成長需求與教學優 使性為探究因素
黃仲楷
國立臺北商業大學國際商務系副教授鄭章華
國家教育研究院課程及教學研究中心助理研究員張景媛
慈濟大學教育研究所教授林俊佑
國立臺北大學企業管理系副教授摘 要
本研究主要探討臺灣中學數學科教師使用動態幾何軟體的影響因素,針對科 技接受程度與教學優使性進行評量,除了科技相關的因素考量之外,我們亦將教 師的成長需求納入研究架構中。在回顧相關教學設計與優化理論之後,我們使用 了問卷填答與一系列的任務活動,測量數學教師對動態幾何軟體的使用回饋。共
有124 位中學數學科教師填答了科技接受調查問卷,另有 24 位教師參與了情境與
任務導向的優化性測試。根據研究問題與結果,本研究之發現不僅可提供數學教 學實務者參考,並且針對強化使用者為中心的設計功能進行建議,亦對教師專業 成長需求進行相關探討。
關鍵詞:動態幾何軟體、教學優使性、科技接受、成長需求
【通訊作者】林俊佑電子郵件:[email protected]
INTRODUCTION
As part of its curriculum reform, the Ministry of Education in Taiwan has taken a positive attitude in promoting the use of technology in the teaching of mathematics, which encourages teachers’ and students’ use of technology in the classroom (Kong, Chan, Huang, & Cheah, 2014). In addition to the leading role of teachers as knowledge providers, the application of technology plays a crucial role in establishing the effective teaching of mathematics. Mathematics researchers have indicated the potential for using educational technologies to improve the formation of procedural and conceptual knowledge (Kaufmann & Schmalstieg, 2003; McLeod, Vasinda, & Dondlinger, 2012), and in promoting effective and customized teaching (Clark & Whetstone, 2014; Lennex
& Nettleton, 2012; Zhang & Jiao, 2013), as well as in further developing a modest, user- friendly geometry environment revolving from intuitive to deductive argumentation (Harel & Sowder, 2007). Geometer’s Sketchpad (GSP) is a dynamic geometry software package that is available and well-known in Taiwanese secondary education. The geometry software helps create, explore, and analyze a wide range of mathematics concepts in acquiring characteristic geometric features (Olkun, Sinoplu, & Deryakulu, 2009).
In traditional classrooms, teachers guide students to use a straightedge, compass, and protractor, and give them lots of practice drawing squares, rectangles, parallelograms, and circles with the proper tools to produce shapes as accurately as possible (The International Commission on Mathematical Instruction, 1995). Students are expected to understand and distinguish the properties and relationships between different shapes and to form abstract definitions based on the necessary and sufficient conditions (Serra, 2015).
However, the teaching of geometry has been an area that requires careful scaffolding and instructional input from the mathematics teachers (Lehrer & Chazan, 2012). Many geometry exercises in textbooks concentrate not only on learning tasks using formulas and calculations but also on cognitive-driven complexities by analyzing and investigating figures or making conjectures about the properties of figures and testing them (Hsu &
Edward, 2014). Secondary mathematics teachers who wish to achieve quality teaching and ensure that learning in geometry takes place face challenges in creating a GSP- supported environment that will be conducive to students. Such a thematic- and inquiry-based environment would facilitate exploration, motivation, discussion, and an interchange of thoughts (Holmes & Hwang, 2016). In addition to the technological characteristics of GSP software, individual factors for teachers of secondary mathematics such as growth needs must be accounted for and assessed (Niess, 2011; Ottenbreit- Leftwich, Glazewski, Newby, & Ertmer, 2010). Growth needs play moderating roles that underlie mathematics teachers’ use of technology and contributes to change in teachers’
instructional practice (An & Reigeluth, 2011; Ross & Bruce, 2007; Wachira & Keengwe, 2011). Stronger growth needs of mathematics teachers should translate to a greater likelihood that they will incorporate GSP into their curriculums.
In Taiwan, empirical studies of GSP software have been tested in some educational settings (see Cheng, Chen, & Hsu, 2017; Tso, 2012) and scholars should continue to amass and conduct pertinent research in this under-investigated area. Also, limited research has examined the pedagogical affordance through a teacher’s lens using context- and task-based usability testing as well as investigated their technology acceptance and professional growth needs in the use of GSP. Thus, the incorporation of these factors bridges the research gap and contributes to the current body of literature that is focused on pedagogical practices in deepening the understanding of the attributes of GSP software as well as in teachers’ intentions to use the software. Consequently, this study explored secondary mathematics teachers’ perspectives on the characteristics of GSP software and the impact that growth needs could have on their pedagogical applications. Three research goals were formulated: (1) investigating mathetmatics teachers’ perceptions of the pedagogical usability and affordance of GSP software; (2) establishing the validity of the technology acceptance model to explain intentions to use GSP software among mathematics teachers; and, (3) establishing to what extent mathematics teachers’ attitudes toward GSP software moderates their intentions to use it, and how their professional growth needs might affect this relationship.
LITERATURE REVIEW
The Essence of a Dynamic Learning Environment
The construction of a dynamic geometry learning environment could facilitate students’ exploration of geometric figures and contribute to students’ development regarding the nature of daring and measuring and the notion of proof (Sinclair & Robutti, 2013). When teachers ask students to construct a diagram on the screen and to observe geometric properties that are invariant when created by dragging across a screen, teachers are facilitating their students’ abilities to make conjectures (Hollebrands, 2007;
Hoyles & Noss, 1994). For example, a parallelogram is made when students are asked to construct the midpoint for each side of a quadrilateral and connect the four midpoints sequentially. In a conventional mathematics classroom, the proposition, connecting the midpoints of sides of a quadrilateral forming a parallelogram, is presented as a known fact and students are asked to prove the proposition by applying the midpoint theorem.
Nonetheless, a teacher may not provide students with this information in a dynamic geometry environment, but rather he/she could facilitate a process whereby students discover the geometric properties by themselves (Leikin & Grossman, 2013). With the aid of a dynamic geometry environment, a teacher can manage to scaffold students’
awareness and inquiry to note the patterns, structure, or regularities of a geometry figure (Olive, 2013). Students are prompted to reflect on the observed geometry properties and discover if the construction of certain characteristics is arbitrary or if it occurs for a reason (Harel & Sowder, 2007). The motivation and necessity of crafting a formal proof for conjectures and the use of GSP in relation to students’ learning process and outcomes subsequently emerges (Chan & Leung, 2014).
In a constructivist-oriented environment, a teacher plays a critical role in helping students address issues and point out the necessity of making a diagram by constructing their concepts of learning step by step (Belbase, 2015; Sheehan & Nillas, 2010).
Students are able to detach their explanations from particular examples and begin to move from practical to intellectual proofs and from inductive to deductive arguments
(Knuth & Elliot, 1998). Research evidence suggests that students can see and accept the possibility of hierarchical inclusions within a dynamic geometry environment (Jones, 2000). Students can learn geometry proofs thoroughly with the use of dynamic geometry software that helps develop their understanding of complicated topics as well as their reasoning abilities, particularly if the motivation for reasoning is geared towards explanation or discovery as opposed to verification (Christou, Mousoulides, Pittalis, &
Pitta-Pantazi, 2004; Knapp, Barrett, & Moore, 2016). The effective construction of a dynamic geometry environment for promoting students’ learning depends on teachers’
knowledge as well as on the careful and conscientious crafting of learning tasks and activities that take advantage of what dynamic geometry software can do sufficiently well (Chuang, Weng, & Huang, 2015; Hanna, 2000; Joubert, 2013; Koyuncu, Akyuz,
& Cakiroglu, 2015; Ware & Stein, 2014). Hence, it is important to understand how mathematics teachers perceive the features of GSP software in their teaching and its pedagogical usability as these studies claim.
Pedagogical Usability and Acceptance of GSP
The use of GSP software helps teachers to develop students’ mathematic abilities at levels that include comprehension, communication, argumentation, and reasoning (Abdullah, Surif, Ibrahim, Ali, & Hamzah, 2014; Karakuş & Peker, 2015). Numerous studies have evaluated the influence and impact of the use of GSP software on mathematics thinking, learning, and teaching (Bakar, Tarmizi, Ayub, & Yunus, 2009;
Nordin, Zakaria, Mohamed, & Embi, 2010; Teoh & Fong, 2005). GSP software is an interactive tool that encourages a process of discovery in which students visualize and analyze a problem and make conjectures (Furner & Marinas, 2007; Leong, 2013).
GSP software enables learners to discover patterns by constructing their own sketches through dynamic image construction (Furner & Marinas, 2007; Sinclair & Jackiw, 2010).
Given the potential advantages of GSP software, only a limited number of studies have assessed the software through a comprehensive approach and from the perspectives of mathematics teachers’ pedagogical and growth needs in teaching and learning.
The present study was focused on exploring not only the relationship of software
characteristics and the technological behaviors of mathematics teachers, but also the moderating effect of the teachers’ growth needs. To evaluate the acceptance of GSP software and the impact derived from growth needs, the research framework proposed by Chou and Lu (2014) was replicated, given the fact that their study was conducted in a Taiwanese e-learning system context and is conceptually appropriate to the current study. Another reason for replicating the research framework was because the selected constructs were empirically tested and showed good reliability, validity, and model fit. The technology acceptance model (TAM) was thereby used as an underpinning framework regarding the research purpose and scope. Grounded in the theory of reasoned action (Ajzen & Fishbein, 1980; Fishbein & Ajzen, 1975), the TAM posits that the user acceptance or intentions to use technology is jointly determined by two important factors—perceived usefulness and perceived ease of use (Davis, 1989).
The TAM is extensively used to explain a user’s tendency to use technology as well as to predict the actual usage of technology (Teo & van Schaik, 2012); it was adopted on a theoretical basis to help explain the causal linkages between the selected variables in understanding the nature of a technology system and user behaviors. The basic TAM model specified and tested two aspects: perceived usefulness and perceived ease of use.
Perceived usefulness refers to a potential user’s subjective likelihood that the use of a particular technology system would improve their performance in work, while perceived ease of use can be defined as the degree to which the potential users expect a particular technology system would be easy to adopt without the need of too much effort (Davis, 1989). Both perceived usefulness and perceived ease of use will subsequently influence a user’s attitude towards, and behavioral intention to use, a target technology system. It should be noted that a user’s attitude fully mediates the effects between his or her beliefs and an evaluation of their behavioral intentions (Davids, Bagozzi, & Warshaw, 1989), which is the major reason that, when evaluating the GSP software, no hypothesis was postulated between the two variables represented by the perceived ease of use and the intentions to use.
Pertinent studies applying concepts from the TAM have been conducted in varied educational settings under different learning environments with varied instructional
purposes, such as web-supported learning systems (Calisir, Altin Gumussoy, Bayraktaroglu, & Karaali, 2014; Joo, So, & Kim, 2018), blended learning (Padilla- MeléNdez, Del Aguila-Obra, & Garrido-Moreno, 2013), mobile learning (Al-Emran, Mezhuyev, & Kamaludin, 2018), and online-based multimedia (Lee & Lehto, 2013;
Motaghian, Hassanzadeh, & Moghadam, 2013). This study was intended to extend the original scope of the TAM by incorporating teachers’ growth needs, and, therefore, we adopted the definition used by Hackman and Lawler (1971). They specified growth needs as an individual’s strength of desire to learn and rise to a challenge for obtaining feelings of accomplishment in work. Growth needs vary from person to person and have a strong correlation with one’s psychological status.
Applying the research findings from Chou and Lu (2014) to the secondary mathematics teachers’ use of technology, we postulated that teachers’ growth needs are likely to empower them to acquire new knowledge, strategies, skills, and technologies in their professional development (Albion, Tondeur, Forkosh-Baruch, & Peeraer, 2015;
Feille, Nettles, & Weinburgh, 2018; Ottenbreit-Leftwich, Glazewski, Newby, & Ertmer, 2010). Presumably, teachers with strong professional growth needs will be more inclined to have a positive attitude to integrating GSP software in preparing their classroom task materials, and improving class interactions by engaging students (Baylor & Ritchie, 2002; Hannafin, Burruss, & Little, 2001; Mumtaz, 2000; Potter & Rockinson Szapkiw, 2012). According to the aforementioned research purpose and problem statement, seven hypotheses were formulated in the proposed research framework (see Figure 1).
Figure 1. Research framework
H1: Perceived ease of use has a significant positive influence on perceived usefulness.
H2: Perceived ease of use has a significant positive influence on attitude towards software use.
H3: Perceived usefulness has a significant positive influence on attitude towards software use.
H4: Perceived usefulness has a significant positive influence on intention to use.
H5: Attitude toward software use has a significant positive influence on intention to use.
H6: Growth needs moderate the relationship between perceived usefulness and intention to use.
H7: Growth needs moderate the relationship between attitude toward software use and intention to use.
METHODS
This study utilized mixed methods to enhance the richness and depth of gathered data because the results from both quantitative- and qualitative-driven methods may validate each other and provide stronger evidence for a conclusion (Mertens, 2014;
Venkatesh, Brown, & Bala, 2013). The first component was focused on administering a questionnaire survey to investigate teachers’ generic perceptions about their acceptance of GSP software and how growth needs might influence their intent to use GSP. The second component of this study consisted of context- and task-based pedagogical usability testing to explore secondary mathematics teachers’ perceptions of the design of GSP software in terms of interface, information, and interaction (Akayuure & Apawu, 2015). This combination of inquiry provided the potential for generating complimentary methods of understanding the complexities and contexts of the secondary mathematics teachers’ user experiences, and allowed them to elaborate on their GSP software acceptance and use.
Survey Instrument
The survey was composed of previously reviewed and validated items from the
studies of Teo (2009) and Chou and Lu (2014), with demographic data and 18 statements concerning the five variables (see Appendix A). There were four TAM-based variables:
perceived usefulness (PU) (four items), perceived ease of use (PEU) (six items), attitude towards software use (ASU) (three items), and intention to use (ITU) (four items). In addition, growth needs (GN) (six items) was incorporated as a moderator variable in determining its effect on influencing teachers’ attitudes toward and intention to use GSP software. Minor modifications of the wording were made to the survey instrument based on the teaching context of the targeted population. The survey items of PEU, PU, ASU, and GN were measured using a seven-point scale, while those of IU were measured via a five-point Likert scale. We used the different points of scale to eliminate potential common method variance issues, as this study adopted single-source, self-report, cross- sectional designs. By adjusting the bias of acquiescence response, common method variance was expected to be reduced (Podsakoff, MacKenzie, Lee, & Podsakoff, 2003;
Watson, 1992). The 30.14% variance explained by Haman’s one-factor test shows that common method bias is not a major concern in self-reported data. Confirmatory factor analysis was carried out to establish factorial validity and the structural equation modeling by AMOS 22 software was used for hypothesis testing and model comparison.
Pedagogical usability tasks
Pedagogical usability testing was focused on investigating mathematics teachers’
perspectives of the GSP design in descriptive, interpretive, and evaluative manners. The task- and context-based testing consisted of two major phases. First, the participating teachers were guided to perform the seven predetermined usability tasks that focused on the different aspects of GSP application in secondary mathematics teaching and learning (see Appendix B). The tasks began with a general free exploration and progressed to specific figure construction and to the application of geometric theorem. Second, the researchers administered a formative evaluation consisting of 15 items regarding the design of the GSP interface, information, and interaction. To understand teachers’ user experiences from the usability tasks, the numeric-based items were composed based on the pertinent guidelines and studies (Huang, Hsin, & Chiu, 2010; Nokelainen, 2006).
Camtasia software was used to record where the participating teachers encountered problems and experienced confusion during their think-aloud reflections. The navigation processes were observed by the on-site researchers.
Procedure and Participants
A research invitation was circulated to secondary mathematic teachers through the National Academy of Educational Research, which stipulated participation on a voluntary basis. Upon obtaining consent from the potential participants, the research team made private individual appointments. Research data were collected via purposive sampling, face-to-face interviews, and paper-based surveys. We adopted purposive sampling to ensure that the selected participants had a familiarity with secondary mathematics curriculum, shared similar teaching experience, and were willing to dedicate their time to participatory GSP software design. The context- and task-based technology acceptance survey was completed by 124 secondary mathematics teachers: 61% were male and 39%
were female. In terms of usability testing, the optimal number of participants conformed to research by Nielsen and Landauer (1993) who found that at least 15 users were needed to discover the majority of usability problems in a design. Consequently, a total of 24 secondary school mathematics teachers (T1-24, 15 males and 9 females) responded to the research invitation. These teachers were recruited from various schools in the east, north, central, and south areas of Taiwan. More than half of the teachers' ages ranged from 36 to 45 and most of their undergraduate majors were earned in mathematics-related fields.
With the noted exception of one newly appointed teacher, all teachers had more than 5 years of experience teaching secondary mathematics.
RESULTS AND DISCUSSIONS
The results include both a TAM-based survey and usability testing analyses. The GSP acceptance analysis consisted of a presentation of the descriptive statistics, validity and reliability checking, hypothesis testing, and a test of the structural model by applying commonly reported fit indexes. The analysis of pedagogical usability was derived from
teachers' reflective responses and their evaluations of GSP software.
Findings of GSP Acceptance
Descriptive statistics
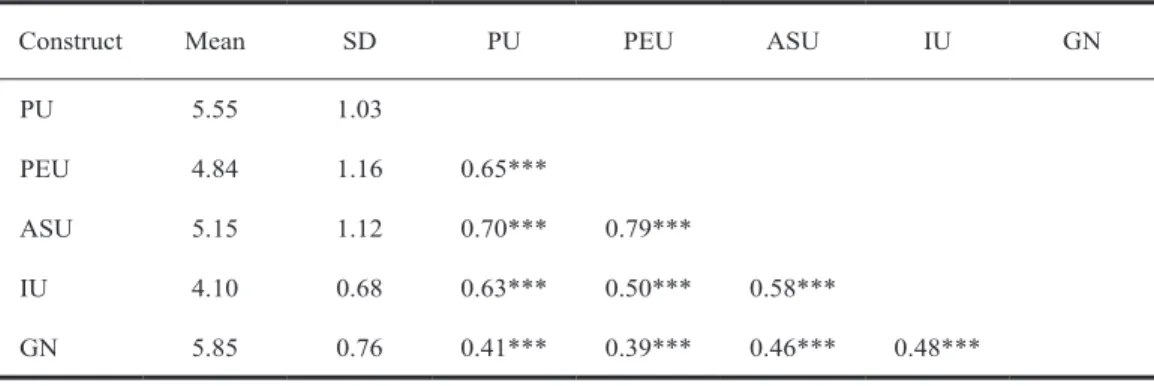
Table 1 shows the descriptive statistics of the selected constructs: means, standard deviations, and correlations. All the means are higher than the midpoint of 3.5 or 2.5 and the standard deviations range from 0.68 to 1.16.
Table 1 Means, standard deviations, and correlations among selected variables
Construct Mean SD PU PEU ASU IU GN
PU 5.55 1.03
PEU 4.84 1.16 0.65***
ASU 5.15 1.12 0.70*** 0.79***
IU 4.10 0.68 0.63*** 0.50*** 0.58***
GN 5.85 0.76 0.41*** 0.39*** 0.46*** 0.48***
***p < .001, **p < .01, *p < .05
Validity and Reliability
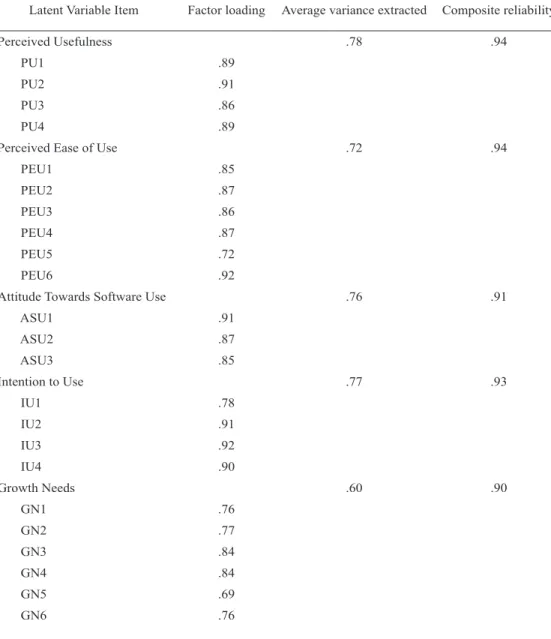
In order to assess the validity and reliability, we individually calculated and examined the factor loading, the average variance extracted (AVE), and the composite reliability of each construct (see Table 2). Convergent validity is considered to be acceptable when the AVE equals or exceeds 0.5 (Fornell & Larcker, 1981). The AVE values were all above the minimum recommended level of .50, and ranged from .60 to .78, which suggests that convergent validity was achieved for every variable. In order to measure internal consistency, composite reliability was adopted. As for the evaluation of composite reliability, a threshold value of 0.7, or higher, was deemed a satisfactory level for confirmatory research (Jr. Hair, Black, Babin, & Anderson, 2014). Moreover, standardized factor loadings were all above .60, which agrees with recommendations
found in the statistical literature regarding the correlational relationship between each latent variable and its underlying items.
Table 2 Result for item factor loading, average variance extracted, and composite reliability
Latent Variable Item Factor loading Average variance extracted Composite reliability
Perceived Usefulness .78 .94
PU1 .89
PU2 .91
PU3 .86
PU4 .89
Perceived Ease of Use .72 .94
PEU1 .85
PEU2 .87
PEU3 .86
PEU4 .87
PEU5 .72
PEU6 .92
Attitude Towards Software Use .76 .91
ASU1 .91
ASU2 .87
ASU3 .85
Intention to Use .77 .93
IU1 .78
IU2 .91
IU3 .92
IU4 .90
Growth Needs .60 .90
GN1 .76
GN2 .77
GN3 .84
GN4 .84
GN5 .69
GN6 .76
Test of model fit indexes
Structure equation modeling (SEM) is a multivariate statistical analysis technique that was adopted to analyze the strength and structural relationships of the research model as well as allowing us to assess how well the data fit the model. Thus, different indexes were applied according to suggestions by Hair, Black, Babin, and Anderson (2010). Chi- square (χ²) was used to assess the overall fit and the discrepancy between the sample and the fitted covariance matrices. Due to the chi-square’s sensitivity to a large sample size in rejecting the model, a relative chi-square (χ2/df) was calculated to minimize its effect (Hooper, Coughlan, & Mullen, 2008). A comparative fit index (CFI) was adopted to compare the fit of the target model to that of an independent model. The parsimonious- adjusted index, the root mean square error of approximation (RMSEA), indicated how well the model, with unknown but optimally chosen parameter estimates, would fit the population’s covariance matrix (MacCallum, Browne, & Sugawara, 1996). As a result, the overall fit measurements of the full model in the SEM demonstrated that the fit of the model is acceptable (χ²=174.67, p<0.00; χ²/df =1.55; CFI=0.97, RMSEA=0.07).
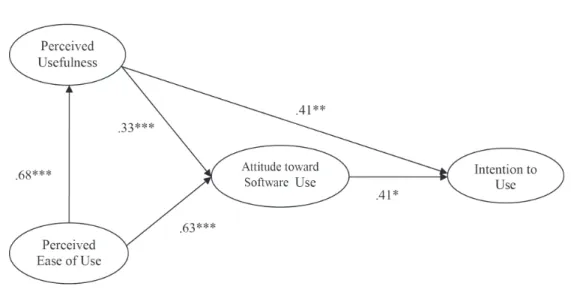
Test of the structural model
The path coefficient of the proposed research model appears in Figure 2. Perceived ease of use had a significant effect both on perceived usefulness (β =0.68, p<.001) and attitude toward software use (β =0.63, p<.001). Perceived usefulness had a significant effect both on attitude toward GSP software use (β =0.33, p<.001) and intention to use (β =0.41, p<.01). Intention to use was influenced by attitude toward software use (β
=0.41, p<.005). As a result, hypotheses H1, H2, H3, H4, and H5 were supported. These findings resonate with those established in previous literature (Okumuş, Lewis, Wiebe,
& Hollebrands, 2016; Stols, 2007; Teo, 2009; Teo & van Schaik, 2012) and suggest that to increase mathematics teachers’ intentions to use GSP software in their classroom teaching, their perception of the software’s ease of use and usefulness as well as their attitude toward software use should be considered and promoted.
Test of the moderating effect
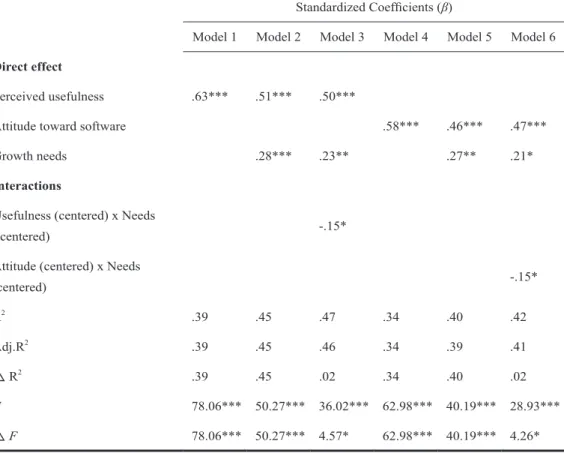
To examine the moderating effect of teachers’ growth needs on perceived usefulness, attitudes toward software usefulness, and intentions to use GSP software, the technique of hierarchical regression suggested by Baron and Kenny (1986) was applied for analysis.
Models 3 and 6 in Table 3 summarize the supporting results of proposed hypotheses H6 and H7. The standardized coefficients regarding the interaction between teachers’ growth needs and perceived usefulness and attitude toward software use were -0.15 (p<.05) and -0.15 (p<.05), respectively. Both interactions from growth needs were proven to be statistically significant with a negative relationship. The moderating effect diverged from previous studies (Chou & Lu, 2014; Ottenbreit-Leftwich, Glazewski, Newby, & Ertmer, 2010) that found a positive impact of growth needs on percived usefulness and attitude toward technology use.
To better understand the moderating effects of teachers’ growth needs both on the relationship between attitude toward software and intentions to use GSP and on the relationship between teachers’ perceived usefulness and their intentions to use GSP, we divided this teacher cohort into two groups of teachers with high- and low-growth needs.
Figure 3 indicates that the teachers with lower growth needs had stronger intentions
Figure 2. Standardized path coefficients
Table 3 Regression results of hypotheses tests for moderating effect
Dependent variable: Intention to use
Standardized Coefficients (β)
Model 1 Model 2 Model 3 Model 4 Model 5 Model 6 Direct effect
Perceived usefulness .63*** .51*** .50***
Attitude toward software .58*** .46*** .47***
Growth needs .28*** .23** .27** .21*
Interactions
Usefulness (centered) x Needs
(centered) -.15*
Attitude (centered) x Needs
(centered) -.15*
R2 .39 .45 .47 .34 .40 .42
Adj.R2 .39 .45 .46 .34 .39 .41
△R2 .39 .45 .02 .34 .40 .02
F 78.06*** 50.27*** 36.02*** 62.98*** 40.19*** 28.93***
△F 78.06*** 50.27*** 4.57* 62.98*** 40.19*** 4.26*
Note. *p<.05, **p< .01, ***p< .001
to use GSP software in their classes because they perceived higher usefulness of the software, compared with those who had high growth needs. Figure 4 shows that the teachers with lower growth needs had higher intentions to use GSP software in their classes, while they demonstrated higher attitude scores toward the software (1 and 2 on the X-axis represents the low and high levels, respectively), as compared with those with high growth needs. Figures 3 and 4 denote that the moderating effect of teachers’ growth needs on their perceived usefulness, attitude toward software, and intentions to use GSP.
Findings of Pedagogical Usability
Figure 3. Perceived usefulness × growth needs interaction for intention to use
Figure 4. Attitude toward software × growth needs interaction for intention
to use
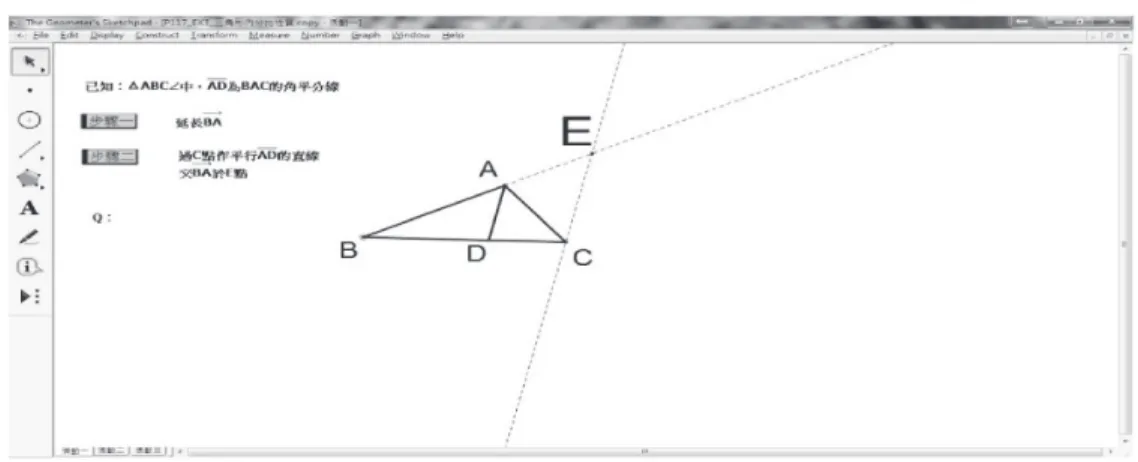
The pedagogical usability of GSP software was established via eliciting the mathematics teachers’ perceptions of simulated usability tasks, think-aloud reflections, and an after-task survey. A few major issues were discovered in the design of the GSP software interface, information, and interactions as the teachers proceeded with the task-based usability scenarios for free exploration and designated function applications and proofs. Although most teachers interviewed agreed that GSP software provides a simple user interface, they tended to compare the interface of GSP software with that of Microsoft Word. Their perceptions of GSP software were influenced by the function alignment of Microsoft Word in terms of intuitive use and application to mathematical tasks. Figure 5 indicates that the design of the GSP interface can be improved to empower users to dexterously manipulate and control the different fundamental functions. T3’s comment on the design of the interface was as follows.
I hope it can be simpler with more visual aids...The current design relies more on the text-based option. However, I can’t directly pick up the meaning based on the words per se. Like this one [with icon presented] on the left side, I can tell the use of drawing lines. The upper bar did not have this kind of feature and made us disoriented without knowing where to find the specific tool function.
It was recommended that the GSP’s software interface could accommodate more pictorial-based icons that increase the features of user-friendliness, visibility, and simplicity in creating a better user experience.
She continued to elaborate on the icon-oriented presentation of Microsoft Word, which enables potential users to capture its specific functions with concrete visual clues and an office assistant. Given the fact that GSP software has graphic-based icons, they are only limited to the graphic menus on the left-hand side. The main menu remains mainly text-generated without any further interactive support when users are confused about a certain function. Quite a few teachers expressed their difficulties in being able to link the listed English text to the software operations, and they felt that this interfered
with the text decoding process. To maneuver a distinct function, such as the selection tool, compass tool, or straightedge tool, teachers must check the user manual for details via written documents and associated images. In addition, some teachers mentioned that the self-explanatory indicator in Microsoft Word automatically pops up if they mouse over the icons in the tool bar, whereas the indicator in the GSP software appears in the bottom area. Therefore, most teachers may not notice or be aware of this unobtrusive support during their first usage attempts.
Moreover, a few teachers claimed that the graphic tools that Microsoft Word offers are extremely helpful for drawing geometric forms and shapes, such as squares, rectangles, and quadrangles. When creating similar forms and shapes using the GSP software, extra procedural steps and efforts are needed. Although several teachers had previously learned to use the geometry software, their prior experience was insufficient in making them proficient in demonstrating the invariance characteristics while dragging the geometric figures. They were worried about whether their unfamiliarity with the software would delay the teaching of the class and subsequently hinder students’ cognitive learning. As the manifestation is key to making geometric figures meaningful, teachers’
proficient use of GSP software helps students acquire target concepts and features in scaffolding their cognitive processes.
Figure 5. The interface of GSP software
Not being proficient with the software, when operating the software in class, some students may wait for you…. unless you are very familiar with this interface. Teachers like us generally don’t have that much time to practice and master the software. Under such circumstances, students would sit there and twiddle their thumbs causing negative effect…. For some frequently used things [geometric shapes], it would be better to provide a selection menu on the software, and we [teachers] can directly choose and draw the shapes. More convenient in applying the software.
Another important problem that emerged was teachers’ not being able to apply the various characteristics of GSP software in teaching geometry proofs. As formerly discussed, many participating teachers had either more or less experience as geometry software learners, but only about one-third of the teachers were capable and confident of completing a task by using the dynamic function that GSP software provides to elaborate on a mid-point theorem. That is, they were unable to draw a quadrilateral and to explain the concept by joining the mid-point of each side to generate a parallelogram and to further prove the proposition. T11 emphasized that pedagogical know-how of applying GSP software in classroom teaching should be included in teachers’
professional development or in future workshops. As he pointed out, “by dragging like this…. the shape of a quadrilateral can be altered and then let them [students] observe and realize that the parallelogram inside is fixed.” The reason that many teachers still use blackboards to teach the mid-point theorem of a quadrilateral is because they received neither appropriate training nor did they acquire relevant knowledge and skills of transferring their teaching practice from a traditional blackboard-based to a GSP-assisted setting.
Technical pedagogical content knowledge, as noted by Mishra and Koehler (2006), serves as a fundamental requirement for teachers to accommodate a technology tool.
Through a series of probing questions and investigative inquiries from researchers, a few teachers also stated that knowledge of integrating the teaching of geometry with
GSP software in mathematics lessons is required in order to explicitly teach the mid- point theorem of parallelograms. For effective pedagogical practice in a GSP-enhanced learning environment, teachers must make relational links between what geometry concept is being taught and how to use it effectively in delivering the content to students.
T3 expressed this concept as follows.
To conceptualize this theorem and fulfill the drawing [on GSP], the quadrilateral should be flexible, not fixed. Students need to learn to use the measurement tool and ways to drag the shape on their own to construct their own understanding. No matter which one [quadrilateral] they manage to adjust, they will get the same result.
In addition to conceptualization of quadrilaterals, some teachers recognized that both a mastery of the GSP software and the support of teaching methods are necessary in order to adequately explain the graphing process to students. In responding to this specific task, T7 mentioned that “the prior knowledge of the basic drawing” is indispensable to “teach some fundamental concepts and features of parallels such as interior angles supplementary.” As infrequent users of GSP software in teaching, two interviewed teachers reported that they simply “use the software for test preparation or teaching demonstration.” A major concern about a GSP software integration barrier was the lack of technical support that provides help regarding specific technology-related pedagogical problems. T15 stated the following according to previous experience.
Because there were not [many] professional [multimedia] classrooms in secondary schools, you [teachers] need to borrow equipment…It is impossible to use projectors like what universities do... The checking and installation will probably take 10 minutes.
Similar difficulties of applying technology for pedagogical purposes were also shared by T6, as follows.
I am pretty resistant to the technology equipment. I don’t like to bring the laptop to the classroom, [and] spend lots of time connecting the gadgets together. After all the preparatory work, [I] only use it [technology] for a short demonstration. I would feel the class is interrupted, unless the [teaching]
effectiveness is achieved or I can keep using GSP more than 10 to 15 minutes [in a class session].
A lack of technical support and/or tech-equipped classrooms was found to be another issue for mathematics teachers in order to integrate GSP software into their teaching practice, given the GSP software’s strong affordances in demonstrating geometric figures and shapes. Teacher anxiety about setting up equipment and operating systems seems to be an issue when making the software functional takes too much time out of a 45-minute class period. Teachers neither wanted to sacrifice their time and effort merely for a simple demonstration, nor did they want to risk fragmenting a class teaching session. This dilemma prevented them from applying the possibilities of GSP software, and prevented them from leading their students in discourse-based activities and in-depth discussions after the demonstration.
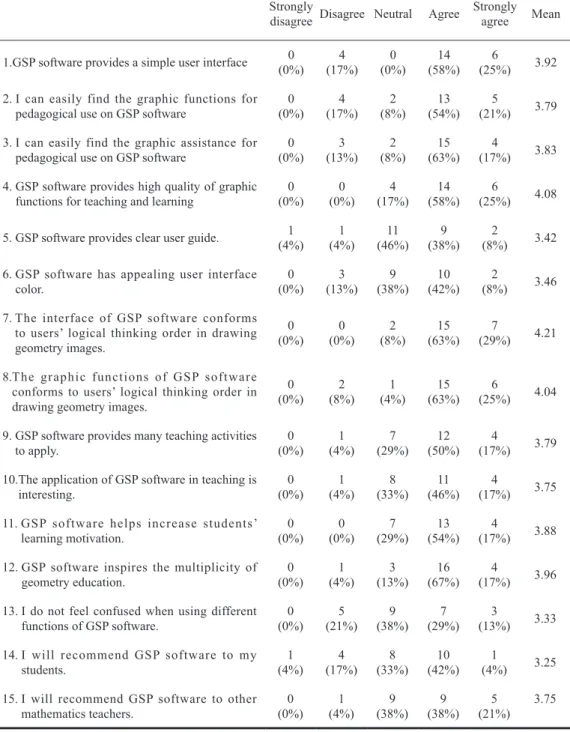
Moreover, Table 4 lists the overall mean scores and percentage distribution of the scales on which the teachers registered their agreement or disagreement within varied evaluation statements. The formative evaluation items revealed positive feedback on the GSP software with respect to the design of the interface (1,6), information (2, 4, 5, 9, 13), and interaction (3, 7, 8, 10, 11). More than half of the participating teachers had shared the merits of the pedagogical usability of GSP software: simple interface, easily found graphic functions, logical arrangement of thinking order, and an interactive learning environment for motivating students. Nonetheless, it should be noted that many teachers were not satisfied with the lack of a clear user guide or tutorial for detailed and step-by- step operation. Insufficient instructions concerning software use could create unnecessary uncertainties for teachers with respect to certain technical factions and could block their intentions for future usage. Also, the lack of confident control of GSP software: may
Table 4 Results of participants’ responsive reflection from the usability tasks
Strongly
disagree Disagree Neutral Agree Strongly agree Mean
1. GSP software provides a simple user interface 0
(0%) 4
(17%) 0
(0%) 14
(58%) 6
(25%) 3.92 2. I can easily find the graphic functions for
pedagogical use on GSP software 0
(0%) 4
(17%) 2
(8%) 13
(54%) 5
(21%) 3.79 3. I can easily find the graphic assistance for
pedagogical use on GSP software 0
(0%) 3
(13%) 2
(8%) 15
(63%) 4
(17%) 3.83 4. GSP software provides high quality of graphic
functions for teaching and learning 0
(0%) 0
(0%) 4
(17%) 14
(58%) 6
(25%) 4.08
5. GSP software provides clear user guide. 1
(4%) 1
(4%) 11
(46%) 9
(38%) 2
(8%) 3.42 6. GSP software has appealing user interface
color. 0
(0%) 3
(13%) 9
(38%) 10
(42%) 2
(8%) 3.46 7. The interface of GSP software conforms
to users’ logical thinking order in drawing geometry images.
(0%)0 0
(0%) 2
(8%) 15
(63%) 7
(29%) 4.21
8. The graphic functions of GSP software conforms to users’ logical thinking order in drawing geometry images.
(0%)0 2
(8%) 1
(4%) 15
(63%) 6
(25%) 4.04
9. GSP software provides many teaching activities
to apply. 0
(0%) 1
(4%) 7
(29%) 12
(50%) 4
(17%) 3.79 10. The application of GSP software in teaching is
interesting. 0
(0%) 1
(4%) 8
(33%) 11
(46%) 4
(17%) 3.75 11. GSP software helps increase students’
learning motivation. 0
(0%) 0
(0%) 7
(29%) 13
(54%) 4
(17%) 3.88 12. GSP software inspires the multiplicity of
geometry education. 0
(0%) 1
(4%) 3
(13%) 16
(67%) 4
(17%) 3.96 13. I do not feel confused when using different
functions of GSP software. 0
(0%) 5
(21%) 9
(38%) 7
(29%) 3
(13%) 3.33 14. I will recommend GSP software to my
students. 1
(4%) 4
(17%) 8
(33%) 10
(42%) 1
(4%) 3.25 15. I will recommend GSP software to other
mathematics teachers. 0
(0%) 1
(4%) 9
(38%) 9
(38%) 5
(21%) 3.75
discourage teachers from recommending the software to their students and colleagues to a certain extent. The pedagogical usability findings generally conformed to what we found in the technology acceptance-based survey. Incorporating the context- and task- based data made the findings more comprehensive and provided stronger evidence for a conclusion.
CONCLUSIONS
The use of technology in mathematics teaching and learning has become more essential and prevalent. In this current study, we briefly discussed the central issues that are relative to technology acceptance, growth needs, and pedagogical usability of GSP software in secondary education settings. Adopting GSP software for geometry-related topics is viable for quality teaching and learning and thus pertinent factors should be thoroughly considered concerning teachers’ perceived ease of use and usefulness of the software. There are some strategies that can be used to solve the existing problems of GSP software and its application. User interface of GSP software provides a fundamental platform for human-computer interaction and should be designed in a way that is expected to provide potential users with clear functions and insights into software affordability.
Mathematics teachers prefer a clean and tidy interface without distractions from tools that they are not familiar with and cannot intuitively identify. As user interface can be graphical, text-based, and audio-video based, the underlying philosophy in commonly used software could be highlighted to make GSP software clearer to understand, simpler to use, and more supportive in the teaching environment. An interactive interface represented by user-selectable icons, widgets or a dashboard could be considered to assure a larger degree of advantage and satisfaction with GSP software content and performance. Furthermore, it is necessary to develop an interface that resonates with mathematics teachers’ mental representation of software use and one that facilitates a deeper connection with the mathematical concepts and dynamic functions of GSP software. A possible solution is to cluster the icons and to create drop-down menus,
similar to a tool palette, in order to reduce the overwhelming cognitive load and improve the visual quality of current software design for sketching geometric graphs. In addition, it is crucial for teachers to acquire adequate knowledge in order to successfully implement GSP software in educational contexts that will be more amenable to geometric conceptualization by students.
To improve the pedagogical usability and affordances, the major problems identified towards better user-centered design need to be tackled and iterative enhancement of GSP software based on course-specific teaching and learning outcomes should be undertaken with continuous effort. The implementation of GSP software in classroom settings is a complex process that is related to the interplay of individual and technological factors, particularly in Taiwanese education cultures that emphasize students’ test scores and subject performance. Despite the benefits afforded by GSP software, teachers have reported difficulties in creating an inquiry-based GSP learning experience as it is time- consuming compared with lecture-based instruction. This integration problem may be coordinated through professional training in order to inspire teachers’ growth needs and development in their teaching competence.
Teachers’growth needs had a weakening effect between perceived usefulness, teachers’ attitudes, and their intentions to apply GSP software in their classrooms. It seems that teachers with higher growth needs had a comparatively higher expectation of what GSP software can afford in their teaching and perceived the current design features less positively, which led to weaker intentions to use the software. Regarding teachers with lower growth needs, they might find GSP software satisfies their teaching needs and were more willing to experiment with what it can afford as a teaching tool.
This is understandable in a test-oriented context and teaching-to-the-test culture in Taiwan because most high-performing mathematics teachers are still concerned about their students’ learning outcomes and performance. This interesting finding sustains the continuous effort that is needed to develop better GSP software that addresses both teaching and learning needs. The redesign and incorporation of context-dependent features that are aligned with teachers’ growth needs will be beneficial for sustainable use of the GSP software. Along with the software improvement, according to Mishra and
Koehler (2006), relevant professional knowledge serves as the fundamental requirement for teachers in understanding how technology relates to the pedagogy and content in their classroom practice. Comprehensive professional training support is indispensable and should be provided to improve teachers’ capabilities in utilizing GSP software in their instructional design and lesson planning. Engaging mathematics teachers in professional learning communities, which involves them in conversations about addressing the key elements of GSP-assisted curriculum design, can also support shifts in teachers’ attitudes and intentions for their long-term use of this new technology.
Implications and future direction
Despite the aim of this study to use mixed methods to add to the growing body of research surrounding the use of GSP software for geometry learning, it nevertheless has a number of limitations that should be discussed for future research. First and foremost, the data collection of this study was cross-sectional and based on self-reporting, which may have hindered the determination of causal relationships among the selected variables.
Researchers are encouraged to take a longitudinal approach to examine the effects over a longer period of time. Apart from that, the data were collected from only Taiwan secondary schools and thus the findings cannot be overgeneralized to other educational settings. Future research can use the same framework to collect data from other cultural settings. Second, the number of the participating teachers was not large enough to form an adequate sample size for conducting SEM. Future studies should increase the sample size by recruiting more voluntary and motivated secondary mathematics teachers with incentives and rewards to their current teaching jobs. Third, due to the research’s purpose and scope, this study only applied the basic technology acceptance model. It is recommended that researchers should undertake extended versions and incorporate different aspects of behavioral and psychological factors to pinpoint other influences on teachers’ intentions to use GSP software. Software redesign for a quality version to reduce teachers’ cognitive load in GSP use and planning for longitudinal observations of classroom practice is also suggested. While dexterous utilization of GSP software can generate targeted teaching and learning outcomes, future studies should examine how
teachers’ professional training development is related to their software use and students’
learning performance. By discussing all these issues, we hope that mathematics teachers can be empowered and motivated for more effective GSP software integration in their classes to attain meaningful educational goals in mathematics education.
Acknowledgements
The authors would like to thank our anonymous reviewers for their valuable feedback. This work was supported by Ministry of Science and Technology of Taiwan for its research grant support [MOST-103-2511-S-141-001 and NSC-100-2511-S-320-002- MY2]. All errors are exclusively those of the authors.
REFERENCES
Abdullah, A. H., Surif, J., Ibrahim, N. H., Ali, M., & Hamzah, M. H. (2014). The development of MyGSP: An online resource for teaching mathematics based on Geometer’s Sketchpad (GSP). Asian Social Science, 10(22), 227-240. doi:10.5539/
ass.v10n22p227
Ajzen, I., & Fishbein, M. (1980). Understanding attitudes and predicting social behavior.
Englewood Cliffs, NJ: Prentice-Hall.
Akayuure, P., & Apawu, J. (2015). Examining mathematical task and pedagogical usability of web contents authored by prospective mathematics teachers.
International Journal of Research in Education and Science, 1(2), 101-110.
doi:10.21890/ijres.69649
Albion, P. R., Tondeur, J., Forkosh-Baruch, A., & Peeraer, J. (2015). Teachers’
professional development for ICT integration: Towards a reciprocal relationship between research and practice. Education and Information Technologies, 20(4), 655-673.
Al-Emran, M., Mezhuyev, V., & Kamaludin, A. (2018). Technology acceptance model in M-learning context: A systematic review. Computers & Education, 125, 389-412.
doi: 10.10 16/j.compedu.2018.01.003
An, Y. J., & Reigeluth, C. (2011). Creating technology-enhanced, learner-centered classrooms: K–12 teachers’ beliefs, perceptions, barriers, and support needs. Journal of Digital Learning in Teacher Education, 28(2), 54-62. doi:
10.1080/21532974.2011.10784681
Bakar, K. A., Tarmizi, R. A., Ayub, A. F. M., & Yunus, A. S. M. (2009). Effect of utilizing Geometer’s Sketchpad on performance and mathematical thinking of secondary mathematics learners: An initial exploration. International Journal of Education and Information Technologies, 3(1), 20-27.
Baron, R. M., & Kenny, D. A. (1986). The moderator–mediator variable distinction in social psychological research: Conceptual, strategic, and statistical considerations.
Journal of Personality and Social Psychology, 51(6), 1173–1182.
Baylor, A. L., & Ritchie, D. (2002). What factors facilitate teacher skill, teacher morale, and perceived student learning in technology-using classrooms?. Computers &
Education, 39(4), 395-414. doi: 10.1016/S0360-1315(02)00075-1
Belbase, S. (2015). A preservice mathematics teacher’s beliefs about teaching mathematics with technology. International Journal of Research in Education and Science, 1(1), 31-44.
Calisir, F., Altin Gumussoy, C., Bayraktaroglu, A. E., & Karaali, D. (2014). Predicting the intention to use a web-based learning system: Perceived content quality, anxiety, perceived system quality, image, and the technology acceptance model. Human Factors and Ergonomics in Manufacturing & Service Industries, 24(5), 515-531.
doi: 10.1002/hfm.20548
Chan, K. K., & Leung, S. W. (2014). Dynamic geometry software improves mathematical achievement: Systematic review and meta-analysis. Journal of Educational Computing Research, 51(3), 311-325. doi:10.2190/EC.51.3.c
Cheng, Y.-H., Chen, J.-C. & Hsu, H.-Y. (2017). Junior high school students conjecture geometric properties in a dynamic geometry software environment. Taiwan Journal of Mathematics Education, 4(1), 1- 34. doi: 10.6278/tjme.20170317.001
Chou, C.-Y., & Lu, L. (2014). Exploring the attitude differentiation on e-Learning systems based on TAM: The strength of growth need as a moderator. Journal of Information Management, 21(1), 83-105.
Christou, C., Mousoulides, N., Pittalis, M., & Pitta-Pantazi, D. (2004). Proofs through exploration in dynamic geometry environments. International Journal of Science and Mathematics Education, 2(3), 339-352.
Chuang, H.-H., Weng, C.-Y., & Huang, F.-C. (2015). A structure equation model among factors of teachers' technology integration practice and their TPCK. Computers &
Education, 86, 182-191. doi: 10.1016/j.compedu.2015.03.016
Clark, A. K., & Whetstone, P. (2014). The impact of an online tutoring program on mathematics achievement. The Journal of Educational Research, 107(6), 462-466.
doi: 10.1080/00220671.2013.833075
Davis, F. D. (1989). Perceived usefulness, perceived ease of use, and user acceptance of
information technology. MIS Quarterly, 13(3), 319-340. doi: 10.2307/249008
Davis, F. D., Bagozzi, R. P., & Warshaw, P. R. (1989). User acceptance of computer technology: A comparison of two theoretical models. Management Science, 35(8), 982-1003. doi: 10.1287/mnsc.35.8.982
Feille, K. K., Nettles, J. R., & Weinburgh, M. H. (2018). Silhouettes of development: A tool for understanding the needs and growth of science teachers. Journal of Science Teacher Education, 29(1), 30-45. doi: 10.1080/1046560X.2017.1422644
Fishbein, M. & Ajzen, I. (1975). Belief, attitude, intention and behaviour: An introduction to theory and research. Reading, MA: Addison-Wesley.
Fornell, C., & Larcker, D. F. (1981). Evaluating structural equation models with unobservable variables and measurement error. Journal of Marketing Research, 18(1), 39-50. doi: 10.2307/3151312
Furner, J. M., & Marinas, C. A. (2007). Geometry sketching software for elementary children: Easy as 1, 2, 3. Eurasia Journal of Mathematics, Science & Technology Education, 3(1), 83-91.
Hackman, J. R., & Lawler, E. E. (1971). Employee reactions to job characteristics.
Journal of Applied Psychology, 55(3), 259-286. doi: 10.1037/h0031152
Hair, J. F., Black, W. C., Babin, B. J., & Anderson, R. E. (2010). Multivariate data analysis. Englewood Cliffs, NJ: Prentice Hall.
Hanna, G. (2000). Proof, explanation and exploration: An overview. Educational Studies in Mathematics, 44(1-2), 5-23.
Hannafin, R. D., Burruss, J. D., & Little, C. (2001). Learning with dynamic geometry programs: Perspectives of teachers and learners. The Journal of Educational Research, 94(3), 132-144. doi: 10.1080/00220670109599911
Harel, G., & Sowder, L. (2007). Toward comprehensive perspectives of the learning and teaching of proof. In F. K. Lester Jr. (Ed.), Second handbook of research on mathematics teaching and learning (pp. 805-842). Charlotte, NC: Information Age Publishing.
Hollebrands, K. F. (2007). The role of a dynamic software program for geometry in the strategies high school mathematics students employ. Journal for Research in
Mathematics Education, 38(2), 164-192. doi:10.2307/30034955
Holmes, V. L., & Hwang, Y. (2016). Exploring the effects of project-based learning in secondary mathematics education. The Journal of Educational Research, 109(5), 449-463. doi: 10.1080/00220671.2014.979911
Hooper, D., Coughlan, J., & Mullen, M. (2008). Structural equation modelling:
Guidelines for determining model fit. The Electronic Journal of Business Research Methods, 6(1), 52-60. doi: 10.21427/D7CF7R
Hoyles, C., & Noss, R. (1994). Dynamic geometry environments: What's the point?
Mathematics Teacher, 87, 716-717.
Huang, C. K., Hsin, C. O. & Chiu, C. H. (2010). Evaluating CSL/CFL website usability:
A user-center approach design. Journal of Educational Multimedia and Hypermedia, 19 (2), 177-210.
Hsu, H. Y., & Edward, A. S. (2014). Cognitive complexity of mathematics instructional tasks in a Taiwanese classroom: An examination of task sources.
Journal for Research in Mathematics Education, 45(4), 460-496. doi:10.5951/
jresematheduc.45.4.0460
Jones, K. (2000). Providing a foundation for deductive reasoning: Students’
interpretations when using dynamic geometry software and their evolving mathematical explanations. Educational Studies in Mathematics, 44, 55-85.
Joo, Y. J., So, H. J., & Kim, N. H. (2018). Examination of relationships among students' self-determination, technology acceptance, satisfaction, and continuance intention to use K-MOOCs. Computers & Education, 122, 260-272. doi: 10.1016/
j.compedu.2018.01.003
Joubert, M. (2013). Using digital technologies in mathematics teaching: Developing an understanding of the landscape using three “grand challenge” themes. Educational Studies in Mathematics, 82(3), 341-359.
Jr. Hair, J. F., Black, W. C., Babin, B. J., & Anderson, R. E. (2014). Multivariate data analysis (7th ed.). Essex, UK: Pearson Education.
Karakuş, F., & Peker, M. (2015). The effects of dynamic geometry software and physical manipulatives on pre-service primary teachers’ van Hiele levels and spatial
abilities. Turkish Journal of Computer and Mathematics Education, 6(3), 338-365.
doi:10.16949/turcomat.31338
Kaufmann, H., & Schmalstieg, D. (2003). Mathematics and geometry education with collaborative augmented reality. Computers & Graphics, 27(3), 339-345.
doi:10.1016/S0097-8493(03)00028-1
Knapp, A. K., Barrett, J. E., & Moore, C. J. (2016). Prompting teacher geometric reasoning through coaching in a dynamic geometry software context. School Science and Mathematics, 116(6), 326-337. doi:10.1111/ssm.12184
Knuth, E. J., & Elliot, R. (1998). Characterizing students’ understandings of mathematical proofs. Mathematics Teacher, 91(8), 714-717.
Kong, S. C., Chan, T.-W., Huang, R., & Cheah, H. M. (2014). A review of e-learning policy in school education in Singapore, Hong Kong, Taiwan, and Beijing:
Implications to future policy planning. Journal of Computers in Education, 1(2-3), 187-212. doi: 10.1007/s40692-014-0011-0
Koyuncu, I., Akyuz, D., & Cakiroglu, E. (2015). Investigating plane geometry problem- solving strategies of prospective mathematics teachers in technology and paper-and- pencil environments. International Journal of Science and Mathematics Education, 13(4), 837-862.
Lee, D. Y., & Lehto, M. R. (2013). User acceptance of YouTube for procedural learning:
An extension of the technology acceptance model. Computers & Education, 61, 193-208. doi: 10.1016/j.compedu.2012.10.001
Lehrer, R., & Chazan, D. (2012). Designing learning environments for developing understanding of geometry and space. Mahwah, NJ: Routledge.
Leikin, R., & Grossman, D. (2013). Teachers modify geometry problems: From proof to investigation. Educational Studies in Mathematics, 82(3), 515-531.doi: 10.1007/
s10649-012-9460-4
Lennex, L., & Nettleton, K. F. (2012). Cases on inquiry through instructional technology in math and science. Hershey, PA: IGI Global.
Leong, K. E. (2013). Impact of geometer's sketchpad on students achievement in graph functions. Malaysian Online Journal of Educational Technology, 1(2), 19-33.
MacCallum, R. C., Browne, M. W., & Sugawara, H. M. (1996). Power analysis and determination of sample size for covariance structure modeling. Psychological Methods, 1(2), 130-149. doi: 10.1037/1082-989X.1.2.130
McLeod, J., Vasinda, S., & Dondlinger, M. J. (2012). Conceptual visibility and virtual dynamics in technology-scaffolded learning environments for conceptual knowledge of mathematics. Journal of Computers in Mathematics and Science Teaching, 31(3), 283-310.
Mertens, D. M. (2014). Research and evaluation in education and psychology:
Integrating diversity with quantitative, qualitative, and mixed methods. Thousands Oak, CA: Sage Publications.
Mishra, P., & Koehler, M. (2006). Technological pedagogical content knowledge: A framework for integrating technology in teacher knowledge. Teachers College Record, 108(6), 1017-1054. doi: 10.1111/j.1467-9620.2006.00684.x
Motaghian, H., Hassanzadeh, A., & Moghadam, D. K. (2013). Factors affecting university instructors' adoption of web-based learning systems: Case study of Iran.
Computers & Education, 61, 158-167. doi: 10.1016/j.compedu.2012.09.016
Mumtaz, S. (2000). Factors affecting teachers' use of information and communications technology: A review of the literature. Journal of Information Technology for Teacher Education, 9(3), 319-342. doi:10.1080/14759390000200096
Nielsen, J., & Landauer, T. K. (1993). A mathematical model of the finding of usability problems. Paper presented at the Proceedings of ACM INTERCHI'93 Conference, Amsterdam, The Netherlands.
Niess, M. L. (2011). Investigating TPACK: Knowledge growth in teaching with technology. Journal of Educational Computing Research, 44(3), 299-317. doi:
10.2190/EC.44.3.c
Nokelainen, P. (2006). An empirical assessment of pedagogical usability criteria for digital learning material with elementary school students. Journal of Educational Technology & Society, 9(2), 178-197.
Nordin, N., Zakaria, E., Mohamed, N. R. N., & Embi, M. A. (2010). Pedagogical usability of the Geometer's Sketchpad (GSP) digital module in the mathematics
teaching. The Turkish Online Journal of Educational Technology, 9(4), 113-117.
Okumuş, S., Lewis, L., Wiebe, E., & Hollebrands, K. (2016). Utility and usability as factors influencing teacher decisions about software integration. Educational Technology Research and Development, 64(6), 1227-1249. doi:10.1007/s11423- 016-9455-4
Olive, J. (2013). Dynamic and interactive mathematics learning environments:
Opportunities and challenges for future research. Mevlana International Journal of Education, 3(3), 8-24. doi: 10.13054/mije.si.2013.02
Olkun, S., Sinoplu, N. B., & Deryakulu, D. (2009). Geometric explorations with dynamic geometry applications based on van Hiele levels. Colección Digital Eudoxus, 1(2).
Retrieved from http://www.cimm.ucr.ac.cr/ojs/index.php/eudoxus/article/view/97/92 Ottenbreit-Leftwich, A. T., Glazewski, K. D., Newby, T. J., & Ertmer, P. A. (2010).
Teacher value beliefs associated with using technology: Addressing professional and student needs. Computers & Education, 55(3), 1321-1335. doi: 10.1016/
j.compedu.2010.06.002
Padilla-MeléNdez, A., Del Aguila-Obra, A. R., & Garrido-Moreno, A. (2013).
Perceived playfulness, gender differences and technology acceptance model in a blended learning scenario. Computers & Education, 63, 306-317. doi: 10.1016/
j.compedu.2012.12.014
Podsakoff, P. M., MacKenzie, S. B., Lee, J.-Y., & Podsakoff, N. P. (2003). Common method biases in behavioral research: A critical review of the literature and recommended remedies. Journal of Applied Psychology, 88(5), 879. doi:
10.1037/0021-9010.88.5.879
Potter, S. L., & Rockinson Szapkiw, A. J. (2012). Technology integration for instructional improvement: The impact of professional development. Performance Improvement, 51(2), 22-27. doi: 10.1002/pfi.21246
Ross, J. A., & Bruce, C. D. (2007). Teacher self-assessment: A mechanism for facilitating professional growth. Teaching and Teacher Education, 23(2), 146-159. doi:
10.1016/j.tat e.2006.04.035
Serra, M. (2015). Discovering geometry. Dubuque, IA: Kendall Hunt.