Adsorption and photochemistry of
CH3CN
and
CH3CONH2
on
powdered TiO2
Chih-Chung Chuang, Wen-Chun Wu, Ming-Xi Lee and Jong-Liang Lin*
Department of Chemistry, National Cheng Kung University, 1, T a Hsueh Road, T ainan, T aiwan, 701, ROC. E-mail : jonglin=mail.ncku.edu.tw
Received 24th April 2000, Accepted 4th July 2000 Published on the Web 1st August 2000
The adsorption and photochemistry of acetonitrile and acetamide onTiO have been studied by 2
Fourier-transform infrared spectroscopy (FTIR). AdsorbedCH g2(N,O)- are 3CN, CH3CONH2, CH3CONH formed afterCH adsorption on The last two species are due to surface hydroxy groups attacking
3CN TiO2.
the electron-deÐcient carbon in the cyano group of the adsorbed acetonitrile. UV exposure causes decomposition ofCH to and decomposition of and
g2(N,O)-3CN(a) CH2CN(a) CH3CONH2(a) CH3CONH(a) toCH HCOO(a), NCO(a) and CN-containing species on the surface.
3COO(a),
Introduction
Due to the sensitive variation in the CN stretching frequency ofCH bonded on various surface sites, it has been used
3CN
to probe the surface states of metals and metal oxides. is bonded to Pt(111) by g2(C,N) coordination at sub-CH
3CN
monolayer coverage, i.e., C and N atoms are coordinated simultaneously to the surface. At this bonding geometry, the C2N stretching absorbs at 1615 cm~1, as evidenced by elec-tron energy-loss spectroscopy (EELS).1 On Ni(111), Sexton1 and Kishi2 have proposed thatCH is also adsorbed with
3CN
g2(C,N) coordination in contrast to the bonding geometry through the N atom proposed by Friend et al.3 On Ag(110), is weakly adsorbed on the surface and is desorbed at CH
3CN
166 K. However, on a partially oxidized Ag surface, CH 3CN is more strongly adsorbed with the CN p-electrons interacting with surface Lewis acid sites, exhibiting CN stretching at 1840 cm~1.4 Further EELS study shows the formation of a anionic adsorbed species with a 2075 cm~1 CN CH
2CN
stretching frequency, indicating theBrÔnstedbase character of the partially oxidized Ag surface.4 On metal oxides, based on the extent of the blue-shift of the CN stretching of CH
3CN coordinated through the N atom to surface Lewis or BrÔnsted acid sites, the relative acidity of the sites can be measured.5h12 In addition to the acidÈbase interaction,CH may
disso-3CN
ciate on some metal oxides. Ona-Fe and 2O3, CH3CONH2(a) are formed from the reaction of and CH
3CONH(a) CH3CN
surface OH groups.13 CH is also observed on 3CONH(a)
ZnO14 and d-Al and can be chemically transformed 2O315
into CH on forms anionic
3COO(a). CH3CN CeO2 CH2CN and CH species.16 Photocatalyzed oxidative
degrada-3CNO
tion ofCH on has been studied by Lichtin et al.17 3CN TiO2
and by Zhuang et al.18 LichtinÏs group observed, by gas chro-matography, the formation of a(CN) intermediate and
2 CO2,
and products. Zhuang et al. found, using IR spec-H
2O HNO3
troscopy, the isocyanate species (NCO) adsorbed on the surface during CH photooxidation. From the product
3CN
distribution ofCH photodegradation on multiple 3CN TiO2,
reaction routes must occur. For example, (CN) and NCO 2
from CÈC bond cleavage,HNO from C3N triple bond cleav-3
age and H from CÈH bond cleavage are expected. Con-2O
sidering the complex chemical behavior, it is worth further study of CH photooxidation to gain more insights into
3CN the reaction pathways.
In the present paper, in addition to the study of photooxi-dation ofCH on in relation to the issue of
photoox-3CN TiO2
idative destruction of organic molecules detrimental to the environment, we focus on the interaction of CH with
3CN surface hydroxy groups present on the TiO surface ; it is
2
found thatCH and are generated on the 3CONH2 CH3CONH
surface. Therefore the adsorption and photochemistry of are also investigated.
CH
3CONH2
Experimental
The preparation ofTiO powder supported on a tungsten Ðne 2
mesh (D6 cm2) has been described previously.19,20 BrieÑy, powder (Degussa P25, D50 m2 g~1, anatase 70%, rutile TiO
2
30%) was dispersed in waterÈacetone solution to form a uniform mixture which was then sprayed onto a tungsten mesh. TheTiO sample was then mounted inside the IR cell
2
for simultaneous photochemistry and FTIR. The IR cell with twoCaF windows for IR transmission down to 1000 cm~1
2
was connected to a gas manifold which was pumped by a 60 L s~1 turbomolecular pump with a base pressure of D1] 10~7 Torr. TheTiO sample in the cell was heated to 450 ¡C under
2
vacuum for 24 h by resistive heating. The temperature of the sample was measured by a K-type thermocouple spot-TiO
2
welded onto the tungsten mesh. Before each experimental run, theTiO sample was heated to 450 ¡C in vacuum for 2 h. 10
2
TorrO was then introduced into the cell as the sample was 2
cooled to 70 ¡C. When the TiO temperature reached 35 ¡C, 2
the cell was evacuated prior to gas dosing. TheTiO surface 2 after the above treatment still possessed residual hydroxy groups.21 Before introducing the vapor to the cell, CH
3CN (liquid, 99.97%, Tedia) was puriÐed by several freezeÈpumpÈ thaw cycles ; CH (solid, 98%, Aldrich) was
well-3CONH2
outgassed under vacuum.O (99.998%) was used as received 2
from Matheson. The pressure was monitored with a Baratron capacitance manometer and an ion gauge. In the photochem-istry study, both the UV and IR beams were set 45¡ to the normal of theTiO sample. The UV light source used was a
2
combination of a 350 W Hg arc lamp (Oriel Corp), a water Ðlter, and a band pass Ðlter with a band width of D100 nm centered at 320 nm (Oriel 51650). The power at the position of theTiO sample was D0.24 W cm~2 measured in the air by a
2
power meter (Molectron, PM10V1). CH and 3CN are transparent for the wavelength used in this CH
3CONH2
study.22 IR spectra were obtained with 4 cm~1 resolution using a Bruker FTIR spectrometer with a MCT detector. The entire optical path was purged with CO dry air. The
2-free
spectra presented here have been ratioed against a clean TiO 2 spectrum providing the background reference.
Results and discussion
Adsorption ofCH and
3CN CH3CONH2
Fig. 1(a) shows the IR spectra of TiO exposed to 2 Torr of 2
and then evacuated at 35 ¡C. The absorptions in the CH
3CN
3600È3800 cm~1 region due to isolated surface hydroxy groups are attenuated following CH adsorption. Bands
3CN
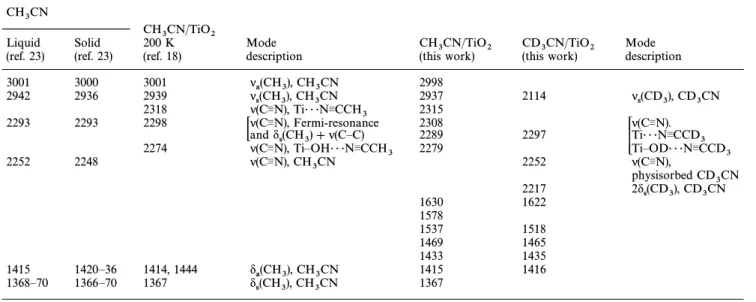
located at 1367, 1415, 1433, 1469, 1537, 1578, 1630, 2279, 2289, 2308, 2315, 2937 and 2998 cm~1 are observed. Table 1 com-pares our observations with the IR absorptions of CH
3CN molecules in the liquid and solid states (Ðrst two columns of Table 1) andCH on at 200 K (third column, Table
3CN TiO2
1) reported by Zhuang et al.18 The CN stretching frequency of adsorbedCH is a†ected by its adsorption sites on
3CN TiO2
as shown in the fourth column in Table 1. Absorptions in the
Fig. 1 IR spectra of aTiO surface exposed to 2 Torr of (a)
2 CH3CN
andCD (b) at 35 ¡C and then evacuated for 20 min. Both spectra 3CN
were recorded with 50 scans at 35 ¡C. The mass ofTiO used was 2
D70 mg.
region 1250È1750 cm~1 are more complex, to clearly assign the bands in this range,CD adsorption on a surface
3CN TiO2 has also been studied. Prior toCD dosing into the
reac-3CN
tion cell, the OH groups onTiO were replaced with OD(a) 2
by repeating several cycles ofD adsorption, annealing, and 2O
evacuation at 250 ¡C until no OH(a) was found. Fig. 1(b) shows the IR spectrum ofTiO exposed to 2 Torr of
2 CD3CN
and then evacuated at 35 ¡C. FollowingCD adsorption, 3CN
as in theCH case, attenuation of OD(a) absorptions in 3CN
the region 2650È2800 cm~1 is also observed (not shown). In the CN stretching frequency range, a strong, broad band peaked at 2297 cm~1 and two small bands at 2217 and 2252 cm~1 appear. It is noteworthy that Fermi-resonance of CN stretching is absent in the CD case. The unresolved,
3CN
strong band at 2297 cm~1 can be assigned to the CN stretch-ing mode ofCH interacting with surface OD groups
3CN(a)
and Lewis acid sites. Its high intensity indicates that most of the adsorbed CD molecules adopt such surface
adsorp-3CN
tion states. The weak band located at 2252 cm~1 is the same as or very close to the CN stretching absorption of liquid or solid CH molecules23 and can be attributed to a small
3CN
amount of physisorbed CD on the surface. The other 3CN
weak 2217 cm~1 band is similar to the previously observed band at 2211 cm~1 forCD in the solution phase, which
3CN
has been ascribed to the overtone of CD symmetric 3
bending.24 For the absorptions in the 1250È1750 cm~1 region, bands at 1416, 1435, 1465, 1518 and 1622 cm~1 are observed. All these bands have similar frequencies, but with varying intensity relative to CH absorptions in this range.
3CN
However, no strong, sharp band at D1367 cm~1 is observed in Fig. 1(b), therefore this peak is assigned toCH symmetric
3
bending ofCH Table 1 summarizes the band assignment 3CN.
for the CH vibrational frequencies observed after the 3CN
adsorption ofCH and on The bands in 3CN CD3CN TiO2.
the region 1250È1750 cm~1 in Fig. 1, except that at 1367 cm~1, cannot be completely attributed to the adsorbed ace-tonitrile, because they are observed for both CH and
3CN compounds. The lack of an isotope shift indicates CD
3CN
that some of theCH and have, after adsorption 3CN CD3CN
onTiO been chemically transformed into other species on 2,
the surface. Previously, Lorenzelli et al.13 investigated adsorption on and found absorption bands CH
3CN a-Fe2O3
at 1380, 1450, 1470, 1560 and 1640 cm~1 which could not be attributed to adsorbed CH Furthermore, a similar
3CN.
absorption feature was obtained after adsorption of on this surface. Accordingly, the above Ðve CH
3CONH2
bands observed in CH adsorption on were 3CN a-Fe2O3
Table 1 Comparison and assignments for the vibrational frequencies of acetonitrile CH
3CN
CH
3CN/TiO2
Liquid Solid 200 K Mode CH
3CN/TiO2 CD3CN/TiO2 Mode
(ref. 23) (ref. 23) (ref. 18) description (this work) (this work) description
3001 3000 3001 m a(CH3), CH3CN 2998 2942 2936 2939 m s(CH3), CH3CN 2937 2114 ms(CD3), CD3CN 2318 m(C3N), TiÉ É ÉN3CCH 3 2315 2293 2293 2298 Tm(C3N), Fermi-resonance 2308 Tm(C3N). Sand d s(CH3)] m(CÈC) 2289 2297 tTiÉ É ÉN3CCD3 2274 m(C3N), TiÈOHÉ É ÉN3CCH 3 2279 STiÈODÉ É ÉN3CCD3 2252 2248 m(C3N), CH 3CN 2252 m(C3N),physisorbed CD 3CN 2217 2d s(CD3), CD3CN 1630 1622 1578 1537 1518 1469 1465 1433 1435 1415 1420È36 1414, 1444 d a(CH3), CH3CN 1415 1416 1368È70 1366È70 1367 d s(CH3), CH3CN 1367
attributed to the generation ofCH responsible for 3CONH2(a)
the 1380, 1470 and 1640 cm~1 and its dissociative adsorption species, CH responsible for 1450 and 1560 cm~1
3CONH(a),
due to ÈCNOÈ stretching vibrations. Krietenbrink et al.15 have observed similar chemical transformation of CH
3CN into CH evidenced by bands at 1495 and 1595
3CONH(a),
cm~1, on d-Al In the present study, the bands at 1415, 2O3.
1433, 1469, 1537, 1578 and 1630 cm~1 observed after CH3CN adsorption on TiO (see Fig. 1(a)) are very likely due to
2
and formation. The bands due CH
3CONH2(a) CH3CONH(a)
to C2O and CÈN stretching vibrations ofCH and 3CONH2(a) those due to ÈCNOÈ stretching vibrations of CH
3CONH(a) would not show a primary isotope shift as H is replaced by D. This explains, except for theCH symmetric bending at 1367
3
cm~1 in theCH case, why similar absorption frequencies 3CN
in the 1250È1750 cm~1 range are detected afterCD and 3CN adsorption on The most direct way to identify CH
3CN TiO2.
the formation of CH and due to 3CONH2(a) CH3CONH(a) adsorption on is to investigate the absorption CH
3CN TiO2
spectra of CH on the surface. Fig. 2 shows the 3CONH2
spectra for the adsorbed species after exposing a clean TiO 2 surface to CH vapor for 25 min, followed by
evac-3CONH2
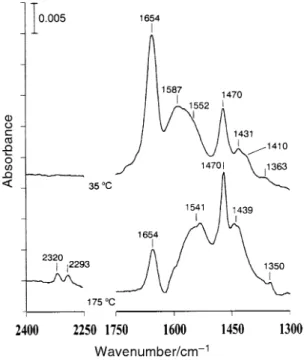
uation at 35 and 175 ¡C. For the 35 ¡C spectrum, absorption bands located at 1363, 1410, 1431, 1470, 1552, 1587 and 1654 cm~1 are observed. After heating to 175 ¡C, these bands can be divided into two sets showing opposite trends of intensity
Fig. 2 IR spectra of a TiO surface exposed to the vapor of 2
for 25 min at 35 ¡C and then evacuated at 35 ¡C for 30 CH
3CONH2
min and at 175 ¡C for 1 min. Both spectra were recorded with 50 scans at 35 ¡C. The mass ofTiO used was D72 mg.
2
variation with temperature. One set, including the bands at 1363, 1410, 1587 and 1654 cm~1, decreases in intensity as the temperature is raised. The other set, with bands at 1439, TiO
2
1470 and 1541 cm~1 increases in intensity with increasing temperature. The former set is attributed to adsorbed exhibiting carbonyl stretching at 1654 cm~1, CH
3CONHbending at 1587 cm~1, CÈN stretching at 1410 cm~12(a) NH
2
andCH bending at 1363 cm~1. This assignment is supported 3
by the similar absorptions of acetamide molecules in liquid as shown in the Ðrst column in Table 2. The presence of two sets of bands with opposite intensity change with surface tem-perature can be explained by the decomposition of acetamide on the surface. A recent study of formamide adsorption on has shown the formation of bridging g 2(N,O)-TiO
2
HCONH(a).26 A similar dissociation process is expected to occur in the acetamide case. The strong bands at 1439, 1470 and 1541 cm~1 in Fig. 2, assignable to ÈCNOÈ stretching, reveal the formation of g2(N,O)-CH Acetic acid,
3CONH(a).
analogous to acetamide, is also dissociatively adsorbed on to produce bridging acetate which exhibits strong peaks TiO
2
at 1423 (shoulder), 1456 and 1532 cm~1 due to ÈCOOÈ stretching (this will be shown later in Fig. 4). Comparing the absorption features in the 1250È1750 cm~1 region after the adsorption of CH and in Fig. 1 and 2, a
3CN CH3CONH2
close resemblance in peak frequency and peak shape is observed. It is concluded that CH reacts with surface
3CN
hydroxy groups, generating CH and g 2(N,O)-3CONH2(a)
on the surface. Table 2 shows the comparison CH
3CONH(a)
of the observed frequencies in the 1250È1750 cm~1 region
after CH and
3CN, CD3CN, CH3CONH2 CH3COOH adsorption on theTiO surface and the corresponding
vibra-2
tional mode assignments. In addition to the chemical trans-formation toCH and g2(N,O)- after
3CONH2(a) CH3CONH(a) acetamide adsorption on TiO new peaks located at 2293
2,
and 2320 cm~1 in Fig. 2, which are assignable to CN stretch-ing, grow at temperatures above D150 ¡C, indicating that C2O and NÈH bonds of the acetamide are thermally activat-ed. These two peaks, together with the 1350 cm~1 band are close, in position and relative intensity, to the CH
3CN(a) absorptions at 1367, 2279 and 2308 cm~1 in Fig. 1. This simi-larity suggests the formation of acetonitrile from thermal reorganization of acetamide on TiO
2. Photochemistry ofCH and
3CN CH3CONH2
Fig. 3 shows the IR spectra taken before and after the indi-cated UV irradiation times during the photooxidation of the adsorbed species, which were prepared by exposing a clean surface to vapor and then followed by evac-TiO
2 CH3CN
uation, in 10 Torr ofO Before UV irradiation, the three 2.
species of CH and g2(N,O)-3CN(a), CH3CONH2(a)
are already known to be present on the surface CH
3CONH(a)
afterCH adsorption on UV irradiation causes loss 3CN TiO2.
or enhancement in intensity for the existing bands and forma-tion of new peaks. After 5 min irradiaforma-tion, while the amount
Table 2 Vibrational frequencies and assignments ofCH and
g2(N,O)-3CONH2 CH3CONH
g2(N,O)-
g2(O,O)-CH
3CONH2 CH3CONH2/ CH3CONH/ CH3COO/ CH3CN/ CD3CN/
liquid TiO
2 Mode TiO2 Mode TiO2 Mode TiO2 TiO2
(ref. 25) (this work) description (this work) description (this work) description (this work) (this work)
1660 1654 l(CO) 1630 1622 1600 1587 d(NH 2) 1541 T 1532 T 15781537 1518 1470 tl(CNO) 1456 tl(COO) 1469 1465 1439 S 1423 S 1433 1435 1388 1410 l(CN) 1415 1416 1345 1363 d(CH 3)
Fig. 3 IR spectra taken before and after the indicated UV exposure times during the photooxidation course of the adsorbed species, which were formed by exposing a clean surfaceTiO surface to 2 Torr of
2
and then evacuated at 35 ¡C, in 10 Torr of Each spec-CH
3CN O2.
trum was recorded with 5 scans.
of adsorbedCH decreases, as evidenced by the reduction 3CN
of its characteristic absorptions at 1367, 2279, 2308 and 2937 cm~1, that of g2(N,O)-CH increases as indicated
3CONH(a)
by the enhancement of the bands at 1433, 1469 and 1549 cm~1. Absorptions of surface OH groups in the 3600È3800 cm~1 region increase after irradiation. The observable dip at 2349 cm~1 shows the formation of CO in the gas phase. A
2
weak absorption at D2073 cm~1 and a strong band at 2204 cm~1 appear. The latter band is identiÐed as adsorbed NCO; a similar band has been observed in the previously studied photooxidation process.18 The 2073 cm~1 band is CH
3CN
likely due to the formation of anionic CH species, as 2CN(a)
observed in CH adsorption on a partially oxidized Ag 3CN
surface,4 CeO and with basic surface sites. 2,16 c-Al2O327
After 40 min irradiation,CH continues to decrease. On 3CN(a)
the other hand, in addition to the increase inCO enhanced 2,
absorptions occur at 1356, 1380, 1439, 1556 and 1651 cm~1 and in the 3000È3500 cm~1 region. After further irradiation to 90 min,CH and NCO(a) are substantially reduced. The
3CN(a)
1469 cm~1 band due to g2(N,O)-CH is almost 3CONH(a)
completely depleted. In this photoreaction process, CH 3CN(a) decreases with UV irradiation and is totally consumed after 150 min, in contrast to the monotonic growth of CO
2(g). g2(N,O)-CH increases in the initial stage, however,
3CONH(a)
prolonged irradiation causes its loss. NCO(a) also increases initially with UV irradiation, but gradually declines after 40 min. After 150 min irradiation, the bands left to be identiÐed appear at 1356, 1380, 1442, 1549, 1651, 2868, 2954, 3163, 3272 and 3375 cm~1. The strong absorptions at 1356, 1380, 1442 and 1549 cm~1 are attributed to ÈCOOÈ stretching of acetate and formate formed in the photoreaction. These two species have been identiÐed on metal oxides and in solution at similar frequencies.28 Previously, in the study of adsorption of formic acid29 and formaldehyde30 on TiO HCOO(a) was formed,
2,
showing its characteristic absorptions for ÈCOOÈ stretching at 1360 and 1550 cm~1 and for CH deformation at 1380 cm~1. Further conÐrmation for the formation of acetate on is obtained by examining the absorption frequencies of TiO
2
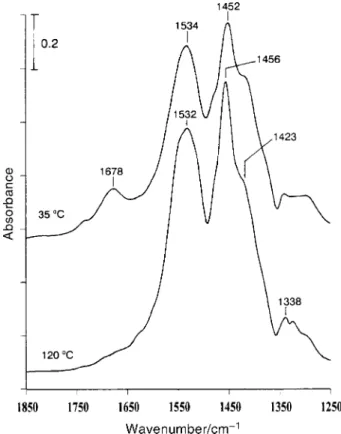
acetate formed by dissociative acetic acid adsorption on this surface. Fig. 4 shows the IR spectra of theTiO surface after
2
adsorption followed by evacuation at 35 and CH
3COOH
120 ¡C, respectively. For the spectrum at 35 ¡C, both represented by the 1678 cm~1 band due to car-CH
3COOH(a)
bonyl stretching, and CH represented by the 1423, 3COO(a)
1452 and 1534 cm~1 bands due to ÈCOOÈ stretching are present on the surface. Heating to 120 ¡C causes the disap-pearance ofCH and increase in The
3COOH(a) CH3COO(a). peak positions and relative intensity of the acetate bands at 1456 and 1532 cm~1 are similar to those of the growing bands at 1442 and 1549 cm~1 in Fig. 3, indicating the formation of acetate groups in the photooxidation of the adsorbed species formed afterCH adsorption on In the
photooxida-3CN TiO2.
tion study ofCH on by Zhuang et al.,18 they also 3CN TiO2
observed similar absorption bands at 1356, 1442 and 1556 cm~1 which were assigned to surface carbonate or bicar-bonate species. However, in our case, the 1356, 1380, 1442 and 1549 cm~1 bands grow with the 2868 and 2954 cm~1 bands assignable toCH stretching29,30 in Fig. 3, strongly
support-x
ing the formation of formate and acetate duringCH pho-3CN tooxidation in O rather than carbonate or bicarbonate
2,
species. In the present study, in addition to formate and acetate formation, the characteristic absorptions at 3163, 3272 and 3375 cm~1 in Fig. 3 indicate the formation of species con-taining NH functional groups ; these absorption bands,
x
together with that at 1651 cm~1, are found to be very similar to the recent observation in the photooxidation of formamide onTiO suggesting that or/and HCONH(a)
2,26 HCONH2(a)
are likely to be generated. It should be pointed out that the surface temperature was raised to 80 ¡C upon the UV TiO
2
irradiation in the study for Fig. 3. Therefore a thermal control experiment was carried out by holding the surface tem-perature at 80 ¡C for theTiO sample after
adsorp-2 CH3CN tion and evacuation at 35 ¡C and by measuring the IR spectra during the surface annealing in 10 Torr ofO However, it
2.
was found that, after 180 min, as shown in Fig. 5, the major
Fig. 4 IR spectra of aTiO surface exposed to 2 Torr of acetic acid 2
and then evacuated at 35 ¡C for 20 min and at 120 ¡C for 1 min. Both spectra were recorded with 50 scans at 35 ¡C. The mass ofTiO used
2 was D67 mg.
Fig. 5 IR spectra taken afterCH adsorption followed by evac-3CN
uation at 35 ¡C (a) and then by 180 min surface annealing at D80 ¡C in 10 Torr ofO (b).
2
change of this surface annealing is the enhanced absorptions at 1433, 1470, 1547 and 1650 cm~1 due to the increase in adsorbed CH and g2(N,O)- Since 3CONHand g2(N,O)-2 CH3CONH.are present on CH
3CONH2(a) CH3CONH(a)
theTiO after adsorption, their photochemistry was 2 CH3CN
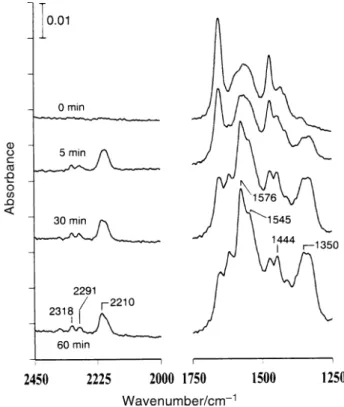
also studied. Fig. 6 shows the IR spectra taken before and after the indicated UV times during the photooxidation of the adsorbed species, which were prepared by exposing a clean surface to followed by evacuation at TiO
2 CH3CONH2
100 ¡C, in 10 Torr ofO After UV irradiation, the bands at 2.
1350, 1444, 1545, 1576, 2210, 2291 and 2318 cm~1 grow at the expense ofCH and g2(N,O)- as
evi-3CONH2(a) CH3CONH(a), denced by the decrease in the 1469 and 1654 cm~1 bands. Similar positions to the Ðrst Ðve growing bands in Fig. 6 are also observed in Fig. 3, indicating the formation of HCOO(a), and NCO(a). The last two new bands at 2291 CH
3COO(a)
and 2318 cm~1 fall in the CN stretching frequency range, demonstrating the formation of species containing this func-tional group. A thermal control experiment was also per-formed to check the surface heating e†ect during the photoprocess ; it showed no formation of the photoreaction bands.
After identiÐcation of the species responsible for the observed bands in Fig. 3 and Fig. 6 in the photoreactions catalyzed byTiO after and adsorption,
2 CH3CN CH3CONH2 the reaction pathways followingCH adsorption on
3CN TiO2 are summarized in Scheme 1.CH is photooxidized to
3CN(a)
anionicCH as an intermediate. Adsorbed can
2CN(a) CH3CN
react with surface hydroxy groups to form CH
3CONH2(a) and g2(N,O)-CH which on further photooxidation
3CONH(a)
form HCOO(a), CH NCO(a) and CN-containing 3COO(a),
species. In the previous study ofCH photooxidation on 3CN
Zhuang et al.18 proposed a mechanism for NCO(a) for-TiO
2,
mation directly from CH adsorbed on a surface Ti ion 3CN
site. In this mechanism, CH loses the methyl group, 3N
forming CO and adsorbed CN radical in the photo-2(g)
degradation. NCO(a) results from the CN radical attacking
Fig. 6 IR spectra taken before and after the indicated UV irradia-tion times during the photooxidairradia-tion process of the adsorbed species, which were formed by exposing a cleanTiO surface to
2 CH3CONH2
vapor for 25 min followed by annealing at 100 ¡C for 1 min under vacuum, in 10 Torr ofO Each spectrum was recorded with 5 scans.
2.
the TiO surface. Since in our study it is found that 2 is generated after adsorption on CH
3CONHthe reaction pathways shown in Scheme 1 can be2(a) CH3CN TiO
2,
viewed to be supplementary to the mechanism provided by Zhuang et al.18 forCH photooxidation on Because
3CN TiO2. and do not absorb the UV light used in CH
3CN CH3CONH2
this study, their photoreaction onTiO must be initiated by 2
bandgap excitation to generate electronÈhole pairs. TiO
2
Holes, OH~ radicals, and oxygen anionic species are three major species proposed to induce the photooxidation process, however, the exact initiation mechanisms are still under dis-cussion.
In conclusion we demonstrate thatCH can react with 3CN
surface hydroxy groups onTiO forming and 2 CH3CONH2(a) species, as supported by the same IR absorp-CH
3CONH(a)
tions found afterCH adsorption on the surface. In 3CONH2
the photooxidation of CH similar to the previous 3CN,
Ðnding,18 we also observe NCO(a) formation, but together with HCOO(a), CH etc. In addition to the
mecha-3COO(a)
nism proposed for NCO(a) formation directly from CH 3CN
photodegradation by Zhuang et al.18 we show that these reac-tion products can result from photooxidation of CH
3CONH2.
Acknowledgements
We acknowledge Ðnancial support from the National Science Council of the Republic of China (NSC 89-2113-M-006-008).
References
1 B. A. Sexton and N. R. Avery, Surf. Sci., 1992, 277, 123. 2 K. Kishi and S. Ikeda, Surf. Sci., 1981, 107, 405.
3 C. M. Friend, E. L. Muetterties and J. L. Gland, J. Phys. Chem., 1988, 85, 3256.
4 A. J. Capote, A. V. Hamza, N. D. S. Canning and R. J. Madix, Surf. Sci., 1986, 175, 445.
5 C. L. Angell and M. V. Howell, J. Phys. Chem., 1969, 73, 2551. 6 H. Knozinger and H. Krietenbrink, J. Chem. Soc., Faraday
T rans. 1, 1975, 71, 2421.
7 R. E. Sempels and P. G. Rouxhet, J. Colloid Interface Sci., 1976, 55, 263.
8 P. O. Scokart, F. D. Declerck and R. E. Sempels, J. Chem. Soc., Faraday T rans. 1, 1977, 72, 359.
9 A. G. Pelmenschikov, R. A. van Santen, J. Janchen and E. Meijer, J. Phys. Chem, 1995, 97, 11071.
10 A. Aboulayt, C. Binet and J. C. Lavalley, J. Chem. Soc., Faraday T rans., 1995, 91, 2913.
11 K. Hagiwara, T. Yamazaki and S. J. Ozawa, J. Colloid Interface Sci., 1995, 170, 421.
12 J. Szanyi and M. T. Pa†ett, J. Chem. Soc., Faraday T rans., 1996, 92, 5165.
13 V. Lorenzelli, G. Busca and N. Sheppard, J. Catal., 1980, 66, 28. 14 J. C. Lavalley and C. Gain, C. R. Acad. Sci. Paris Ser. C, 1979,
288, 177.
15 H. Krietenbrink and H. Knozinger, Z. Phys. Chem. (W iesbaden), 1976, 102, 43.
16 C. Binet, A. Jadi and J. C. Lavalley, J. Chem. Phys., 1992, 89, 31. 17 N. N. Lichtin and M. Avudaithai, Environ. Sci. T echnol., 1996, 30,
2014.
18 J. Zhuang, C. N. Rusu and J. T. Yates, Jr., J. Phys. Chem. B, 1999, 103, 6957.
19 P. Basu, T. H. Ballinger and J. T. Yates, Jr., Rev. Sci. Instrum., 1988, 59, 1321.
20 J. C. S. Wong, A. Linsebigler, G. Lu, J. Fan and J. T. Yates, Jr., J. Phys. Chem., 1995, 99, 335.
21 Y. Suda, T. Morimoto and M. Nagao, L angmuir, 1987, 3, 99. 22 J. G. Calvert and J. N. Pitts, Jr., Photochemistry, Wiley, New
York, 1966.
23 E. L. Pace and L. J. Noe, J. Chem. Phys., 1968, 49, 5317. 24 J. C. Evans and G. Y. S. Lo, Spectrochim. Acta, 1965, 21, 1033. 25 I. Suzuki, Bull. Chem. Soc. Jpn., 1962, 35, 1279.
26 W.-C. Wu, L.-F. Liao, C.-C. Chuang and J.-L. Lin, J. Catal., in the press.
27 E. Escalona Platero, M.Pen8arroyaMentruit and C. Morterra, L angmuir, 1999, 15, 5079.
28 K. Nakamoto, Infrared and Raman Spectra of Inorganic and Coordination Compounds, Wiley, New York, 4th edn., pp. 232È 233, 1986.
29 C.-C. Chuang, W.-C. Wu, M.-C. Huang, I.-C. Huang and J.-L. Lin, J. Catal., 1999, 185, 423.
30 G. Busca, J. Lamotte, J.-C. Lavalley and V. Lorenzelli, J. Am. Chem. Soc., 1987, 109, 5197.