5. Simulation Results and Discussion
5.1 Stationary traffic model
In stationary traffic model, service requests arrive according to the Poisson
process with a stationary arrival rate. Each arrival is a batch of data whose size
amounts to the volume of data carried in a number of slots at the peak feasible data
rate 307.2 Kbps of ring 3. The number of slots is a random number assumed to be
geometrically distributed with mean 80, 160, or 320 slots, chosen according to
simulation scenarios. The effect of lognormal fading is not considered in the section.
5.1.1 User-based admission control
Simulations are first run for user-based admission control with request queue, in
order to find out appropriate arrival rates in stationary traffic model for further study.
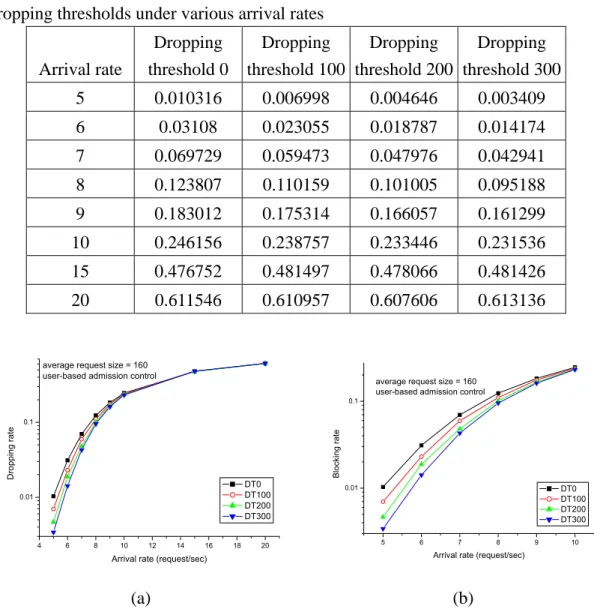
The arrival rates are essentially chosen to ensure tolerable blocking rates. Figures 5.1
and 5.2 show dropping rate, average delay and stretch for four dropping thresholds
under various arrival rates. Average request size is 160 time slots. A request’s stretch
is the request’s delay divided by the request’s air time. It can be considered as a
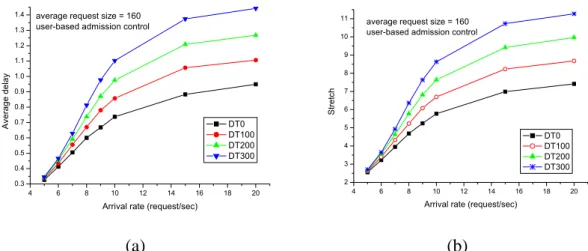
normalized delay [6]. Figure 5.1 shows that the system with a higher dropping
threshold yields a lower dropping rate but suffers from higher average service delay
and stretch. We choose arrival rates 8, 10 and 12 requests per second in the following
study, because the dropping rates are not too low and tolerable. Shown in Figure 5.2,
the distribution of average delay is similar to that of average stretch. This effect should
arise from using the round-robin service discipline for almost a fixed number of users
under user-based admission control.
Table 5.1 Dropping rates for user-based admission control with four different dropping thresholds under various arrival rates
Arrival rate
Dropping threshold 0
Dropping threshold 100
Dropping threshold 200
Dropping threshold 300 5 0.010316 0.006998 0.004646 0.003409 6 0.03108 0.023055 0.018787 0.014174 7 0.069729 0.059473 0.047976 0.042941 8 0.123807 0.110159 0.101005 0.095188 9 0.183012 0.175314 0.166057 0.161299 10 0.246156 0.238757 0.233446 0.231536 15 0.476752 0.481497 0.478066 0.481426 20 0.611546 0.610957 0.607606 0.613136
(a) (b)
Figure 5.1 Dropping rates under user-based admission control for (a) arrival rate from 5 to 20 and (b)arrival rate from 5 to 10 requests/sec
Table 5.2 (a) Average delay and (b) average stretch under user-based admission control
(a) Arrival rate
Dropping threshold 0
Dropping threshold 100
Dropping threshold 200
Dropping threshold 300 5 0.32684 0.336417 0.340228 0.345278 6 0.412087 0.434204 0.455796 0.466492 7 0.505327 0.555448 0.590545 0.6291 8 0.600272 0.669877 0.737569 0.812519 9 0.66788 0.779523 0.870572 0.977231 10 0.737352 0.857168 0.974955 1.10213 15 0.882593 1.05613 1.20857 1.37398 20 0.948904 1.10597 1.26736 1.44262
(b) Arrival rate
Dropping threshold 0
Dropping threshold 100
Dropping threshold 200
Dropping threshold 300 5 2.55451 2.62819 2.66431 2.70111 6 3.22613 3.39399 3.56206 3.64996 7 3.9498 4.33638 4.63445 4.93106 8 4.68374 5.23237 5.77338 6.36452 9 5.24526 6.08525 6.81427 7.63283 10 5.77185 6.69963 7.63718 8.62405 15 6.98578 8.23108 9.41814 10.7263 20 7.41215 8.67632 9.96537 11.269
(a) (b)
Figure 5.2 (a) Average delay and (b) average stretch under user-based admission control
5.1.2 Static admission control
5.1.2.1 The characteristics of different loadings
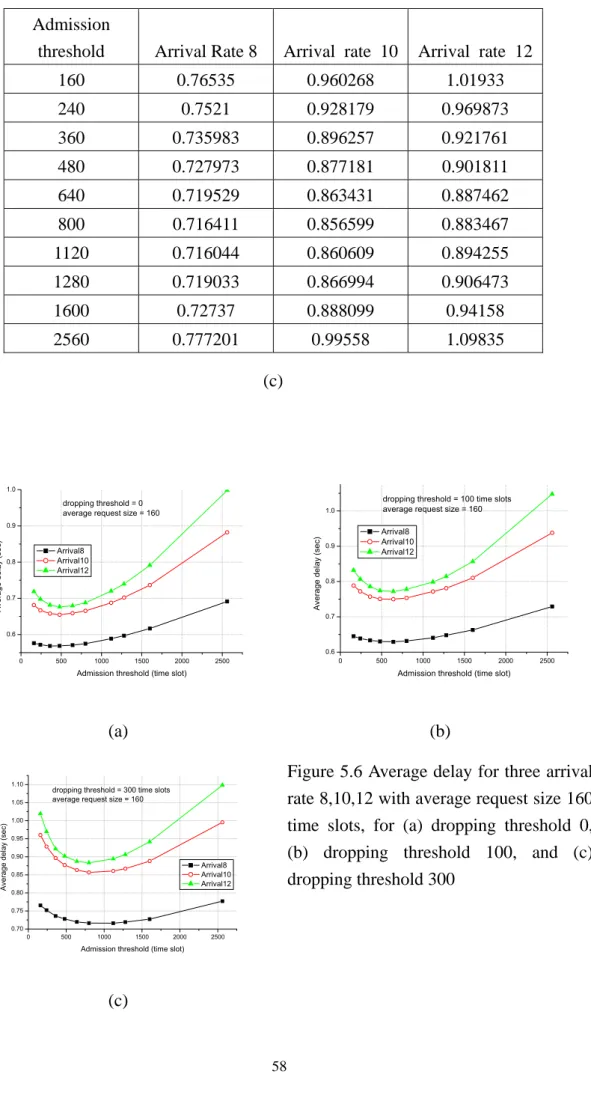
To study the behavior of time-based admission control, we set average request
size to 160 time slots and mean arrival rates at 8, 10 and 12 requests per second under
various admission thresholds. Figure 5.3 shows that the dropping rate decreases with
admission thresholds, while a higher arrival rate gives rise to a higher dropping rate. It
also shows that for high arrival rates, the effect of increasing dropping threshold on
dropping rates is very limited.
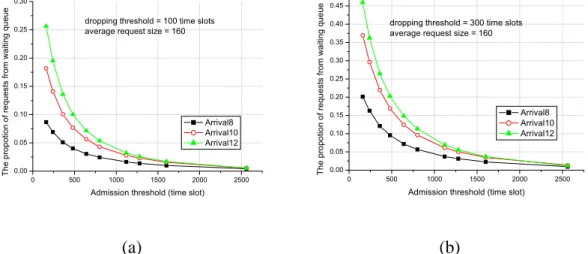
Figure 5.4 shows that using a low admission threshold causes a high ratio of
admitted requests from waiting queue. This can be explained by two facts. One is that
requests can be quickly finished. Due to the first fact, most arrivals have been diverted
into waiting queue. Due to the second fact, the system can not have many accepted
requests so that it can keep staying long in a busy state. Consequently, the mechanism
of admission control is often turned off, and hence requests in waiting queue have
many opportunities to get in the system.
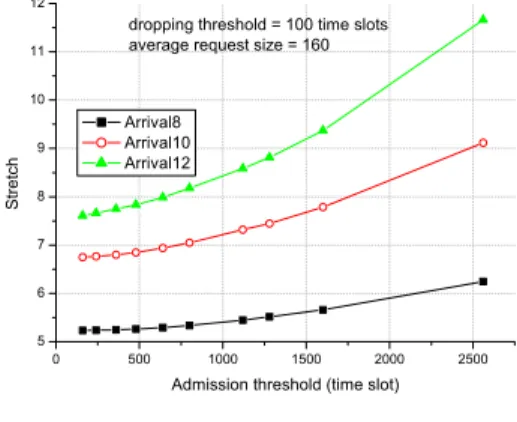
It can be seen from Figure 5.5 that for high arrival rates, the mean stretch
increases with admission thresholds and that the higher the dropping threshold, the
higher mean stretch the admission control yields.
From Figures 5.5 and 5.6, we can see that the average delay or stretch is a convex
function of admission thresholds. This feature arises from the fact that the use of low
admission thresholds gives rise to a high ratio of accepted requests from waiting queue,
which allows the system less probable to take advantage of SPT rule.
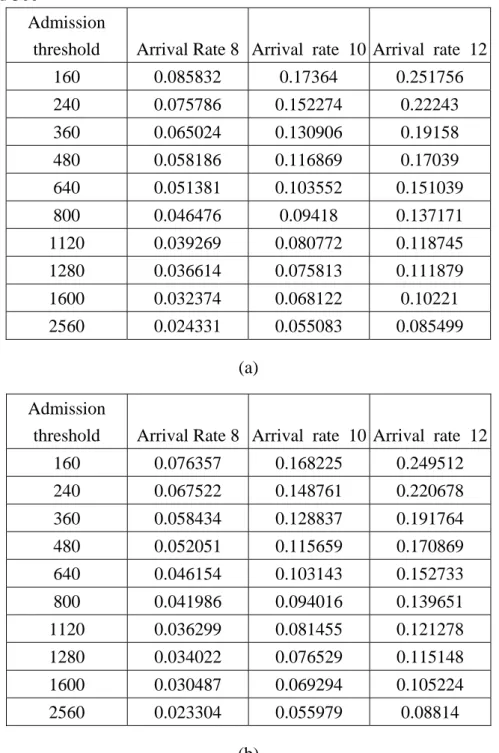
Table 5.3 Dropping rate of three arrival rates 8,10,12 with average request size 160 time slots, for (a) dropping threshold 0, (b) dropping threshold 100, and (c)dropping threshold 300
Admission
threshold Arrival Rate 8 Arrival rate 10 Arrival rate 12 160 0.085832 0.17364 0.251756 240 0.075786 0.152274 0.22243 360 0.065024 0.130906 0.19158 480 0.058186 0.116869 0.17039 640 0.051381 0.103552 0.151039 800 0.046476 0.09418 0.137171 1120 0.039269 0.080772 0.118745 1280 0.036614 0.075813 0.111879 1600 0.032374 0.068122 0.10221 2560 0.024331 0.055083 0.085499
(a) Admission
threshold Arrival Rate 8 Arrival rate 10 Arrival rate 12 160 0.076357 0.168225 0.249512 240 0.067522 0.148761 0.220678 360 0.058434 0.128837 0.191764 480 0.052051 0.115659 0.170869 640 0.046154 0.103143 0.152733 800 0.041986 0.094016 0.139651 1120 0.036299 0.081455 0.121278 1280 0.034022 0.076529 0.115148 1600 0.030487 0.069294 0.105224 2560 0.023304 0.055979 0.08814
(b)
Admission
threshold Arrival Rate 8 Arrival rate 10 Arrival rate 12 320 0.358207 0.424419 0.467966 480 0.315402 0.377463 0.416289 640 0.286875 0.34235 0.380709 800 0.265734 0.318881 0.354768 960 0.247875 0.298413 0.334624 1280 0.222466 0.270446 0.305528 1600 0.205556 0.251648 0.284856 1920 0.190859 0.236111 0.268308 2560 0.17285 0.215358 0.248787 3200 0.160149 0.20285 0.236609
(c)
(a) (b)
(c)
Figure 5.3 Dropping rate of three arrival rates 8,10,12 with average request size 160 time slots for (a) dropping threshold 0, (b) dropping threshold 100, and (c) dropping threshold 300
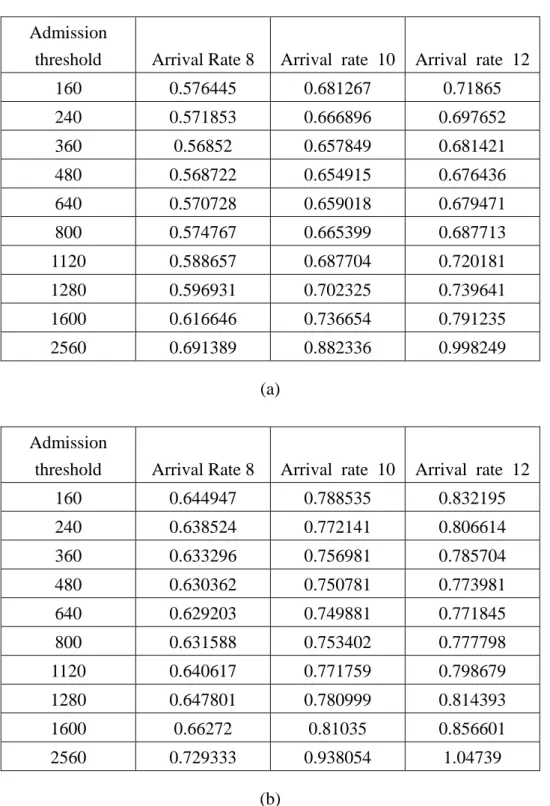
Table 5.4 The ratio of accepted requests from waiting queue for three arrival rates 8,10,12 with average request size 160 time slots, for (a) dropping threshold 100 and (b)dropping threshold 300
(a) Admission
threshold Arrival Rate 8 Arrival rate 10 Arrival rate 12
160 0.086727 0.181715 0.256329 240 0.069115 0.141001 0.195002 360 0.05102 0.100827 0.135935 480 0.040163 0.076927 0.100416 640 0.030478 0.056597 0.07147 800 0.024461 0.043169 0.053728 1120 0.01636 0.027863 0.032049 1280 0.013762 0.023079 0.025643 1600 0.009932 0.015655 0.017067 2560 0.004183 0.005381 0.005258
(b) Admission
threshold Arrival Rate 8 Arrival rate 10 Arrival rate 12
160 0.20124 0.36949 0.459074
240 0.162907 0.295889 0.362228
360 0.121 0.219634 0.264017
480 0.095704 0.168972 0.203013 640 0.071836 0.124269 0.148424
800 0.0566 0.096237 0.113079
1120 0.037356 0.061186 0.069126 1280 0.031274 0.050407 0.055402 1600 0.022472 0.034757 0.036955 2560 0.009543 0.013258 0.011678
(a) (b)
Figure 5.4 The ratio of admitted requests from waiting queue for three arrival rates 8,10,12 with average request size 160 time slots, for (a) dropping threshold 100 and (b)dropping threshold 300
Table 5.5 Stretch of service for three arrival rates 8,10,12 with average request size 160 time slots, for (a) dropping threshold 0, (b) dropping threshold 100, and (c)dropping threshold 300
(a) Admission
threshold Arrival Rate 8 Arrival rate 10 Arrival rate 12 160 4.71061 5.83752 6.55708 240 4.7273 5.86744 6.6245 360 4.75716 5.94052 6.73459 480 4.79702 6.01225 6.86501 640 4.85033 6.14392 7.05927 800 4.91057 6.26983 7.26854 1120 5.06275 6.57605 7.77449 1280 5.14633 6.75104 8.04966 1600 5.32775 7.13293 8.69158
2560 5.97572 8.61216 11.1277
(b) Admission
threshold Arrival Rate 8 Arrival rate 10 Arrival rate 12 160 5.23512 6.7485 7.60782 240 5.23597 6.76569 7.66333
360 5.2478 6.79754 7.74927
480 5.26324 6.84882 7.83443 640 5.29013 6.93899 7.98708 800 5.33496 7.04663 8.17838
1120 5.44509 7.31744 8.58411
1280 5.51754 7.4467 8.81366 1600 5.66046 7.7859 9.37178
2560 6.24609 9.11635 11.6589
(c) Admission
threshold Arrival Rate 8 Arrival rate 10 Arrival rate 12 160 6.18442 8.20203 9.28088
240 6.13179 8.11316 9.18129
360 6.05738 8.02395 9.08106 480 6.02926 7.97236 9.08571 640 5.99753 7.95561 9.12792
800 5.99616 7.97048 9.2209
1120 6.03366 8.12163 9.51622 1280 6.07302 8.21973 9.71984
1600 6.1625 8.48113 10.2014
2560 6.61119 9.62104 12.1242
(a) (b)
(c)
Figure 5.5 Stretch of service for three arrival rates 8,10,12 with average request size 160 time slots, for (a) dropping threshold 0, (b) dropping threshold 100, and (c)dropping threshold 300
Table 5.6 Average delay for three arrival rates 8,10,12 with average request size 160 time slots, for (a) dropping threshold 0, (b) dropping threshold 100, and (c)dropping threshold 300
(a) Admission
threshold Arrival Rate 8 Arrival rate 10 Arrival rate 12 160 0.576445 0.681267 0.71865 240 0.571853 0.666896 0.697652 360 0.56852 0.657849 0.681421 480 0.568722 0.654915 0.676436 640 0.570728 0.659018 0.679471 800 0.574767 0.665399 0.687713 1120 0.588657 0.687704 0.720181 1280 0.596931 0.702325 0.739641 1600 0.616646 0.736654 0.791235 2560 0.691389 0.882336 0.998249
(b) Admission
threshold Arrival Rate 8 Arrival rate 10 Arrival rate 12 160 0.644947 0.788535 0.832195 240 0.638524 0.772141 0.806614 360 0.633296 0.756981 0.785704 480 0.630362 0.750781 0.773981 640 0.629203 0.749881 0.771845 800 0.631588 0.753402 0.777798 1120 0.640617 0.771759 0.798679 1280 0.647801 0.780999 0.814393 1600 0.66272 0.81035 0.856601 2560 0.729333 0.938054 1.04739
(c) Admission
threshold Arrival Rate 8 Arrival rate 10 Arrival rate 12 160 0.76535 0.960268 1.01933
240 0.7521 0.928179 0.969873
360 0.735983 0.896257 0.921761 480 0.727973 0.877181 0.901811 640 0.719529 0.863431 0.887462 800 0.716411 0.856599 0.883467 1120 0.716044 0.860609 0.894255 1280 0.719033 0.866994 0.906473 1600 0.72737 0.888099 0.94158 2560 0.777201 0.99558 1.09835
(a) (b)
(c)
Figure 5.6 Average delay for three arrival rate 8,10,12 with average request size 160 time slots, for (a) dropping threshold 0, (b) dropping threshold 100, and (c) dropping threshold 300
To study the effect of different loading, we set average request size 320 time slots
and the same arrival rates as those used in last simulation (using rates 8, 10 and 12
requests per second). We can see that the dropping rates in Figure 5.7 are much higher
than those in Figure 5.3, simply because of higher offered load.
Shown in Figure 5.8 is that the stretch for low arrival rates is lower than that for
high arrival rates. Contrary to the fact shown in Figure 5.6, Figure 5.9 shows that for
low admission thresholds, the average delay for lower arrival rates is higher than that
for high arrival rates. This phenomenon results from the fact that the mechanism of
admission control has less opportunities to be very selective for request sizes when
arrival rates are low. In other words, higher arrival rates allow more chances for the
admission process to pick requests of short service time.
Table 5.7 Blocking rate for three arrival rates 8,10,12 with average request size 320 time slots, for (a) dropping threshold 0, (b) dropping threshold 100, and (c)dropping threshold 300
(a) Admission
threshold Arrival Rate 8 Arrival rate 10 Arrival rate 12 320 0.360229 0.427998 0.47568 480 0.319571 0.379409 0.421472 640 0.289009 0.343858 0.383945 800 0.266367 0.316852 0.354957 960 0.24872 0.296716 0.332858 1280 0.220363 0.265542 0.301687 1600 0.202113 0.245825 0.280031 1920 0.1882 0.229629 0.264347 2560 0.169113 0.209579 0.245828 3200 0.156802 0.197655 0.235623
(b) Admission
threshold Arrival Rate 8 Arrival rate 10 Arrival rate 12 320 0.359643 0.427978 0.476628 480 0.318912 0.380477 0.423479 640 0.289821 0.345239 0.386194 800 0.266526 0.319976 0.359399 960 0.248893 0.298692 0.337606 1280 0.222436 0.269041 0.306812 1600 0.203333 0.247632 0.283635 1920 0.189145 0.233225 0.268947 2560 0.170451 0.213156 0.247847 3200 0.158095 0.20039 0.23657
(c) Admission
threshold Arrival Rate 8 Arrival rate 10 Arrival rate 12 320 0.358207 0.424419 0.467966 480 0.315402 0.377463 0.416289 640 0.286875 0.34235 0.380709 800 0.265734 0.318881 0.354768 960 0.247875 0.298413 0.334624 1280 0.222466 0.270446 0.305528 1600 0.205556 0.251648 0.284856 1920 0.190859 0.236111 0.268308 2560 0.17285 0.215358 0.248787 3200 0.160149 0.20285 0.236609
(a) (b)
Figure 5.7 Blocking rate for three arrival rate 8,10,12 with average request size 320 time slots, for (a) dropping threshold 0, (b) dropping threshold 100, and (c)dropping threshold 300
Table 5.8 Stretch for three arrival rates 8,10,12 with average request size 320 time slots, for (a) dropping threshold 0, (b) dropping threshold 100, and (c) dropping threshold 300
(a) Admission
threshold Arrival Rate 8 Arrival rate 10 Arrival rate 12 320 7.29607 7.69637 7.95884 480 7.42761 7.89734 8.23921 640 7.56514 8.13239 8.53317
800 7.7332 8.36061 8.84166
960 7.90708 8.63987 9.17104 1280 8.25957 9.14459 9.91638 1600 8.66662 9.73852 10.7348
1920 9.14335 10.3806 11.6708
2560 10.1593 11.8978 13.756
3200 11.3694 13.6969 16.2205
(b) Admission
threshold Arrival Rate 8 Arrival rate 10 Arrival rate 12 320 7.90032 8.31934 8.58451 480 8.03467 8.53019 8.87012 640 8.19671 8.74666 9.17135 800 8.34964 8.96935 9.49361 960 8.51427 9.19859 9.79646 1280 8.84989 9.7103 10.5505
1600 9.21801 10.3116 11.274
1920 9.62939 10.9262 12.1818 2560 10.5769 12.3987 14.1442
3200 11.7251 13.9889 16.4468
(c) Admission
threshold Arrival Rate 8 Arrival rate 10 Arrival rate 12 320 8.87099 9.25401 9.49054 480 8.94956 9.38542 9.68317 640 9.03385 9.55373 9.91057 800 9.15697 9.74134 10.1778 960 9.26073 9.94389 10.4708
1280 9.5595 10.4136 11.1277
1600 9.91423 10.9673 11.8791
1920 10.2569 11.5472 12.6785
2560 11.1416 12.9349 14.555
3200 12.1631 14.5316 16.7565
(a) (b)
Figure 5.8 Stretch for three arrival rates 8,10,12 with average request size 320 time slots, for (a) dropping threshold 0, (b) dropping threshold 100, and (c) dropping threshold 300
Table 5.9Average delay for three arrival rate 8,10,12 with average request size 320 time slots, for (a) dropping threshold 0, (b) dropping threshold 100, and (c)dropping threshold 300
(a) Admission
threshold Arrival Rate 8 Arrival rate 10 Arrival rate 12
320 1.41147 1.34278 1.25283
480 1.35007 1.26921 1.17475 640 1.31581 1.23598 1.14243 800 1.30374 1.21988 1.12995 960 1.30105 1.22436 1.13328 1280 1.30934 1.24055 1.16998 1600 1.34207 1.28604 1.22876 1920 1.39166 1.34226 1.30717 2560 1.51019 1.49889 1.50283 3200 1.66669 1.70016 1.74879
(b) Admission
threshold Arrival Rate 8 Arrival rate 10 Arrival rate 12 320 1.53385 1.45599 1.36093 480 1.46614 1.37772 1.27617 640 1.43451 1.3364 1.23885 800 1.41429 1.31952 1.22848
960 1.40779 1.31185 1.22588
1280 1.41331 1.32822 1.26147
1600 1.43711 1.37032 1.30412
1920 1.47409 1.42457 1.38081 2560 1.58188 1.57536 1.55773
3200 1.7292 1.74913 1.78529
(c) Admission
threshold Arrival Rate 8 Arrival rate 10 Arrival rate 12 320 1.71391 1.59734 1.48209 480 1.62059 1.49737 1.37767 640 1.57035 1.44279 1.32876 800 1.54537 1.42016 1.30957 960 1.52581 1.4074 1.30632 1280 1.52347 1.41705 1.32993
1600 1.5456 1.45492 1.37825
1920 1.56973 1.50052 1.43798 2560 1.66773 1.63633 1.60794
3200 1.7933 1.80971 1.82168
(a) (b)
Figure 5.9 Average delay for three arrival rate 8,10,12 with average request size 320 time slots, for (a) dropping threshold 0, (b) dropping threshold 100, and (c) dropping threshold 300
5.1.2.2 The characteristics of different request sizes
To study the characteristics of different request sizes under the same offered load
(i.e., request arrival rate * request size), we have two more simulations, for mean
request sizes 80 slots and 320 slots, respectively. Results are compared with that from
the first simulation in 5.1.2.1, where the average request size is 160 timeslots at the
peak rate of ring 3 and the three arrival rates are 8, 10 and 12 requests per second.
From Figures 5.11, 5.5, and 5.13 (resp. 5.10, 5.6, and 5.12) for mean data sizes
80, 160, and 320 slots, respectively, we see that the average stretch (resp. average
delay) increases with average request sizes under the same offered load. Besides,
comparing Figs. 5.10, 5.6, and 5.12, we also see that the admission threshold for the
minimum of average delay decreases with reducing data size under the same offered
load.
Table 5.10 Average delay for three arrival rates 16, 20, and 24 with average request size 80 time slots, for (a) dropping threshold 0, (b) dropping threshold 100, and (c)dropping threshold 300
Admission
threshold Arrival rate 16 Arrival rate 20 Arrival rate24
80 0.292343 0.341424 0.35878 160 0.288046 0.331252 0.341369 240 0.287415 0.32961 0.338222 360 0.289499 0.332955 0.340192 480 0.293944 0.33933 0.350961 640 0.302132 0.352689 0.371742 960 0.325521 0.394222 0.42918 1280 0.352167 0.44616 0.504653 1920 0.417687 0.584012 0.691 2560 0.492906 0.751364 0.900728
(a) Admission
threshold Arrival rate 16 Arrival rate 20 Arrival rate 24
80 0.36294 0.443585 0.473438
160 0.355116 0.419306 0.439964 240 0.350155 0.410593 0.427773 360 0.347995 0.407059 0.424698 480 0.347837 0.406926 0.42659 640 0.351779 0.416159 0.440343 960 0.369521 0.448791 0.485451 1280 0.393268 0.494886 0.551533 1920 0.451162 0.615484 0.71587 2560 0.520094 0.767979 0.924353
(b)
Admission
threshold Arrival rate 16 Arrival rate 20 Arrival rate 24
80 0.479841 0.616511 0.650027 160 0.453325 0.555568 0.562527 240 0.436177 0.527257 0.527176 360 0.422313 0.503939 0.50406 480 0.415432 0.49471 0.496083 640 0.410371 0.495047 0.500649 960 0.416406 0.507662 0.533964 1280 0.42908 0.541271 0.585474 1920 0.479418 0.644845 0.735533 2560 0.539747 0.778627 0.92875
(c)
(a) (b)
(c)
Figure 5.10 Average delay for three arrival rates 16, 20, and 24 with average request size 80 time slots for (a) dropping threshold 0, (b) dropping threshold 100, and (c)dropping threshold 300
Table 5.11 Stretch for three arrival rates 16, 20, and 24 with average request size 80 time slots for (a) dropping threshold 0, (b) dropping threshold 100, and (c)dropping threshold 300
Admission
threshold Arrival rate 16 Arrival rate 20 Arrival rate 24
80 4.76128 5.90396 6.60313
160 4.79303 5.98423 6.74957 240 4.84343 6.10687 6.93917 360 4.92962 6.30544 7.21252 480 5.03604 6.51292 7.58477 640 5.20003 6.85342 8.17041
960 5.62076 7.74955 9.5888
1280 6.07603 8.80786 11.3576 1920 7.16591 11.5179 15.6283 2560 8.38465 14.7523 20.3958
(a) Admission
threshold Arrival rate 16 Arrival rate 20 Arrival rate 24
80 5.85628 7.58533 8.57432
160 5.83284 7.50651 8.55933 240 5.81269 7.50518 8.62628 360 5.83313 7.59762 8.82765
480 5.8683 7.69144 9.05449
640 5.96732 7.95818 9.512
960 6.30502 8.70035 10.6923 1280 6.71817 9.64887 12.2703 1920 7.68649 12.043 16.0756 2560 8.81905 15.0266 20.8119
(b)
Admission
threshold Arrival rate 16 Arrival rate 20 Arrival rate 24
80 7.71256 10.5741 11.9341
160 7.38819 9.93461 11.0683
240 7.17942 9.63571 10.7534
360 7.00983 9.38881 10.6079
480 6.93636 9.32347 10.6186
640 6.89299 9.41666 10.8645
960 7.03329 9.7762 11.7826
1280 7.27243 10.4992 13.0375
1920 8.12348 12.5825 16.5423
2560 9.11347 15.2248 20.9688
(c)
(a) (b)
(c)
Figure 5.11 Stretch for three arrival rates 16, 20, and 24 with average request size 80 time slots for (a) dropping threshold 0, (b) dropping threshold 100, and (c) dropping threshold 300
Table 5.12 Average delay for three arrival rates 4, 5, and 6 with average request size 320 time slots for (a) dropping threshold 0, (b) dropping threshold 100, and (c) dropping threshold 300
Admission
threshold Arrival rate 4 Arrival rate 5 Arrival rate 6
320 1.13487 1.34534 1.42353
480 1.12913 1.31871 1.37848
640 1.12517 1.30515 1.36166
800 1.12314 1.2959 1.35092
960 1.1219 1.29613 1.34646
1280 1.1249 1.30157 1.35008
1600 1.13477 1.31464 1.36498
1920 1.14535 1.33144 1.39378
2560 1.17746 1.38921 1.47158
3200 1.21398 1.45875 1.57218
(a) Admission
threshold Arrival rate 4 Arrival rate 5 Arrival rate 6
320 1.21168 1.48095 1.55994 480 1.20445 1.45019 1.52322 640 1.19707 1.43409 1.49572
800 1.19511 1.42302 1.4811
960 1.19393 1.41554 1.47689 1280 1.19719 1.41875 1.47134 1600 1.20399 1.42678 1.49093 1920 1.21226 1.44198 1.51236 2560 1.23596 1.48605 1.57305 3200 1.27451 1.55226 1.66495
(b)
Admission
threshold Arrival rate 4 Arrival rate 5 Arrival rate 6
320 1.35272 1.6555 1.74693
480 1.3381 1.6128 1.68815
640 1.3302 1.58603 1.64994
800 1.32262 1.5677 1.63183 960 1.31827 1.5627 1.61081 1280 1.3123 1.55101 1.6028
1600 1.31456 1.55144 1.6086
1920 1.32027 1.56527 1.62676 2560 1.34196 1.59559 1.68171 3200 1.36946 1.64379 1.75762
(c)
(a) (b)
(c)
Figure 5.12 Average delay for three arrival rates 4, 5, and 6 with average request size 320 time slots for (a) dropping threshold 0, (b) dropping threshold 100, and (c) dropping threshold 300
Table 5.13 Stretch of three arrival rate 4, 5, and 6 with average request size 320 time slots for (a) dropping threshold 0, (b) dropping threshold 100, and (c)dropping threshold 300
Admission
threshold Arrival Rate 4 Arrival Rate 5 Arrival Rate 6 320 4.64044 5.78877 6.52496
480 4.66679 5.81442 6.5748
640 4.68727 5.86264 6.66931 800 4.70929 5.89814 6.75539 960 4.72903 5.96033 6.83578 1280 4.77898 6.08461 7.02281 1600 4.84566 6.20994 7.21953 1920 4.90891 6.34202 7.46217 2560 5.07038 6.6905 8.00736 3200 5.24024 7.07663 8.65268
(a) Admission
threshold Arrival Rate 4 Arrival Rate 5 Arrival Rate 6
320 4.93298 6.32831 7.1059
480 4.95355 6.35802 7.1908
640 4.96079 6.40467 7.26827 800 4.98048 6.44171 7.33453 960 4.99877 6.48189 7.42992 1280 5.04712 6.59433 7.58915 1600 5.10032 6.70707 7.80678 1920 5.15389 6.8385 8.02355 2560 5.28282 7.12783 8.49188 3200 5.46099 7.4996 9.07491
(b)
Admission
threshold Arrival Rate 4 Arrival Rate 5 Arrival Rate 6 320 5.46038 7.09224 7.94197 480 5.45367 7.07261 7.97091 640 5.46012 7.07162 7.99279
800 5.4581 7.08088 8.05116
960 5.46389 7.11739 8.07784
1280 5.4774 7.17062 8.21252
1600 5.51352 7.2481 8.36498 1920 5.55743 7.36879 8.56165
2560 5.6762 7.59996 9.00022
3200 5.81088 7.89021 9.508
(c)
(a) (b)
(c)
Figure 5.13 Stretch of three arrival rates 4, 5, and 6 with average request size 320 time slots for (a) dropping threshold 0, (b) dropping threshold 100, and (c)dropping threshold 300
5.2 Nonstationary traffic model
In nonstationary traffic model, service requests arrive according to the Poisson
process with arrival rates alternating 0.9λ for 0.9PT in low rate state and 1.9λ for
0.1PT in high rate state, whereλ = 10 requests/sec set in the study , and PT is the
length of a time period set to PT = 100000 time slots. Note that we use the high data
rate state to represent a state of bursty traffic arrivals. Each arrival is a batch of data
whose size is geometrically distributed; specifically, the mean data size amounts to the
volume of data carried at the peak data rate of ring 3 in 160 time slots. In this section,
the effect of lognormal fading is also excluded in study.
From Figure 5.14, we can see that using time-based admission control results in
more served requests than using user-based or rate-based admission control under a
given time interval; especially during the burst period, the service curve for time-based
admission control has a steeper slope than those for user-based or rate-based admission
control. This reveals that as far as the departure rate for bursty traffic arrivals is
concerned, the time-based strategy is preferable. From Table 5.14, we also see that
whatever the state of arrival rate is, the dropping rate and the average delay of
requests of small data size than the user-based and rate-based admission control, as can
be seen from Fig. 5.15 in which the distribution of accepted request sizes is illustrated.
0 200 400 600 800 1000 1200 1400 1600 1800
20000 30000 40000 50000 60000 70000 80000 90000 100000 110000 120000 130000
number of requests
Time (time slots) arrival
user-based rate-based time-based
Figure 5.14 Number of serviced requests for user-based, rate-based, and time-based admission control as a function of time slots.
Table 5.14 Characteristics of three admission controls for (a) arrival rates 0.9λ for 0.9PT and (b) arrival rates 1.9λ for 0.1PT, whereλ = 10 requests/sec , PT
= 100000 time slots. Note that a request is counted in (a) (resp. (b)) if its service completes in low arrival rate state (resp. high arrival rate state).
Admission
control Dropping rate Average delay Stretch
The proportion of requests from waiting
queue user-based 0.152895 0.80094 6.10908 0.225069
rate-based 0.14615 0.831932 6.38719 0.0561086 time-based 0.0623946 0.726146 6.38042 0.0422648
(a)
Admission
control Dropping rate Average delay Stretch
The proportion of requests from waiting
queue user-based 0.594203 1.13403 8.23001 0.77381
rate-based 0.570048 1.11008 8.45916 0.230337 time-based 0.2657 0.702094 9.1447 0.0855263
(b)
Figure 5.15 The distribution of service air time of admitted requests, as a function of five time ranges, for user-based, rate-based and time-based admission control, respectively
Table 5.15 The distribution of service air time of admitted requests, as a function of five time ranges, for user-based, rate-based and time-based admission control, respectively
Time range
(time slots) User-based Rate-based Time-based
<=160 0.75038 0.75579 0.80238 160~320 0.11603 0.11426 0.08989 320~640 0.09771 0.09485 0.07733
5.3 Adaptive time-based admission control
To study the characteristics of adaptive time-based admission control, we
consider the following traffic scenario in simulations. For the first 200 million
timeslots, the mean arrival rate is at 10 requests per second; for another 200 million
timeslots, the mean arrival rate is at 20 requests per second; and then the mean arrival
rate is at 10 requests per second until the simulation terminates. For comparison under
such a scenario, simulations are run for user-based, rate-based, static time-based, and
adaptive time-based admission control. In particular, for the adaptive scheme, we set
the initial time threshold Ta[0] to 550 time slots, β to 5, and δ to 5 time slots.
Figure 5.16 shows that the adaptive time-based admission control raises
admission thresholds when arrival rate changes from 10 to 20 requests per second. In
Table 5.15, it is shown that the use of adaptive time-based admission control yields
lower average delay and stretch but a higher dropping rate, as compared with the static
scheme.
350 400 450 500 550 600 650
0 500 1000 1500 2000 2500 3000 3500 4000
Admission threshold
Change point(100k time slots)
window = 10k
Figure 5. 166 The admission threshold of adaptive admission control for arrival rates at 10 events/sec for the first 200 million slots, at 20 events/sec for another 200 million slots, and then at 10 events/sec afterwards. The window of moving average has the size of 10k slots.
Table 5. 16 The numerical data for four admission control strategies
Admission control Dropping rate Average delay Stretch user-based 0.486727 1.69098 13.3228 rate-based 0.486044 1.01678 7.96007 static time-based 0.215512 0.712281 8.56722 adaptive time-based 0.234746 0.709843 8.32428