國⽴立臺灣⼤大學⼯工學院醫學⼯工程學系 博⼠士論⽂文
Department of Biomedical Engineering College of Engineering
National Taiwan University Doctoral Dissertation
灌流指標在⿇麻醉臨床的應⽤用
Clinical Application of Perfusion Index in Anesthetic Practice
朱俊霖 Chun-Lin Chu
指導教授:⿈黃義侑 博⼠士 Advisor: Yi-You Huang, Ph.D.
中華民國 107 年 9 ⽉月 September, 2018
誌謝
⾮非常開⼼心能夠順利完成這篇論⽂文,在此最感謝我的指導教授⿈黃義侑⽼老師對我
的論⽂文及學業上的指導,且在我徬徨喪志的時候給我的溫暖的⿎鼓勵與空間。︒。另外,
衷⼼心感謝台⼤大醫院⿇麻醉科葉惠敏醫師,提供我很棒的研究素材及總是督促我的進
度,給我了很多正向的思考及繼續前進的動⼒力。︒。
在攻讀博⼠士學位期間,受到許多⼈人的幫助與提點,包括⼀一起上課準備考試
及報告的同學們,⼀一起討論互相砥礪進步的實驗室學⾧長姐學弟妹,以及在研究上
幫忙提供建議及想法的臨床醫師們,還有醫院裡的主任與同事幫忙排班跟⽀支持,
才能排出⼯工作之餘時間上課,準備考試及做研究,得以順利的修完課,通過資格
考及完成研究論⽂文。︒。
最後感謝家⼈人的陪伴及⿎鼓勵是我完成學業精神上最⼤大的⽀支柱還有當初⿎鼓勵
報考博⼠士班的好友讓我勇敢的嘗試挑戰⾃自⼰己,謝謝⼤大家。︒。
中⽂文摘要
灌流指標(Perfusion index, PI)是使⽤用紅外線經過⼿手指並接收後量測局部組織吸 收的狀況,進⽽而反應局部⾎血液灌流狀態。︒。由於其⽅方便性與⾮非侵⼊入性,因此適⽤用於 多種狀況以得到額外的⽣生理資訊。︒。
灌流指標⽬目前已有相當多的研究證實其臨床的應⽤用價值,包括應⽤用於新⽣生兒 的預後判斷及先天性⼼心臟病的預測,及使⽤用於急診或加護病房內判斷病⼈人敗⾎血症 或⼼心肺復甦術的預後。︒。灌流指標在圍術期的變化更是⿇麻醉科醫師在⿇麻醉前中後的 參考指標。︒。
本篇論⽂文第⼀一部分探討在⿇麻醉中當腎⽔水腫的病⼈人於經輸尿管碎⽯石術重建尿路 暢通後灌流指標的變化,藉以證明灌流指標可以顯⽰示⼿手術前後周邊微循環的改變。︒。
第⼆二部份則是灌流指標在恢復室的應⽤用,以疼痛刺激交感神經使周邊⾎血管收縮導 致灌流指標下降的特性探討病⼈人在恢復室的主觀疼痛分數與客觀灌流指標的相關 性,並將病患出恢復室時灌流指標與基礎灌流指標做⽐比較,藉以當作病患出恢復 室客觀疼痛評估的條件。︒。
關鍵字 : 腎⽔水腫、︑、灌流指標、︑、輸尿管碎⽯石術、︑、疼痛分數、︑、恢復室指標
ABSTRACT
Perfusion index derived from measurement of the strength of return infrared light across the finger is a relative assessment of pulse strength. It is applied widely to acquire additional physiological information because of its non-invasiveness and convenience.
Perfusion index has been approved its value in clinical application by several studies. Perfusion index was used to predict the outcome of new born infant and congenital cardiovascular defect of neonates. It also used in patients with septic shock to predict their mortality rate and the successful probability of cardiopulmonary resuscitation in emergency room. The change of perfusion index during perioperative period is also a valuable reference for anesthesiologist. It helps physicians to early diagnose problem and make correct decision when performing anesthesia.
The first part of this thesis is exploring that increase of perfusion index when re-establishing ureteral patency of hydronephrosis by uretero-renal-scopy with stone manipulation indicates improvement of microcirculation. The second part is the application of perfusion index in postanesthesia care unit (PACU). Pain will activate sympathetic tone and constrict peripheral arteriole, leading to perfusion index decrease.
We investigate the relationship between subjective pain score reported by individuals and the objective change of perfusion index. We also use change in PI at the time of discharge from the PACU relative to baseline PI as a supplemental objective discharge criterion for pain assessment.
Key words : Hydronephrosis ; Perfusion index ; Uretero-renal-scopy (URS); visual
CONTENTS
誌謝………i
中文摘要………...ii
ABSTRACT..……….………...iii
CONTENTS………...iv
LIST OF FIGURES………...………..vi
LIST OF TABLES……….vii
Chapter 1 Introduction………1
1.1 Background of the Study………1
1.1.1 General Background………..1
1.2 Perfusion index………...4
1.2.1 Principle……….…4
1.2.2 PI study for pre-anesthetic evaluation……….…..6
1.2.3 PI study for intra-operative application……….……7
1.2.4 PI study for post-operative assessment………....…10
1.3 Reference………..64
Chapter 2 Motivation and Goal of Study………..……….15
2.1 Motivation of Study……..………...16
2.1.1 Microcirculation change of hydroneohrosis……….………..16
2.1.2 Subjectivity of acute post-operative pain………..17
2.2 Goal of Study…………..……….………18
2.2.1 Application of Perfusion index in microcirculation assessment……..18
2.2.2 Application of Perfusion index in pain assessment………..20
2.3 References……….………..70
Chapter 3 Perfusion index derived from a pulse oximeter can detect changes in peripheral microcirculation during uretero-renal-scopy stone manipulation (URS-SM)………28
3.1 Materials and Methods……….29
3.2 Results………..31
3.3 Discussion………33
3.4 Conclusion………35
3.5 References………74
Chapter 4 An observational study : The utility of Perfusion Index as a discharge criterion for pain assessment in the postanesthesia care unit…………..43
4.1 Materials and Methods……….44
4.2 Results………..46
4.3 Discussion……….47
4.4 Conclusion………50
4.5 References………....77
Chapter 5 Summary and Future Work………..57
5.1 Summary of General Introduction………58
5.2 Summary of peripheral perfusion change after URS-SM………58
5.3 Summary of perfusion index as pain assessment ………59
5.4 Future Work……….61
5.5 Publication List.………....………..…78
LISTS OF FIGURES
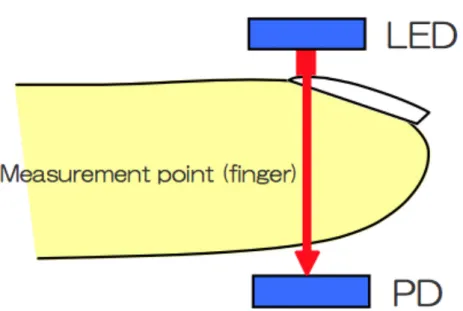
Figure 1.1 Pulse Oximeter measurement point………..12
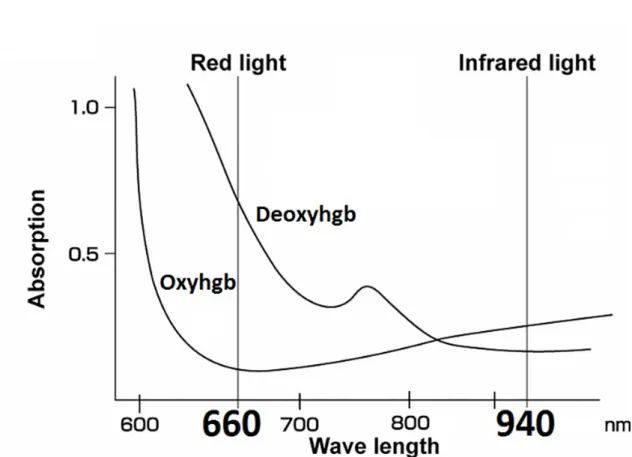
Figure 1.2 Absorption of hemoglobin and oxyhemoglobin………...13
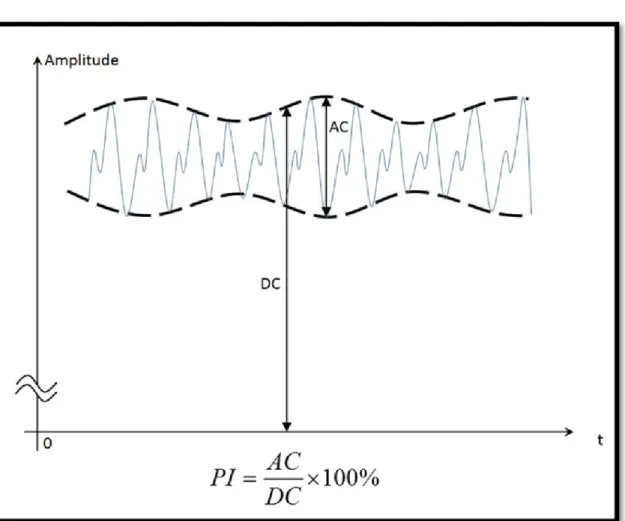
Figure 1.3 Formula of Perfusion index………...14
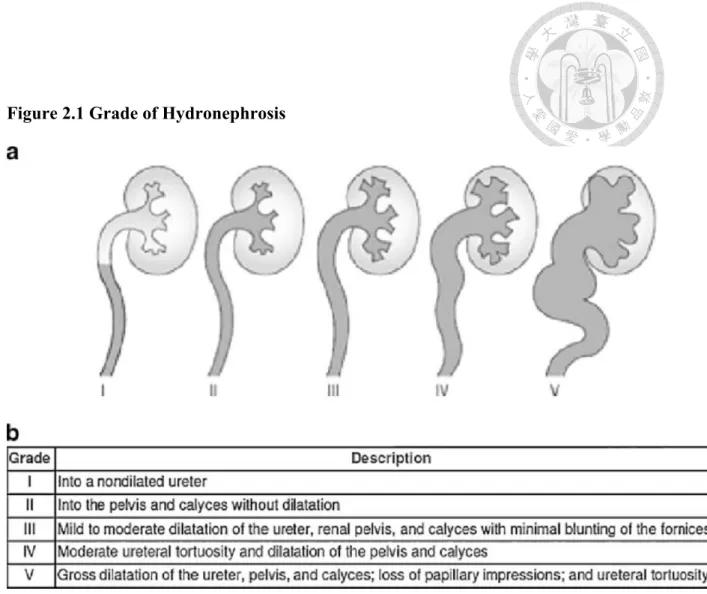
Figure 2.1 Grade of Hydronephrosis………..23
Figure 2.2 Rigid and Flexible retrograde uretero-renal-scopy………...24
Figure 2.3 Processing of Pain……….25
Figure 2.4 Pain assessment tools………26
Figure 2.5 Correlation of VAS and facial expression………27
Figure 3.1 . Interquartile range (IQR) of Perfusion Index (PI) in patients with Grade I, II, and III hydronephrosis………..41
Figure 3.2 Interquartile range (IQR) of mean arterial pressure (MAP) in patients with Grade I, II, and III hydronephrosis………42
Figure 4.1 Perfusion index changes at different time points………..56
LISTS OF TABLES
Table 3.1 Demographic data and the degree of hydronephrosis………..37 Table 3.2 The changes in PI, MAP, and eGFR in the 3
hydronephrosis groups……….39 Table 3.3. Relationships between baseline clinical parameters and the
percent changes in MAP, PI , eGFR after stone
disintegration………...40 Table 4.1 Demographic data……….52 Table 4.2 Changes in parameters before and after the administration
of analgesics………53 Table 4.3 Correlation between PI and VAS, ΔPI and ΔVAS, and
percentage changes in ΔPI and ΔVAS in age or BMI
subgroups and all measurement………..54 Table 4.4 Difference of parameters between age and BMI subgroups………55
Chapter 1 Introduction
1.1 Background of the Study 1.1.1 General Background
General anesthesia, a controlled and reversible drug-induced state, have been widely used in surgery since 1842 [1], when Craw Long administered diethyl ether to a patient and performed the first painless operation. It can cause analgesia, amnesia, and motionlessness with maintenance of physiological stability during surgical intervention.
Anesthesia has not only made dramatic improvement of patient safety and wellness but also help surgical intervention make enormous progress in recent decades. Guedel’s classification, designed by Arthur Ernest Guedel in 1937, described three stages of anesthesia, including induction, maintenance , and recovery stage [2]. During induction stage, awake patients fell into unconsciousness by hypnotic agents, were paralyzed by muscle relaxant, and were free from pain by using opioids. Endotracheal intubation was performed to secure airway and mechanical ventilation were initiated. During
maintenance stage, inhalational or continuous intravenous agents were given to
maintain the anesthetized states and were adjusted according to physiological response.
Surgery was performed during this stage. When surgery terminated and skin suture was performed, anesthetic agents were ceased and muscle relaxant was reversed. The patient was then extubated with spontaneous breathing and regaining consciousness. Great surgical stimulation was imposed during maintenance and rapid change of vital function
was throughout the three stages of general anesthesia, monitoring is an essential component of anesthesia care to ensure safety. Patient and equipment monitoring is used to titrate administration of anesthetic medication, to detect physiological
pertubations and allow intervention before the patient suffers harm, and to detect and correct equipment malfunction.
In US, the American Society of Anesthesiologist have established minimum monitoring guidelines for patients receiving general anesthesia [3]. “Standard ASA monitors” refer to the basic physiologic monitors recommended which includes a pulse oximeter, electrocardiography (ECG), noninvasive blood pressure device, and a
temperature monitor. In addition, it also includes measurement of end tidal carbon dioxide, inspired oxygen concentration, and the use of low oxygen concentration and ventilator disconnect alarms. Above were the basic requirement of anesthetic
monitoring which ensure patients’ safety.
For major surgery, including cardiac, pulmonary, neurologic, or transplant surgery, more invasive monitors were needed. An arterial line is inserted into an artery to monitor blood pressure directly in real-time and to obtain samples for arterial blood gas analysis [4, 5]. Central venous catheter is placed into central vein to administer medication or fluids and measure central venous pressure [6, 7]. Transesophageal echocardiography is a sonographic probe placed into esophagus to assess real-time cardiac morphology and motion [8, 9]. These invasive monitors provide more precise and instant physiologic information to help clinicians to deal with great vital shift during major surgery. However, in most minor surgery under general anesthesia,
so that only standard ASA monitors were applied because its nature of no-invasiveness and convenience. Enormous physiologic change may occasionally take place even in a minor scheduled surgery. In order to acquire more information from these basic instruments, modern application of these standard monitors was researched and developed.
Heart rate variability (HRV) derived from electrocardiography is the physiological phenomenon of variation in the time interval between heartbeats. It is measured by the variation in the beat-to-beat interval. Sympathetic and parasympathetic nervous system innervate sinoatrial node to elevate or decrease heart rate. After analysis of HRV with time-domain methods, high frequency (HF) activity (0.15 to 0.4 Hz) has been linked to parasympathetic activity and low frequency (LF) activity (0.04 to 0.15 Hz) linked to both sympathetic and parasympathetic nervous system [10-12]. A reduction of HRV has been reported in several disease, such as myocardial infarction, diabetic neuropathy, sepsis.. etc [13-17].
Pulse oximeter is another non-invasive monitor that contain several physiologic signals if the data is well interpreted [18]. Plethysmographic pulse wave amplitude varies between inspiratory and expiratory cycle during general anesthesia. The percentage change of plethysmographic pulse wave amplitude is related to volume responsiveness and also an effective indicator of intravascular epinephrine-containing epidural test dose [19, 20]. Pleth Variability index (PVI) derived from pulse oximeter is another physiological indicator the reflect physiologic factors such as vascular tone, circulating blood volume, and intrathoracic pressure excursions during general
occur during one or more complete respiratory cycles. PVI automatically and continuously calculated as the following formula : PVI= (PImax-PImin)/PImax X 100
1.2 Perfusion index 1.2.1 principle
Pulse oximetry measures peripheral arterial oxygen saturation (SpO2) as a surrogate marker for tissue oxygenation. It has become the standard for continuous, noninvasive assessment of oxygen, and known as “ fifth vital sign” [23]. It uses spectrophotometry to determine the proportion of hemoglobin that is saturated with oxygen. Pulse oximeter probes consist of two light emitting diodes and a photodetector.
Detectors and emitters are positioned facing each other through interposed tissue. (Fig 1.1) Deoxyhemoglbin absorbs light maximally in the red band of the spectrum (600 to 750 nm), and oxyhemoglobin absorbs maximally in the infrared band (850 to 1000nm).
The emitters emit light at 660nm and 940nm for optimal detection and detector detects the absorbance of light from exposed tissue and the values are processed and a
saturation determined. (Fig 1.2)
Perfusion Index (PI) derived from plethsmography is a relative assessment of pulse strength at the monitoring site [24]. It is a numerical value for the ratio between pulsatile and non-pulsatile blood flow measured by the strength of return infrared light across the tissue bed. It ranges from 0.01% (very weak pulse strength) to 20% (very strong pulse strength). When infrared light (940 nm) was projected across monitoring site, it was absorbed partially by skin, tissue bed, and blood flow. Pulsatile blood flow is
the monitoring site. (Fig 1.3)
Perfusion index (PI)= (AC/DC) X 100
AC : pulsatile component of the return infrared signal
DC : non-pulsatile component of the return infrared signal
As peripheral tissue blood flow was controlled by arteriole, there are several factors my interfere perfusion index [25]. Firstly, individual difference of baseline arteriole smooth muscle tone results in inter-individual baseline perfusion index variation. This makes individual baseline PI range widely. Second, environment temperature influence on vasomotor tone make perfusion index varies. PI which measured in different setting of environment may make great bias. Third, sympathetic activation caused by pain, hypovolemia, critical illness, or vasoactive agents constricted peripheral vasculature and decreased perfusion index reading. Fourth, peripheral perfusion increased when
vascular smooth muscle tone was blunted by blockade of innervated peripheral or central nerve. PI varies between monitoring sites and from patient to patient, as physiologic condition varies. Of course, it also varies in one individual when physiologic condition changes.
It can be used not only in routine anesthetic monitoring but also in several circumstances to help clinicians to make decision base on its characteristics. It was introduced since 1991 but several studies have been warranted to survey its clinical usage while perfusion index was made progress to be more stable and reliable in recent
and enhance its performance when low blood flow. Signal extraction technology utilizes five signal processing algorithms to deliver high precision sensitivity and specificity in the measurement of blood saturation levels, the PI parameter can be derived from the core measurement of SET and yields useful information regarding the peripheral perfusion status of the patient. It also use perfusion index to acquire pleth variability index (PVI) to represent the volume status of individual. Its non-invasiveness and easy to use make it widely applied in several fields.
In operation room, patients underwent great physiological change from awake to anesthetized status. Their consciousness was lost, vessel dilated, and sympathetic tone decreased. Perfusion index increase or decrease according to anesthetic status and surgical stimuli. Several studies have investigated its clinical application in different scenario of anesthetic situations and its assistance in surgical decision [28, 29]. In intensive care unit, it was used to be a predictor of vasopressor usage in severe septic patients and mortality after resuscitation [30, 31]. In pediatric department, perfusion index may enhance the detection of neonatal severe congenital heart disease and
correlate the neonatal morbimortality in preterm newborns [32-34]. A low PI has shown to be an objective and accurate measure of acute illness. The determination of PI is clear and independent compared to subjective means of assessing health status in neonates.
It was widely studied in anesthetic practice because individual’s PI can change dramatically after an intervention. It can be divided into pre-anesthetic evaluation, intra-operative application, and post-operative assessment.
Predicting hypotension after spinal anesthesia during caesarean delivery Perfusion index was used to predict the incidence of hypotension during spinal
anesthesia for Caesarean delivery [35]. Parturients with low baseline peripheral vascular tone due to pregnancy may suffer from severe hypotension after spinal anesthesia induced sympathetic blockade and blood pooling. Perfusion index was used to access the severity of impairment of peripheral vascular tone in parturients and baseline finger PI > 3.5 were associated with profound hypotension after spinal injection. In another study, aortocaval compression by the gravid uterus in the parturients was taken into account for the maternal hypotension after spinal anesthesia during Caesarean delivery.
When aortocaval compression is imposed, the toe PI will not change and parturients may suffer from hypotension after spinal injection. On the contrary, the toe PI increased significantly among parturients without aortocaval compression who did not develop hypotension [36]. Perfusion index measured in upper and lower extremities in parturients establish different physiological theories to predict the incidence of post-spinal hypotension during Cesarean delivery.
1.2.3 PI Study for intra-operative application
Early indicator of epidural anesthesia and intravascular injection
Early determination of successful epidural anesthesia and a reliable objective tool to assess was needed to help anesthetist to make precise decision and prevent urgent situation. Perfusion index has been used to indicate epidural anesthesia induced vasodilatation. Perfusion index in the toe increased by 326%, compared with 10%
decrease in MAP and a 3% increase in temperature and showed earlier and more
than either skin temperature or MAP [37]. Perfusion index also is a reliable alternative to conventional monitor for detection of an intravascular injection of epidural test dose in propofol-anesthetized adult patients. Epinephrine 15 micrograms induced generalized vasoconstriction and lead to PI decreased significantly. Maximum PI decreased by 65%
at 39 s after injecting the test dose (3mL of lidocaine 15mg/Ml with epinephrine 5 microg/mL) and showed better sensitivity, specificity, positive predictive, and negative predictive values than HR, SBP monitored for 5 min after injection [28].
Predicting successful nerve block
Conventional method for evaluation of block success is based on loss of sensory response in blocked region which is time consuming and require patients’ cooperation.
Lost innervation of peripheral nerve and relaxation of smooth muscle result in
peripheral vasodilatation and perfusion index increased significantly in the monitoring site. Perfusion index increased by 120 ± 119 % from baseline at 10 min after
infra-clavicular block and rose continuously during the 30 min [38]. All changes from baseline were significant (p<0.01). In recent study, both the perfusion index and PI ratio (PI at 10 min /PI at baseline) at 10 min after ultrasound-guided supraclavicular nerve block showed a sensitivity and specificity of 100% for block success at cut-off value of 3.3 and 1.4, respectively [39]. A PI ratio > 1.4 is a good predictor for block success. PI monitoring provide a highly valuable tool to quickly evaluate the success of regional anesthesia in clinical practice.
Indicator of thoracic sympathetic blockade
Laser Doppler flow and palmar temperature change have been used as intraoperative
hyperhidrosis. Perfusion index derived from pulse oximetry in the ipsilateral extremity showed significant increase as early as 1 minute [40] and its mean increase during the first consecutive 10 minutes also exhibit statistical significance with satisfying
sensitivity and specificity [41]. Even in CT-guided thoracic sympathetic blockade with lidocaine injection also demonstrated that PI is a more marked and sensitive indicator than changes in skin temperature for a successful sympathetic blockade [42].
Correlation with anesthetic depth
During anesthesia, peripheral vasodilatation is a well-recognized effect due to vascular tone controlled by the autonomic nervous system was blunted. As a result, perfusion index showed statistically significant correlation with end-expiratory sevoflurane. The perfusion index rise with the induction of anesthesia and fall with emergence in children. The normalized perfusion index (a relative metric by adjusting raw PI initial baseline value to zero) showed significant correlation with MAC value in pediatric patients undergoing minor procedures [43]. Both intravenous
propfol/remifentanil and inhalational anesthesia increase peripheral perfusion. Only correlation between end-tidal desflurane and perfusion index shows significant [44]. No correlation was found between propofol or remifentanil concentrations and PI.
Detection of stress response
Perfusion index varies with fluctuations in vasomotor tone induced by nociceptive stimuli even during anesthesia. PI decreased significantly with no change in heart rate, cardiac index, and stroke volume variation but increased mean blood pressure when skin incision [45]. PI decreased from the baseline after pneumoperitoneum in moderate
easier alternative parameters for detection of stress response during anesthesia [46].
Predictor for central hypovolemia
In healthy volunteers, the pulse oximeter-derived peripheral perfusion index decrease significantly before stroke volume and heart rate increase during progressive lower body negative pressure [47] which stimulate hypovolemic status. Peripheral perfusion index may be a valuable tool to detect early clinically significant central hypovolemia before onset of cardiovascular collapse.
Predict eye opening after sevoflurane anesthesia
Perfusion index was lower before anesthesia and at eye opening when it compared to values at 15 min after induction and at the end of surgery. The reduction of perfusion index between end of surgery and eye opening was 0.76 with gradually decreasing concentration of anesthesia [48]. Perfusion index was a useful variable to assess the timing of eye opening after a general anesthesia.
Predictor for post-anesthetic shivering
As post-anesthetic shivering is frequently preceded by a decrease in peripheral blood flow and an increase in peripheral-core temperature gradient, perioperative perfusion index was correlated with peripheral temperature and peripheral-core temperature gradient. Perfusion index before emergence was significantly lower in patients with post-anesthetic shivering [49]. Measuring perfusion index during and before the end of anesthesia may be a useful predictor of post-anesthetic shivering.
1.2.4 PI study for post-operative assessment Tool for pain assessment
perfusion index may be a good objective tool for pain evaluation. Changing the patient position (a standard painful stimuli) in surgical intensive care unit resulted in a
significant increase of arterial blood pressure, heart rate, and behavioral pain scale for non-intubated (BPS-NI) values compared to baseline readings. Perfusion index showed a significant decrease after application of painful stimulus and there was a good
correlation between the change of PI (delta PI) and the change of BPS-NI values [50].
Another study record visual analogue scale (VAS) together with the PI, heart rate, and mean arterial blood pressure at the first request for analgesia (T1) in post-anesthesia care unit. After adequate analgesia was given for acute post-operative pain, second measurement (T2) was taken after 30 mins. PI was higher significantly at T2 than at T1 with decrease in VAS, HR, and MAP. A decrease in VAS was associated with increase in PI, but there was no statistically significant correlation in the degree of increase in PI and the decrease in VAS. Subjectivity of pain scores reported by individuals may explain the poor correlation [51].
Figure 1.1 Pulse oximeter measurement point
Figure 1.2 Absorption of hemoglobin and oxyhemoglobin
Figure 1.3 Formula of Perfusion Index
Chapter 2
Motivation and Goal of Study
2.1 Motivation of the study
2.1.1 Microcirculation change of Hydronephrosis
Hydronephrosis is a condition that typically occurs when one or both kidneys swell due to urine failing to properly drain from the kidney to the bladder. This can occur from a blockage in the ureters or from an anatomical defect and result in increased pressure within the structures of the kidney and urine-filled dilation of the renal pelvis and/or calyces. According to sonographic evaluation of kidney swelling by Goertz JK and Lotterman S, hydronephrosis can be classified as Grade I enlargement of the calyces with preservation of the renal papillae, Grade II rounding of the calyces with obliteration of the renal papillae, and Grade III calyceal ballooning with cortical
thinning (Fig 2.1). Hydronephrosis can happen at any age and urolithiasis contribute the most in adult patients [1]. The most common complication of hydronephrosis is the development of a urinary tract infection due to urine stasis in the kidney. If left
untreated, or if it affects both kidney, complications such as permanent kidney damage can lead to problems such as high blood pressure and sometimes kidney failure due to distorted structure of kidney and increased pressure within kidney which alter
tubuloglomerular feedback [2]. Obstructive kidney produced stress hormone and inflammatory mediators lead to peripheral microcirculation alteration [3].
Treatment options depends on the severity of hydronephrosis according to
sonographic reports. If the obstruction is partial and the grade is mild, observation with regular follow up and medication is suggested. However, if the obstruction resulted in
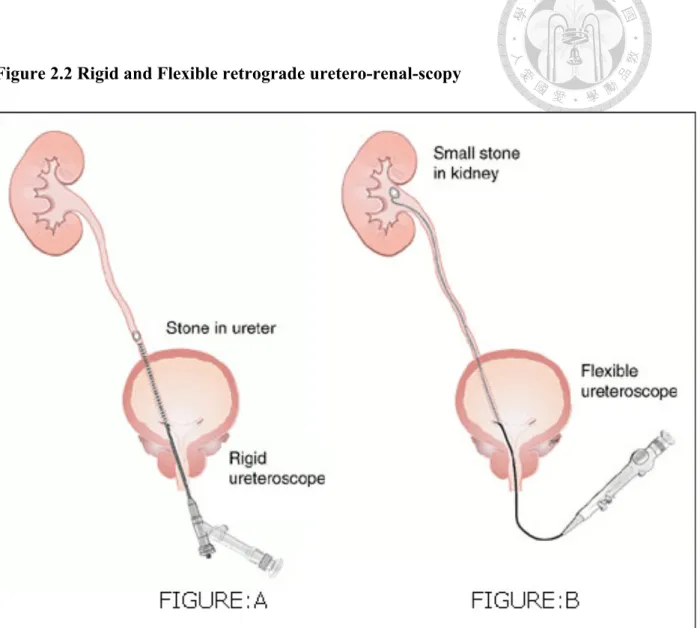
severe hydronephrosis and infection, surgical intervention is recommended. The aim of surgery is to re-establish the patency of urine flow from kidney to bladder according to the causes of obstruction. Uretero-renal-scopy was introduced into the ureter
retrogradely along with a safety guide wire and stone can be disintegrated by
Holmium :YAG laser (Fig 2.2). Uretheral double J stent can be inserted to maintain the patency of ureter. Early treatment of severe hydronephrosis prevent the deteriorated renal function, upcoming hypertension, and altered microcirculation [4]. However microcirculation change of hydronephrosis is not well defined.
2.1.2 Subjectivity of acute postoperative pain
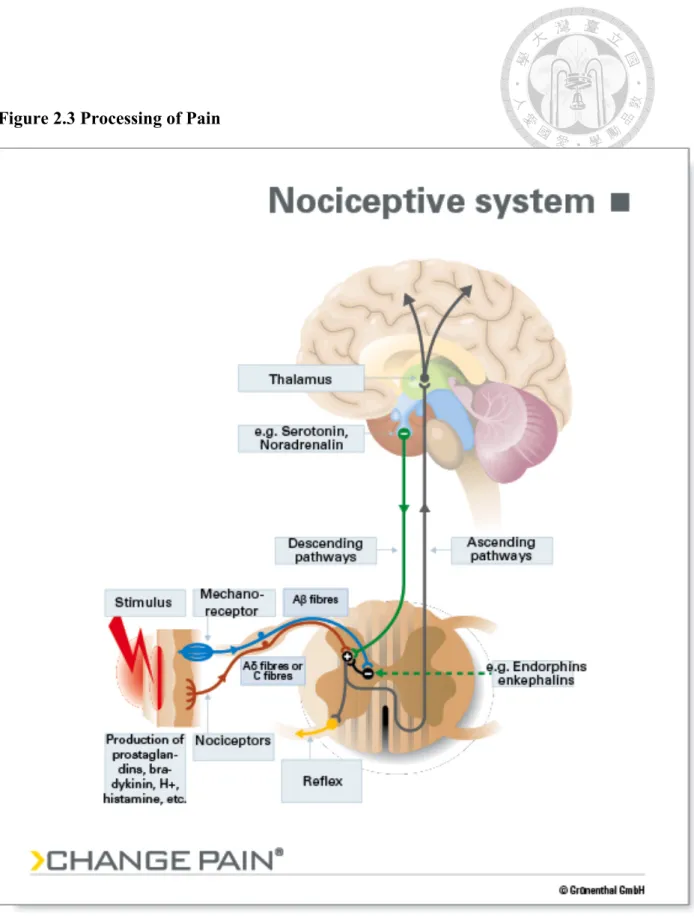
Tissue destruction from surgical intervention stimulate the nociception receptor in the nerve terminal. The nociceptive signal will transmit along spinothalamic tract in the spinal cord and reach cortex to produce pain perception (Fig 2.3). International
Association for the Study of pain defines pain as an unpleasant sensory and emotional experience associated with actual or potential tissue damage, or described in terms of such damage. Pain is usually characterized by increased autonomic nervous system activity resulting in anxiety, tachypnea, tachycardia with hypertension, pallor, and diaphoresis. In extreme situations, acute pain may lead to myocardial ischemia due to increased oxygen consumption [5, 6]. Acute postoperative pain could be prevented by multimodal management, including anesthetic technique, surgical method, nerve block, local anesthesia, and analgesics [7, 8]. Comprehensive assessment of pain intensity and well communication in the postanesthesia care unit is important to manage acute postoperative pain [9-11].
Pain involves a complex interplay between nociceptive pathways and an individuals’
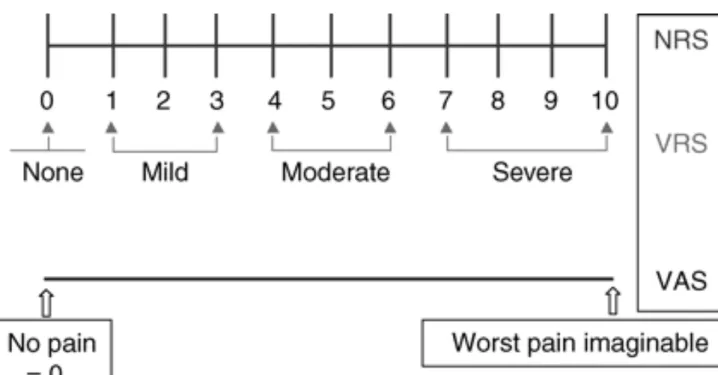
psychological and cognitive state. By definition this subjective experience is best evaluated by self-reporting assessment scales. To assess the pain intensity, the patients are asked to locate their pain on a numeric rating scale (NRS) of 0 to 10. 0 refers to no pain and 10 refer to the worst pain they ever experienced. Visual analogue score is another common assessment tool which is a 10 cm line anchored by verbal description.
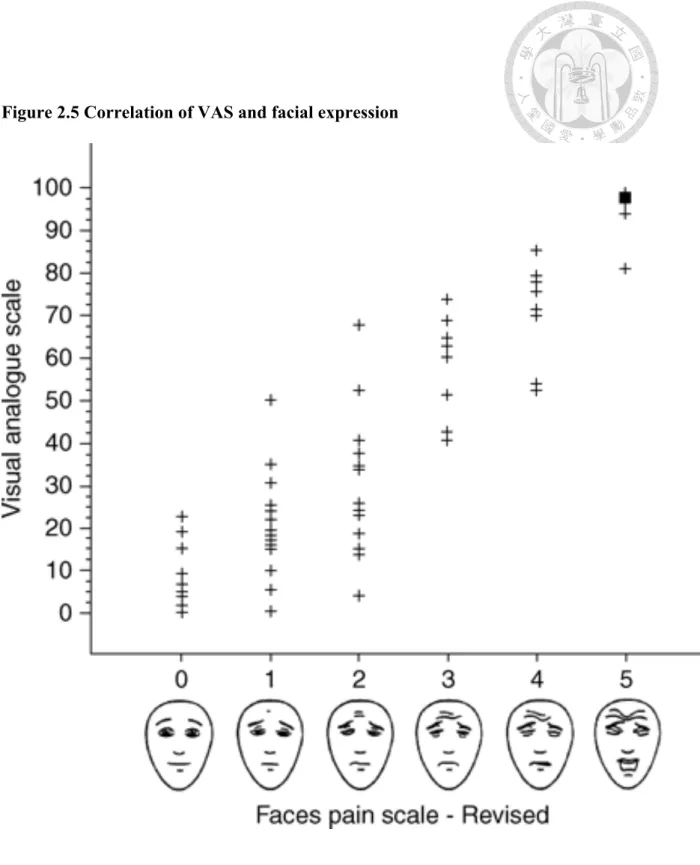
Cut-offs for pain classification was recommended as no pain (0~4mm), mild pain (5-44mm), moderate pain (45-74mm), and severe pain (75-100mm). NRS and VAS are both superior to a four-point verbal categorical rating scales (VRS) (Fig 2.4). However, in younger child, clinicians use faces pain scales with happy and unhappy faces or based on his own experience to manage their pain (Fig 2.5). In individuals with cognitive or neurological impairment, alternative methods are required to prevent underestimate or undertreat of pain. Analgesia nociception index (ANI®, Mdoloris Medical Systems, France) combines the parasympathetic component of heart rate variability (HRV) with respiratory sinus arrhythmia and provide continuous reading, creating a score from 0-100 to reflect adequate analgesia [12, 13]. The surgical pleth indexTM combined pulse photoplethysmographic waveform amplitude and normalized heart rate, creating a linear scale score with high readings suggested to represent nociceptive stimulation [14, 15]. Both non-invasive objective measurement have been shown to discriminate
noxious stimuli under anesthesia but only moderate sensitivity and specificity in
post-operative setting. Undertreat of postoperative pain is remaining un-resolved.
2.2 Goal of Study
Modern anesthetic practice places increasing emphasis on changes in
microcirculation following the initiation of newly developed devices, and this has led to improved organ perfusion and reduced post-operative morbidity [16]. The oximeter probe (Masimo Corp., Irvine, CA, USA) projects infrared light through the tissue bed of the finger tip and can assess peripheral perfusion. Recent studies have used this
instrument to monitor peripheral vascular tone in pregnant woman and predict
hypotension after spinal anesthesia [17], and to provide early prediction of successful brachial plexus block [18]. Based on previous studies, a change in the perfusion index (PI) is a rapid indicator of change in peripheral microcirculation, and this information may help anesthetists to make more appropriate treatment decisions [19-21].
Hydronephrosis can alter tubuloglomerular feedback and may lead to hypertension [22]. A 1974 animal study reported a decline in renal hemodynamics when experimental animals underwent 24 h of unilateral ureteral obstruction [23]. Moreover, Harris et al.
[24] showed loss of excretory function in the post-obstructive kidney when tested by saline loading after release of 24-hocclusion. These results suggest that the impaired diuretic/natriuretic responses in the post-obstructive kidney might be due to reduced hemodynamics, and possibly to increased renal sympathetic nerve activity [25]. These effects change the pressure inside the glomerular capillaries [26], and may lead to a change in microcirculation. Cadio-renal interaction was put emphasis because it can come to heart failure and end-stage renal disease. Both conditions may lead to high mortality and limitation of daily activity. Hydronephrosis is usually regarded as a minor problem without significant symptoms and delayed intervention was warranted after it
developing. The free radicals, release of cytokines, and sudden change of intra-renal pressure after re-establishing urine patency by uretero-renal-scopy with stone manipulation may interfere the microcirculation and cardiac performance.
We used the oximeter probe to test the hypothesis that release of a ureteral obstruction (renal calculus) improves renal hemodynamics and microcirculation, and that these are promptly indicated by increases in the PI. Using perfusion index to detect the acute change of peripheral microcirculation provide a part of evidence to show the systemic impact of hydronephrosis which encourage early intervention before
irreversible physiological change. We also examined the effect of removal of ureteral obstructions on the post-operative estimated glomerular filtration rate (eGFR).
2.2.2 Application of perfusion index in pain assessment
Pain is a subjective sensation that can negatively impact psychological and physiological wellbeing. It can stimulate the sympathetic nerve system and release stress hormones leading to increased oxygen consumption and even resulting in
myocardial ischemia in serious cases [27]. Reducing pain during surgery and preventing and managing pain post-operatively is of crucial importance in the perioperative period [28], and patients care greatly about this issue.
Caregivers prescribe analgesics based on the extent of surgery and their experiences in the postanesthesia care unit (PACU). They also use the visual analogue scale (VAS) score or numeric rating scale (NRS) to subjectively estimate pain severity according to patients’ facial expressions and self-reported pain scores. Then, they select the
appropriate analgesic and evaluate the response to treatment. However, there are still
express themselves adequately, such as in patients with mental retardation or dementia.
Communicating with patients who are recovering from anesthesia or who can not obey orders is difficult. Several studies regarding objective pain assessment tools, such as the surgical stress index during anesthesia [29] and the analgesic nociception index in the postanesthesia care unit [30], to supplement subjective feedback have been reported. An easy-to-use, non-invasive, and convenient monitor which can be used as a supplemental objective assessment tool of pain is in desire
The perfusion index (PI), which is the ratio between the variable pulsatile (AC) and nonpulsatile (DC) signals, is an indirect and noninvasive measurement of peripheral perfusion [31]. It is calculated by means of pulse oximetry by expressing the pulsatile signal (during arterial flow) as a percentage of the nonpulsatile signal (AC/DC X 100), both of which are derived from the amount of infrared (940 nm) light absorbed.
Perfusion index (PI) which is derived from pulse oximeter has the advantages of portability, numeric expression, and non-invasiveness. Although its inter-individual variability is large and easy to be interfered by room temperature and patients’ condition, technological improvement has make it being used as an adjuvant assessment tool in several clinical conditions. The PI may decrease due to increased vasomotor tone and the contraction of peripheral blood vessels when the sympathetic nervous system is activated by pain [32]. The PI may also increase when pain is relieved by the use of adequate analgesics [33]. In this study, we correlated the perfusion indices and visual analogue scale scores of patients to test if the perfusion index is a useful marker for objectively assessing pain relief in the PACU. We also compared the change in PI (ΔPI)
measurements to evaluate if the PI is a useful criterion for discharging patients from the postanesthesia care unit.
Figure 2.1 Grade of Hydronephrosis
Figure 2.2 Rigid and Flexible retrograde uretero-renal-scopy
Figure 2.3 Processing of Pain
Figure 2.4 Pain assessment tools NRS : Numerical rating scales, VAS : visual
analogue scales, VRS : verbal rating scales
Figure 2.5 Correlation of VAS and facial expression
Chapter 3
Perfusion index derived from a pulse oximeter can detect changes in peripheral microcirculation during
uretero-renal-scopy stone manipulation (URS-SM)
3.1 Materials and Methods
This prospective study was approved by the National Taiwan University Hospital Ethics Committee (201205117RIC). One hundred and twenty-six patients diagnosed with ureteral stones were admitted to our department (National Taiwan University Hospital, Taipei, Taiwan) for ureteroscopy (URS) and laser lithotripsy between September 2012 and June 2013. One hundred and thirteen patients were ultimately enrolled. The exclusion criteria were: morbid obesity (BMI > 40 kg/m2), peripheral arterial disease, usage of vasoactive agents, and contraindications to intravenous anesthesia. Although endothelial dysfunction may interfere the amplitude and velocity of changes in PI, we observed changes in PI for more than 5 min after stone
disintegration, so this delayed effect can be ignored. There were 33 women and 80 men, the mean age was 53.7 years (range: 20–79 years), and American Society of
Anesthesiologists Scores (ASA Scores) were between I and III. The grades of
pre-operative hydronephrosis were classified according to Goertz JK and Lotterman S:
grade I was defined as enlargement of the calyces with preservation of the renal papillae, grade II as rounding of the calyces with obliteration of the renal papillae, and grade III as calyceal ballooning with cortical thinning [1].
Study protocol
We obtained written informed consent from patients for enrollment at the pre-anesthesia visit on the day before surgery. No medications were given to patients
hydronephrosis by renal echography at the out-patient department (OPD) visit. After arrival at the OR, each patient was placed in a supine position and fitted with a non-invasive blood pressure cuff, a 3-lead electrocardiogram, and a pulse oximeter probe (Masimo Corp., Irvine, CA, USA) that was attached to the index finger on the ipsilateral side of intravenous catheter. After the signal stabilized, an average of five consecutive readings was recorded (baseline). After reaching a steady depth of
anesthesia, the PI was recorded at 5-minintervals (pre-URS). A 6F/7.5F semi-rigid URS (Richard Wolf Medical Instruments Corporation, Vernon Hills, IL) was then introduced into the ureter retrogradely along with a safety guide wire to locate the ureteral stone.
Then, the stone was disintegrated by use of a Holmium:YAG laser (Odyssey, Convergent Laser Technologies, Alameda, CA,USA). After stone disintegration, readings were defined as post-URS. Ureteral patency was re-examined by URS assure that there was no ureteral injury caused by laser lithotripsy. All procedures involved insertion of a 28F ureteral double J stent into the operated side. The success rate was 100% and the 16F Foley catheter remained in place for one day.
PI was calculated by measurement of the constant amount of light absorbed by non-pulsatile blood and other tissue (DC) and the variable amount of light absorbed by pulsating arterial inflow (AC) and use of the following equation: PI = (AC/DC) × 100%.
Anesthesia was administered as target-controlled infusion of propofol, and the blood concentration target was 5 µg/mL. Fentanyl was given at a concentration of 1 µg/kg body weight. Entropy values were maintained between 40 and 60 with adjustment of the target concentration of propofol by 0.5µg/mL to achieve a steady state of sedation. The
500 mL/h.
Measurement of Serum Creatinine
Serum creatinine (SCr) was measured three times in all patients: at baseline (upon admission), one day after URS laser lithotripsy, and 14 days after URS laser lithotripsy.
The eGFR was calculated as: 186×(Serum Cr)−1.154×(age)−0.203×(0.742 if female)×(1.210 if African- American) [2,3].
Data analysis
Statistical analysis employed SPSS ver. 19, and data are presented as means ±SDs.
The effect of sex and ASA score for patients with different hydronephrosis grades were examined by chi-square tests. Numerical data that had normal distributions and patient data were analyzed by one-way analysis of variance (ANOVA). Changes of variables in each hydronephrosis group were analyzed by repeated measure ANOVA. If there was a significant difference, a post-hoc Turkey HSD test was used to test for differences between groups. Pearson's correlation coefficient (γ) was used to assess the correlation between clinical variables or baseline parameters and the percent change in mean arterial pressure (MAP), PI, and eGFR. The interquartile range (IQR) was plotted relative to PI and MAP over different time periods. A p-value less than 0.05 was considered statistically significant.
3.2 Results
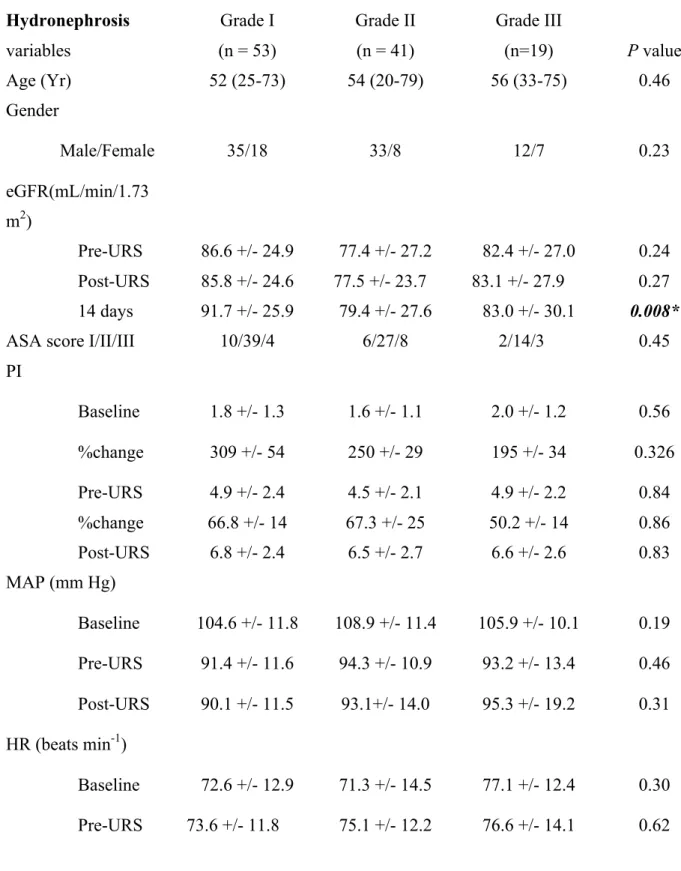
Table 3.1 shows the demographic data of patients with grade I, II, and III hydronephrosis. The 3 groups were similar with regard to age, sex distribution, and ASA score. We recorded MAP, HR, and PI during three time periods (baseline,
pre-URS, and post-URS), and there were no significant differences among the groups at each time. The percentage change of PI from baseline to the pre-URS period (effect of anesthesia) and the pre-URS period to the post-URS period (effect of URS) also indicated no significant differences among the groups. eGFR among these groups also showed no difference between pre-URS and post-URS estimates. However, the eGFR at 14 days after surgery was significantly greater in patients with grade I hydronephrosis (p =0.008).
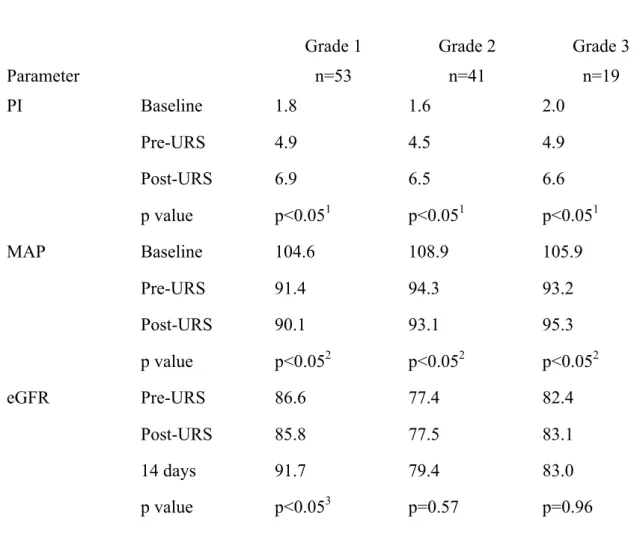
Table 3.2 shows the changes in PI, MAP, and eGFR in the 3 hydronephrosis groups. Repeated measures ANOVA indicated that the PI values of each
hydronephrosis group increased significantly over time (p<0.05 for all). In addition, Turkey HSD tests of the PI values indicated significant differences between baseline and pre-URS values, and between pre-URS and post-URS values (p<0.01 for all).The MAP also declined significantly in all 3 hydronephrosis groups (p <0.05 for all), but the difference between pre-URS and post-URS values were not significant when compared with post hoc test. The increase of eGFR was significant only in patients with grade I hydronephrosis (p <0.05), and the Turkey HSD test indicated significant differences only between pre-URS values and values at 14 days after surgery (p<0.05).
Table 3.3 shows the relationships between percent changes in MAP , PI, and eGFR after stone disintegration for all patients which showed the effect of releasing obstruction on each parameters. The change ratios of MAP and PI were not significantly correlated with baseline PI, MAP, or eGFR. However, the percent change of eGFR14 days after surgery was negatively correlated with baseline eGFR (γ= -0.32, p<0.05). The change
different grades of hydronephrosis (one-way ANOVA). However, the change ratio of PI was significantly and inversely correlated with the change ratio of MAP (γ= -0.30,p
<0.05).
Figure 3.1 and 3.2 show the PI and MAP at the 3 time periods. PI increased after intravenous anesthesia and increased further after stone disintegration. MAP decreased after induction of anesthesia, but there was no further change during stone evacuation.
3.3 Discussion
Calculation of the PI by pulse oximetry provides a measure of changes in peripheral perfusion in the finger. In particular, the PI can predict postoperative shivering [4] and is an early predictor of survival after resuscitation [5]. Based on these previous studies, we conclude that changes in the PI are related to changes in peripheral microcirculation, and these are correlated with vascular status, sympathetic reactions, and function of the circulatory system.
In the present study, anesthesia and surgery of patients with renal calculi increased the measured PI in all hydronephrosis groups. Propofol relaxes vessel tone and decreases sympathetic reactions, resulting in an increase of the PI [6], and this is the likely cause of the 195–309% increase of PI in our patients after anesthesia. However, patients in all 3 of our hydronephrosis groups experienced a further 50.2–67.3%
increase of PI after ureteral stone destruction, even though the level of sedation
remained steady. Moreover, while PI increased after stone destruction, the MAP did not change significantly. This phenomenon was first discovered in this study, and it
supports our hypothesis that release of ureteral obstruction by URS and laser lithotripsy
increases microcirculation during anesthesia and that these changes can be measured by calculation of PI from a pulse oximeter. Our patients had no active changes in
sympathetic tone when under anesthesia, and changes in body temperature can be ignored because of the short duration of surgery. The sudden drop of intra-renal pressure following URS laser lithotripsy is a key factor explaining the subsequent increase of the PI. Stone disintegration and the reestablishment of ureteral patency by an indwelling double-J catheter affects the circulatory system, possibly by free radicals and release of cytokines [7,8], and this leads to microcirculatory changes that theoximeter measures concurrently. The circulatory system can be regarded as a pump system that pumps blood from the heart via the vasculature to each visceral organ. Any change in this system, including cardiac disease (pump dysfunction), vascular disease (circuit impairment), or renal obstruction(outflow stasis), may affect hemodynamic integrity and result in microcirculatory change [9].
Devarajan [10] suggested that serum creatinine should not be used as an indicator of rapid changes in kidney function because its concentration only accurately reflects kidney function in the steady state. Our comparison of patients with different grades of hydronephrosis indicated that only patients with grade I hydronephrosis had significant increases in eGFR at 14 days after URS. This indicates that the degree of
hydronephrosis does not always correlate with renal function, and that eGFR may not be useful for evaluation of surgical success.
We reported the impact of changes in peripheral microcirculation induced by restoration of ureteral patency and urine flow as the percent change of PI (Table 3.3).
suggesting no correlation between microcirculatory changes with hydronephrosis severity following stone disintegration. However, the percentage change of MAP negatively correlated with the percent change of PI (γ=-0.3, p <0.05). This may be because changes in microcirculation mainly affected the distal arterioles (which is innervated by the sympathetic system) and the smooth muscle tone in arterioles, and these preceded the observed change in MAP [11].
There can be great individual variations in PI, and several factors may interfere with measurement of PI [12,13], so many previous studies used the pleth variabililty index (PVI) instead of PI to estimate volume status [14-16]. Nonetheless, our results suggest that PI can be used to assess changes in microcirculation in the perioperative period. The non-invasive nature of pulse oximetry makes it easy to use, and also makes it easy to gather information on changes in peripheral microcirculation [17,18]. In addition, PI can indicate early changes in the sympathetic system and microperfusion in debilitated patients [19]. In this study, we successfully documented changes in
microcirculation via PI following removal of ureteral obstructions. An animal study of the physiology of changes in hydronephrosis and relief of obstructive uropathy should be established to further examine the mechanisms of this effect.
3.4 Conclusions
In conclusion, our results showed that measurement of PI by a pulse oximeter allows monitoring of changes in peripheral microcirculation during endoscopic surgery for unilateral ureteral obstruction, but that eGFR did not change immediately after stone destruction. Use of a pulse oximeter to measure PI is simple and non-invasive, and
provides important information regarding microperfusion in surgical patients. Thus, this method may improve patient safety and help clinicians to make important and prompt decisions while in the operating room.
Table 3.1 Demographic data and the degree of hydronephrosis No significant difference among these groups. Only eGFR 14 days after URS showed significantly different.
Hydronephrosis variables
Grade I (n = 53)
Grade II (n = 41)
Grade III
(n=19) P value
Age (Yr) 52 (25-73) 54 (20-79) 56 (33-75) 0.46
Gender
Male/Female 35/18 33/8 12/7 0.23
eGFR(mL/min/1.73 m2)
Pre-URS 86.6 +/- 24.9 77.4 +/- 27.2 82.4 +/- 27.0 0.24 Post-URS 85.8 +/- 24.6 77.5 +/- 23.7 83.1 +/- 27.9 0.27 14 days 91.7 +/- 25.9 79.4 +/- 27.6 83.0 +/- 30.1 0.008*
ASA score I/II/III 10/39/4 6/27/8 2/14/3 0.45
PI
Baseline 1.8 +/- 1.3 1.6 +/- 1.1 2.0 +/- 1.2 0.56
%change 309 +/- 54 250 +/- 29 195 +/- 34 0.326
Pre-URS 4.9 +/- 2.4 4.5 +/- 2.1 4.9 +/- 2.2 0.84
%change 66.8 +/- 14 67.3 +/- 25 50.2 +/- 14 0.86 Post-URS 6.8 +/- 2.4 6.5 +/- 2.7 6.6 +/- 2.6 0.83 MAP (mm Hg)
Baseline 104.6 +/- 11.8 108.9 +/- 11.4 105.9 +/- 10.1 0.19 Pre-URS 91.4 +/- 11.6 94.3 +/- 10.9 93.2 +/- 13.4 0.46 Post-URS 90.1 +/- 11.5 93.1+/- 14.0 95.3 +/- 19.2 0.31 HR (beats min-1)
Baseline 72.6 +/- 12.9 71.3 +/- 14.5 77.1 +/- 12.4 0.30 Pre-URS 73.6 +/- 11.8 75.1 +/- 12.2 76.6 +/- 14.1 0.62
Post-URS 76.9 +/- 12.3 79.1 +/- 13.9 79.4 +/- 14.0 0.65
abbreviation: eGFR, estimated glomerular filtration rate; ASA, American Society of Anesthesiologists; MAP, Mean arterial pressure; HR, heart rate; URS, ureteroscopy
Table 3.2 The changes in PI, MAP, and eGFR in the 3 hydronephrosis
groups.(compared with repeat measurement ANOVA and then Turkey HSD test each other) PI in three hydronephrosis increase significantly after anesthesia and increases further after releasing urinary obstruction
Grade 1 Grade 2 Grade 3
Parameter n=53 n=41 n=19
PI Baseline 1.8 1.6 2.0
Pre-URS 4.9 4.5 4.9
Post-URS 6.9 6.5 6.6
p value p<0.051 p<0.051 p<0.051
MAP Baseline 104.6 108.9 105.9
Pre-URS 91.4 94.3 93.2
Post-URS 90.1 93.1 95.3
p value p<0.052 p<0.052 p<0.052
eGFR Pre-URS 86.6 77.4 82.4
Post-URS 85.8 77.5 83.1
14 days 91.7 79.4 83.0
p value p<0.053 p=0.57 p=0.96
1Baseline vs Pre-URS vs Post-URS PI in each hydronephrosis group: all significantly different when compared each other by Turkey HSD test (p<0.01);
2Baseline vs Pre-URS, Baseline vs Post-URS MAP in each hydronephrosis group:
significantly different when tested by Turkey HSD test (p<0.01), Pre-URS vs Post-URS MAP: not significantly different;
3Pre-URS vs 14 days, Post-URS vs 14 days eGFR in grade I hydronephrosis : significantly different (p<0.05)
Table 3.3. Relationships between baseline clinical parameters and the percent changes in MAP, PI , eGFR after stone disintegration. Percent changes in MAP, PI, and eGFR have no correlation with baseline MAP, PI, and eGFR. There was also no significant difference in percent change in PI, MAP, and eGFR between each grade of hydronephrosis. Percent change of MAP has negative correlation with percent change of PI.
% MAP change# % PI changes+ % eGFR changes↑
γ P value γ P value γ P value
Baseline MAP (mmHg)
-0.12 0.17 0.13 0.14 -0.12 0.20
Baseline PI -0.01 0.87 -0.13 0.17 0.00 0.98
Baseline eGFR (mL/min/1.73 m2)
0.02 0.77 0.17 0.06 -0.32 <0.05
Grade of hydronephrosis
0.52 0.86 0.56
γ P value
% MAP change# % PI changes+ -0.30 <0.05
% PI changes+ % eGFR changes↑ -0.10 0.33
% eGFR changes↑ % MAP change# 0.09 0.30
#Percent change of MAP : (post-URS MAP-pre-URS MAP) /pre-URS MAP; +Percent change of PI : (post-URS PI-pre-URS PI)/pre-URS PI; ↑Percent change of eGFR : (14 days eGFR-pre-URS eGFR)/pre-URS eGFR
Figure 3.1 .Interquartile range (IQR) of Perfusion Index (PI) in patients with
Grade I, II, and III hydronephrosis. The PI increased after induction of anesthesia,
and increased further after stone disintegration.
Figure 3.2 Interquartile range (IQR) of mean arterial pressure (MAP) in patients
with Grade I, II, and III hydronephrosis. The MAP decreased after induction of
anesthesia, but there were no further changes during stone evacuation.
Chapter 4
An observational study : The utility of Perfusion Index as a discharge criterion for pain assessment in the
Postanesthesia Care Unit
4.1 Materials and Methods
The protocol used in this study was approved by the Institutional Ethics Review Board of National Taiwan University Hospital (Registry Number: 201604074RINB), and informed consent was waived based on its retrospective design. This study was carried out according to the International Conference on Harmonisation (ICH)/WHO Good Clinical Practice (GCP) guidelines and conformed to the principles outlined in the Declaration of Helsinki.
Study design and subjects
This was an observational, retrospective, and single-center study. We reviewed medical records and enrolled female patients aged from 20 to 80 years old with an ASA class of I~III who were scheduled for gynecologic or general surgery and were admitted to the postanesthesia care unit at National Taiwan University Hospital between
November 2015 and May 2016. The exclusion criteria included patients who had unstable vital signs, those who were admitted as emergent cases, those who were intubated, those who were medicated with sedative or vasoactive agents, those who had been diagnosed with peripheral occlusive artery disease, and those who were admitted to the intensive care unit. The patients were monitored with automated noninvasive blood pressure on one arm, a 3-lead electrocardiogram, and a Masimo Radical 7 pulse oximeter probe (Masimo Crop, Irvine, California) on the contralateral index finger for continuous monitoring until discharge from the postanesthesia care unit. The room temperature was maintained at 22°C, and general anesthesia was induced with fentanyl at 1~2 µg/kg, propofol at 1.5~2 mg/kg, and cisatracurium at 0.2 mg/kg. After tracheal
intubation, inhalational sevoflurane or desflurane was maintained at a concentration of 1 to 1.3 MAC and adjusted according to the patient’s vital signs. After surgery was
finished, patients were administered reversal agents (2.5 mg of neostigmine and 0.4 mg of glycopyrrolate ) when spontaneous breathing was regained, and then the patients were sent to the postanesthesia care unit for observation. According to chart record, baseline data (T0) including perfusion index, temperature, heart rate, mean blood pressure, and SpO2 were recorded 5 minutes after entering the operating room.
Postanesthetic data (P0) were recorded when the patients were admitted to the PACU after surgery. The perfusion index and visual analogue scale (VAS) score were recorded when the patients regained consciousness and asked for analgesics for the first time (P1), the second time (P2), and the third time (P3). The PI and VAS were recorded as P10, P20, and P30, 5 minutes after 3 mg of morphine was administered intravenously. Before discharge from the postanesthesia care unit, the PI and VAS were recorded at time point P9. The primary hypothesis of our study was that perfusion index is correlated with VAS, and the secondary hypothesis was that the percentage change of the perfusion index would be useful as a discharge criterion for assessing the wellbeing of the patients.
Statistical analysis
We used GraphPad Prism 6 to perform the statistical analysis. Continuous data are shown as the mean ± SD, and categorical data are shown as percentages. The
Shapiro-Wilk test was used to test the normality of the distribution. We used the Wilcoxon signed-rank test or the paired t-test to separately compare the differences
Friedman test was also used to compare the PI measured at different time points.
Patients were divided into age subgroups and BMI subgroups and the difference of parameters before and after analgesic administration between these subgroups were compared by Kruskal –Wallis test. Correlation between the PI and the VAS was tested by Persons’ correlation coefficient in age, BMI subgroups, and all measurements. To reduce the bias of individual variation in perfusion index, we also evaluate the correlation between the ΔPI (PI after analgesic administration-PI before analgesic administration ) and ΔVAS (VAS after analgesic administration-VAS before analgesic administration), and the percentage change in ΔPI (ΔPI/PI before analgesic
administration) and the percentage change in ΔVAS (ΔVAS/VAS before analgesic administration). The PI measurements at the time when the patients met the discharge criteria were compared with the baseline PI measurements. The percentage change in Δ PI (P9-P0/P0) at the time of discharge from the postanesthesia care unit was calculated, and 99% confidence intervals were constructed to evaluate the use of this measure as a discharge criterion, along with VAS scores < 3. All the tests were 2-tailed, and p < 0.01 was considered statistically significant.
4.2 Results
One hundred three patients were screened, and 80 patients met the inclusion criteria.
The demographic data are shown in Table 4.1. There were 64 and 16 female patients receiving gynecologic and general surgery, respectively. The average morphine consumption in the postanesthesia care unit was 4.5 mg, with an average number of analgesic requests of 1.5. The perfusion index was measured at different time point and
is expressed as the mean ± standard deviation in Fig 4.1. There was significant difference between the baseline PI (T0) and the PI at the time of arrival to postanesthesia care unit (P0) (p<0.001). The PI at the time of discharge from the postanesthesia care unit (P9) was not significantly different from the baseline PI (T0) (p=0.1362).
In total, there were 123 requests for analgesic medication. The PI before analgesic administration (P1, P2, and P3) and the PI after analgesic administration (P10, P20, and P30) were significantly different (p < 0.0001). The VAS score and heart rate before and after analgesic administration also significantly changed (p < 0.0001) (Table 4.2). The PI and the VAS score before and after analgesic administration, the ΔPI (PI after analgesic administration-PI before analgesic administration) and the ΔVAS (VAS after analgesic administration-VAS before analgesic administration), and the
percentage change in ΔPI (ΔPI/PI before analgesic administration) and the percentage change in ΔVAS (ΔVAS/VAS before analgesic administration) were no significant difference between age and BMI subgroups as showed in Table 4.3 and were all weakly correlated (Table 4.4). There was significant correlation between PI and VAS before and after analgesic administration (r=0.742, 0.778 separately) in obesity group (BMI >
30 kg/m2). All the patients had a VAS score < 3 with regard to their wellbeing when they were discharged from the postanesthesia care unit. The mean percentage change in ΔPI (P9-P0/P0) at the time of discharge from the postanesthesia care unit was 66.2%, and the 99% confidence interval was 12.2% ~ 120.3%.
4.3 Discussion
The perfusion index (PI) is derived from plethysmography and is a non-invasive and convenient tool for evaluating peripheral perfusion. It can be used in routine anesthetic practice and can help anesthetists to make decisions based on its characteristics. Several studies were carried out in recent years because the perfusion index was thought to have become more stable and reliable [1]. It has been used to predict hypotension after spinal anesthesia during caesarean delivery [2,3] and as an early indicator of successful nerve block or sympathectomy [4, 5]. It is also correlated with anesthetic depth [6] and can detect stress responses during anesthesia. A decreased PI was associated with changes in position in critically ill non-intubated patients, and the correlation between changes in the PI and changes in BPS-NI values was positive. Perfusion index as a tool for
monitoring acute post-operative pain has been surveyed, but its correlation with visual analogue scale scores was not statistically significant [7].
In our study, the PI at the time of arrival to the postanesthesia care unit was lower than the baseline PI as a result of acute post-operative pain. There was a significant change in heart rate, PI, and VAS before and after the administration of intravenous morphine. Pain can stimulate a sympathetic reaction that increases heart rate and results in peripheral vasoconstriction, leading to a decreased PI. Morphine is an effective and safe analgesic medication for managing acute post-operative pain that can be given incrementally [8]. When acute post-operative pain was well managed, the PI increased, and the VAS score decreased significantly. When patients requested more analgesia and reported a VAS score of more than 5, the PI increased further after the second
administration of intravenous morphine.
score was not established in our study. The ΔPI and ΔVAS were not significantly correlated, and the percentage changes in ΔPI and ΔVAS were also not significantly different. There was still no significant correlation in age and BMI subgroups with exception of PI and VAS before and after analgesic administration in obesity group (BMI > 30 kg/m2) This can be explained because the VAS score is subjective and is based on psychometric properties. Patients may still report higher VAS scores when they suffer from poor emotional and psychological wellbeing even if analgesics are administered. The PI increased due to partial pain relief when analgesics were
administered but did not reflect the VAS scores that the patients subjectively reported.
This irrelevant phenomenon existed regardless of age and BMI. The only significant correlation between PI and VAS before and after analgesic was due to rather few measurements in morbid obesity group.
The criteria for discharge from the postanesthesia care unit included full recovery of consciousness, adequate respiration, and stable blood pressure and heart rate.
Adequate pain control with a VAS score < 3 was also one of the criteria. All the patients who were discharged from the postanesthesia care unit were treated and had VAS scores < 3 in this study. We compared the patients’ baseline PI measurements with the PI at the time of discharge from the PACU and found that there was no significant difference. The mean of the percentage change in ΔPI (P9-P0/P0) was 66.2% with a 99% confidence interval of 12.2% ~ 120.3%. Individual baseline variation in PI
measurements has been lessened by using this parameter, but there is still wide range of data distribution. Most patients discharged from the PACU were in good condition and
from the postanesthesia care unit greater than 12%. As the above result shows, the percentage change in ΔPI can be used as a supplemental objective pain evaluation tool as a discharge criterion in the postanesthesia care unit if the patient is unconscious and cannot properly report a VAS score.
The major limitation of our study is that we included only female patients who underwent gynecological or general surgery in order to achieve homogeneity. However, older women showed less significant changes in PI as measured by electrical
stimulation [9]. This may have lessened the significance of the changes in perfusion index and VAS and have led to negative results. Patients who were using
patient-controlled analgesia were not included in our study and who failed to meet PACU discharge criterion were not included as contrast group. A large-scale study including a larger range of surgeries and patient groups is needed to explore the utility of perfusion index measurements in anesthetic management.
We used perfusion index as a supplemental tool for pain assessment in the postanesthesia care unit. PI values increased when intravenous analgesics were
administered, but the correlation of the PI with VAS was poor due to the subjectivity of VAS. We also used the percentage change in ΔPI at the time of discharge from the PACU as a discharge criterion to lessen inter-individual variation.
4.4 Conclusions
We came to the conclusion that a percentage change in the perfusion index at the time of discharge from the postanesthesia care unit relative to baseline PI measurements of more than 12% can be used as a supplemental objective discharge criterion for pain
assessment in the postanesthesia care unit.
Table 4.1 Demographic data
N=80
Age (years) 45.7 ± 13.2
20~40 28
40~60 39
above 60 13
Female Gender 80 (100%)
Body Mass Index (kg/m2) 25.2 ± 2.8
Normal Weight (18.5~24.9) 33
Over Weight (25~29.9) 42
Obesity (>30) 5
ASA classification (I/II/III) 7/55/18
Intraoperative intravenous fluid administration 892 ± 225
Post-operative morphine usage 4.5 ± 1.7
Gynecological surgery vs. General surgery 64 /16
Table 4.2 Changes in parameters before and after the administration of analgesics
n=123 Before analgesics After analgesics p value
Mean arterial pressure 87.7 ± 12.8 85.2 ± 12.4 0.0003
Heart Rate 72.4 ± 12.3 70.0 ± 11.6 <0.0001
Perfusion index 1.3 ± 1.2 1.7 ± 1.6 <0.0001
Visual Analogue Scale Score 6.6 ± 2.0 4.7 ± 2.3 <0.0001