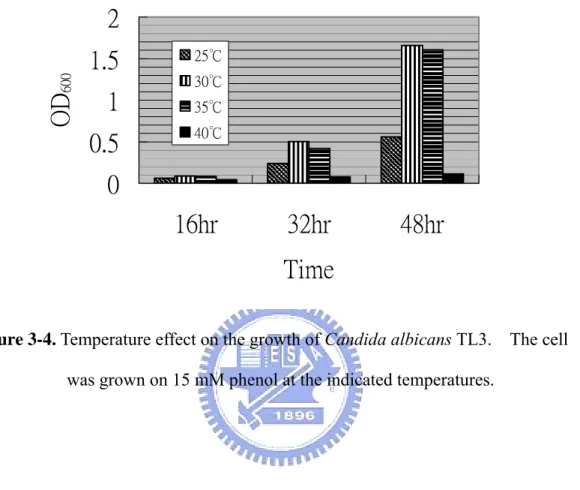
可降解酚之Candida albicans TL3及其catechol 1,2-dioxygenase之單離與特性探討
154
0
0
全文
(2) 可降解酚之 Candida albicans TL3 及其 catechol 1,2-dioxygenase 之單離與特性探討 Isolation and characterization of a phenol degrading Candida albicans TL3 and the study of its Catechol 1,2-dioxygenase Student:San-Chin Tsai Advisor:Yaw-Kuen Li. 研 究 生:蔡三進 指導教授:李耀坤. 國 立 交 通 大 學 應用化學系所 博 士 論 文. A Dissertation Submitted to Department of Applied Chemistry College of Science National Chiao Tung University in partial Fulfillment of the Requirements for the Degree of Doctor of Philosophy in Applied Chemistry November 2006 Hsinchu, Taiwan, Republic of China. 中華民國九十五年十一月.
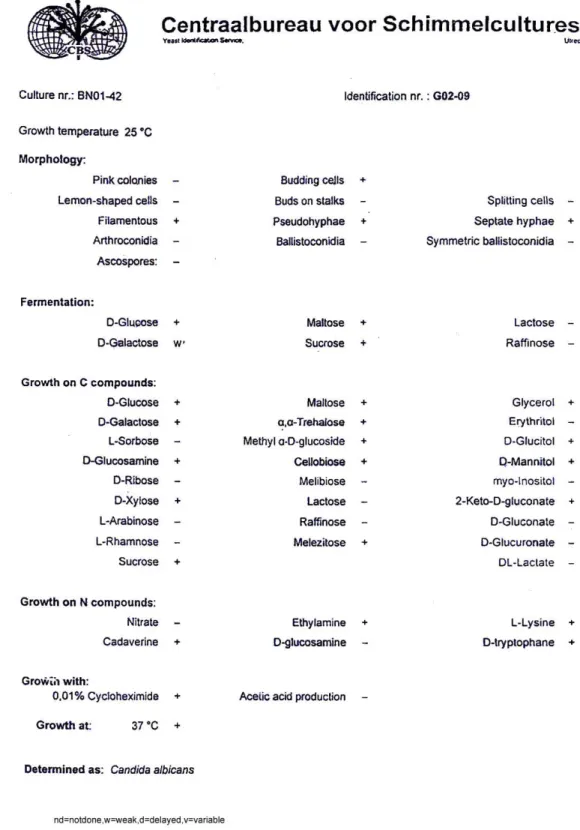
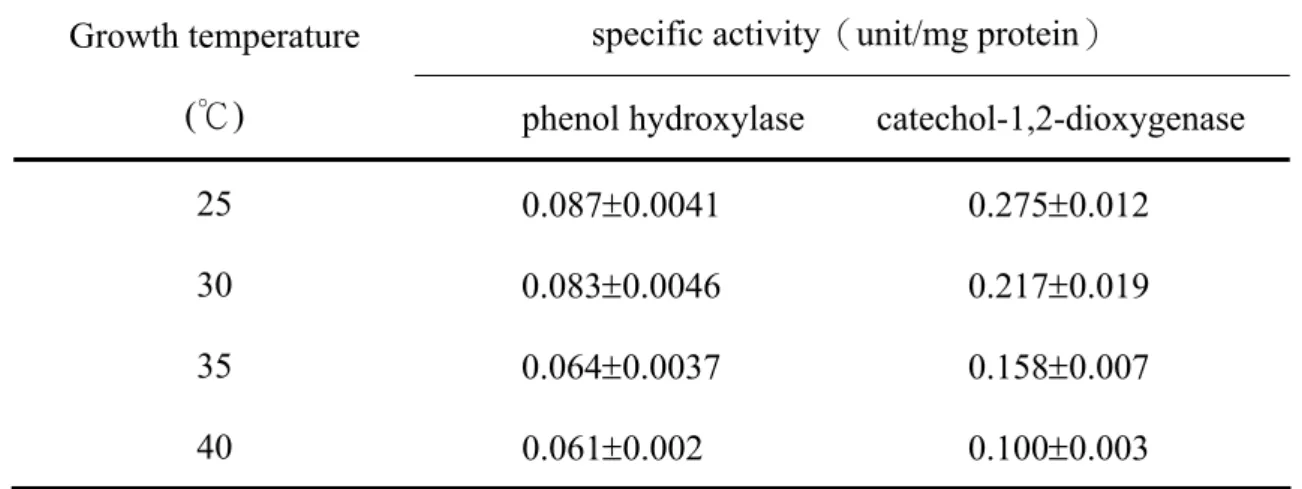
(3) 可降解酚之 Candida albicans TL3 及其 catechol 1,2-dioxygenase 之單離與特性探討 研究生:蔡三進. 指導教授:李耀坤 博士. 國立交通大學應用化學系所 博士班 摘要 本研究已從土壤裡單離出一株可利用酚做為唯一碳源的酵母菌-Candida albicans TL3;相較於其它可降解酚之微生物而言,這菌株不僅對酚具有較高的 耐受性而且分解酚的速率也相對較快,它對酚的降解能力目前是第一次被發現 的。基於酵素活性、層析及質譜等分析,我們推論此菌株是經由 ortho-fission 途 徑分解酚。涉及此途徑的相關酵素-phenol hydroxylase 和 catechol 1,2-dioxydanase 兩者皆是可誘導性酵素,當 C. albicans TL3 被培養在培養液分別 含酚濃度是 22 mM 和 10 mM 時,可達到最大活性。另外,此菌株除了能降解甲醛 樹脂工廠廢液中的酚之外,亦可對甲醛加以降解。 藉由硫酸銨沉澱、Sephadex G-75 凝膠過濾和 HiTrap Q Sepharose 管柱層析, 可從 C. albicans TL3 中分離出一高純度的 catechol 1,2-dioxydanase(1,2-CTD); 此酵素是由相同的兩個單體所組成的,每一個單體的分子量是 32,000 Da 且含一 個鐵離子。此真菌的 1,2-CTD 的 pI 值、最適溫度和最適酸鹼值分別為 5.3~5.7、 25℃和 pH 8.0。由受質特異性之研究顯示,此酵素應屬於 type Ι catechol 1,2-dioxydanase。這是首次有關來自真核細胞之 catechol 1,2-dioxygenase 的研究 I.
(4) 報導。在二維電泳膠片上,可看到此純化的 1,2-CTD 具有五個分子量相近但等電 點稍微不同的蛋白質點;這五種異構型態的 1,2-CTD 可能是不同程度的轉譯後修 飾作用所造成的。利用 Edman 降解和 MALDI-TOF/TOF 對經胰蛋白酶水解後的 此 1,2-CTD 裂解之胜肽片段進行序列分析,所得的序列結果可比對到一與其具高 度相同性來自於 Candida albicans SC5314 的假想蛋白質-CaO19_12036 (GenBank accession no. XM 717691);我們建議此一假想蛋白質應該是一 1,2-CTD。. II.
(5) Isolation and characterization of a phenol degrading Candida albicans TL3 and the study of its Catechol 1,2-dioxygenase Student: San-Chin Tsai. Advisor: Dr. Yaw-Kuen Li. Department of Applied Chemistry National Chiao Tung University Abstract A yeast strain isolated from soil was able to utilize phenol as the sole carbon source and was further identified as Candida albicans TL3. This microbe possesses higher tolerance on phenol (24 mM) as well as stronger activity on the rate of phenol degradation than other microorganisms at 30℃. The capability of this strain on phenol degradation is first reported herein.. Based on the enzymatic,. chromatographic and mass spectrometric analyses, we concluded that C. albicans TL3 follows the ortho-fission pathway on phenol degradation.. The optimal activity of. phenol hydroxylase and catechol 1,2-dioxygenase were found when this strain grew in culture media containing 22 mM and 10 mM phenol, respectively. In addition to phenol, C. albicans TL3 also exhibited catalytic power on degrading formaldehyde in wastewater directly obtained from phenolic resin-producing factory. The catechol 1,2-dioxygenase (1,2-CTD) induced from Candida albicans TL3 was purified via ammonium sulfate precipitation, Sephadex G-75 gel filtration and III.
(6) HiTrap Q Sepharose column chromatography.. The enzyme was purified to. homogeneity and characterized to be a homodimer, with a molecular weight of 32,000 Da for each subunit.. The investigation of this eukaryotic 1,2-CTD revealed that the. iron content for each subunit, pI value, optimal temperature, and optimal pH are 1 iron/subunit, 5.3~5.7, 25℃ and pH 8.0, respectively.. Substrate analysis showed that. the purified enzyme belongs to the type I catechol 1, 2-dioxygenase. The study on this eukaryotic 1,2-CTD was reported for the first time. On 2-D gel analysis of the purified 1,2-CTD, five spots with approximately similar molecular weight but with different pIs were found. spectrometry. same 1,2-CTD.. These spots were further analyzed by MALDI-TOF mass. Results suggested that these spots (isotypes) were derived from the Peptide sequencing on fragments of 1,2-CTD by Edman degradation. and MALDI-TOF/TOF analysis provide information of amino acid sequences for BLAST search, the outcome of the BLAST revealed that this eukaryotic 1,2-CTD has high identity with a hypothetical protein, CaO19_12036, from Candida albicans SC5314 (GenBank accession no. XM 717691). hypothetical protein should be 1,2-CTD.. IV. We, thus, suggested that the.
(7) Acknowledgements I thank very much my advisor professor Yaw-Kuen Li for his guidance and support during my study in the University of Chiao Tung.. Without his helps, my study. would be hard to work. I thank all the members of Li group for their valuable suggestions on research. Their advice and criticism on research have been a great help. I thank my dissertation committee, Professor Jen-Kun Lin, Professor You-Zung Hsieh, Professor I-Ming Chu and Professor Tung-Kung Wu for they spent much time on reading and commenting my manuscript in their busy schedules. I thank all the staffs in the Department of Medical Technology, Yuanpei University for their help on everything. I thank my wife and other families for their tremendous support and sacrifice. Without their help, this study would not be possibly done.. V.
(8) Table of Contents Abstract (Chinese)…………………………………………………………………….I Abstract (English)…………………………………………………………………...III Acknowledgements…………………………………………………………………..V Table of Contents……………………………………………………………………VI List of Tables……………………………………………………………………...…IX List of Figures……………………………………………………………………..….X Chapter 1 Background………………………………………………………………..1 1.1 Introduction……………………………………………………………..1 1.2 References………………………………………………………………6 Chapter 2 Experimental……………………………………………………………..15 2.1 Experimental of Materials……………………………………………..15 2.1.1 Strain………………………………………………………………15 2.1.2 Reagents…………………………………………………………...15 2.1.3 Buffers and solution……………………………………………….16 2.1.4 Equipment………………………………………………………….20 2.2 Experimental of Principles……………………………………………...22 2.2.1. Experimental of Quantitative……………………………………..22 2.2.1.1 Phenol determination………………………………………….22 2.2.1.2 Glucose determination………………………………………...22 2.2.1.3 Formaldehyde determination………………………………….22 2.2.1.4 Protein determination………………………………………….23 2.2.2 Experimental of Chromatographic separations……………………23 2.2.2.1 Ion chromatography…………………………………………...23 2.2.2.2 Reverse phase high-performance liquid chromatography…….24 2.2.2.3 Q sepharose chromatography…………………………………24 2.2.2.4 Gel filtration chromatography………………………………...25 2.2.3 Experimental of Mass Spectrometry Methods…………………….25 2.2.3.1 Gas chromatography-mass spectrometry……………………..25 2.2.3.2 Inductively Coupled Plasma Mass Spectrometry…………….26 2.2.3.3 Quadrupole-time of flight electrospray ionization-mass spectrometry and tandem mass spectrometry…………………26 2.2.3.4 MALDI-TOF-MS and MALDI-TOF/TOF-MS………………27 2.2.4 Others……………………………………………………………...28 2.2.4.1 Salting-out…………………………………………………….28 2.2.4.2 Edman sequencing……………………………………………29 2.2.4.3 Two-dimensional gel electrophoresis…………………………29 2.3 Experimental of Methods………………………………………………31 VI.
(9) 2.3.1 Phenol determination………………………………………………31 2.3.2 Formaldehye determination………………………………………..31 2.3.3 Glucose determination……………………………………………..31 2.3.4 Protein determination………………………………………………31 2.3.5 Phenol hydroxylase activity assay…………………………………31 2.3.6 Catechol 1,2-dioxygenase activity assay…………………………..32 2.3.7 In-solution digestion……………………………………………….32 2.3.8 In-gel digestion…………………………………………………….33 2.3.9 SDS-PAGE………………………………………………………....34 2.3.10 2-D PAGE…………………………………………………………34 2.3.11 Coomassie blue staining…………………………………………..35 2.4 References………………………………………………………………37 Chapter 3 An isolated Candida albicans TL3 capable of degrading phenol at large concentration………………………………………………………………46 3.1 Abstract…………………………………………………………………46 3.2 Introduction……………………………………………………………..48 3.3 Experimental……………………………………………………………50 3.3.1 Media formulation and microorganism screening…………………50 3.3.2 Cell growth and Phenol degradation……………………………….50 3.3.3 Enzyme activity assays…………………………………………….52 3.3.4 Product analysis and identification………………………………...53 3.3.5 Mass-spectrometric analysis……………………………………….54 3.4 Results and discussion………………………………………………….56 3.4.1 Identification of the isolated strain and its tolerance against phenol… ……………………………………………………………………...56 3.4.2 Cell growth and phenol degradation……………………………….57 3.4.3 Effect of temperature and nitrogen bases on the growth of C.albicans TL3………………………………………………………………..59 3.4.5 Characterization of the pathway of phenol degradation by C. albicans TL3……………………………………………………....60 3.4.6 Application to the treatment of industrial effluent………………....64 3.5 Conclusion………………………………………………………………66 3.6 References………………………………………………………………67 Chapter 4 Purification and characterization of a catechol 1,2-dioxygenase from a phenol degrading Candida albicans TL3…………………………………87 4.1 Abstract………………………………………………………………....87 4.2 Introduction……………………………………………………………..88 4.3 Experimental……………………………………………………………90 VII.
(10) 4.3.1 Cell culture…………………………………………………………90 4.3.2 Preparation of crude extract and enzyme purification……………..90 4.3.3 Determination of protein concentration……………………………91 4.3.4 Determination of molecular mass………………………………….91 4.3.5 Enzyme activity assays……………………………………….……92 4.3.6 Kinetic measurements………………………………………….......93 4.3.7 Iron analysis………………………………………………………..93 4.4 Results and Discussion…………………………………………………95 4.4.1 Purification of 1,2-CTD……………………………………………95 4.4.2 Characterization of 1,2-CTD………………………………………95 4.5 Conclusion……………………………………………………………...99 4.6 References……………………………………………………………..100 Chapter 5 Proteomic analysis of a catechol 1,2-dioxygenase from a phenol degrading Candida albicans TL3………………………………………………..…120 5.1 Abstract………………………………………………………………..120 5.2 Introduction……………………………………………………………121 5.3 Experimental…………………………………………………………..123 5.3.1 2-D gel electrophoresis…………………………………………...123 5.3.2 In-gel digestion…………………………………………………...123 5.3.3 N-terminal protein sequencing…………………………………...123 5.3.4 Peptide sequencing by MALDI-TOF…………………………….124 5.4 Results and Discussion………………………………………………..125 5.4.1 MALDI-TOF analysis of the isotypes of 1,2-CTD……………….125 5.4.2 Amino acid sequence analysis of 1,2-CTD………………………125 5.5 Conclusion…………………………………………………………….128 5.6 References…………………………………………………………….129. VIII.
(11) List of Tables Table 2-1. Compositions of in-solution digestion……………………………………39 Table 2-2. Compositions of SDS-PAGE……………………………………………..40 Table 2-3. Compositions of 2-D PAGE………………………………………………41 Table 3-1. Capability of complete degradation of phenol by various yeasts………...72 Table 3-2. Identification of the phenol-degradation isolated strain………………….73 Table 3-3. Growth of Candida albicans TL3 on differents aromatic and related compounds(200ppm)after seven days in shake-flask…………….......74 Table 3-4. Comparison of enzyme specific activity of Candida albicans TL3……...75 Table 3-5. Effect of temperature on specific enzyme activity of Candida albicans TL3*……………………………………………………………………...76 Table 4-1. Purification of catechol-1,2-dioxygenase from C. albicans TL3……….104 Table 4-2. Substrate specificity of 1,2-CTD from C. albicans TL3………………..105 Table 4-3. The properties of 1,2-CTD from C. albicans TL3……………………...106 Table 4-4. Effects of some metal ions and compounds on the activity of 1,2-CTD from C. albicans TL3 for catechol…………………………………………...107. IX.
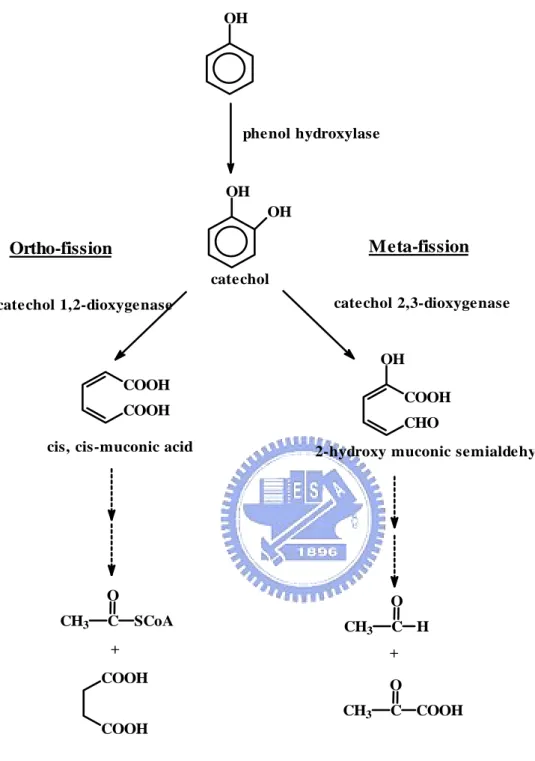
(12) List of Figures Figure 1-1. Two common phenol degradation pathways, the ortho- and meta-fission, occur in microorganisms………………………………………………..13 Figure 1-2. Aerobic catabolism of monoaromatic hydrocarbons…………………….14 Figure 2-1. Condensational reaction of phenol and 4-aminoantipyrine……………...42 Figure 2-2. A process of ESI…………………………………………………………43 Figure 2-3. Configuration used in Q-TOF ESI-MS/MS……………………………..44 Figure 2-4. A process of MALDI-TOF………………………………………………45 Figure 3-1. Time-course profiles of cell growth of Candida albicans TL3………….77 Figure 3-2. Consumption of phenol and glucose of Candida albicans TL3………....78 Figure 3-3. The kinetic parameters of phenol biodegradation catalyzed by C. albicans TL3……………………………………………………………………...79 Figure 3-4. Temperature effect on the growth of Candida albicans TL3……………80 Figure 3-5. Comparison of the growth of Candida albicans TL3 with different nitrogen bases.…………………………………………………………..81 Figure 3-6. HPLC analysis of the product of phenol is catalyzed by crude enzyme extract…………………………………………………………………...82 Figure 3-7. GC-mass analysis of the product of phenol is catalyzed by crude enzyme extract…………………………………………………………………...83 Figure 3-8. Ion-chromatographic analysis of the product(s) of catechol is catalyzed by crude enzyme extract……………………………………………………84 Figure 3-9. Electrospray ionization mass analysis (ESI) of the product of catechol is catalyzed by crude enzyme extract……………………………………...85 Figure 3-10. Growth and phenol and formaldehyde consumption of Candida albicans TL3 was cultured on waste water as a sole carbon source…………….86 Figure 4-1. Separation of catechol 1,2-dioxygenase from 50-70% (NH4)2SO4 ppt on a G-75column (2x80 cm)…………………………………..……………108 Figure 4-2. Separation of catechol 1,2-dioxygenase from the catechol 1,2-dioxygenase-containing fractions of G-75 column on a Q-sephadex column…………………………………………………………………109 Figure 4-3. Native molecular mass determination of 1,2-CTD from C. albicans TL3 by -75 column Chromatography………………………………………110 Figure 4-4. SDS-PAGE analysis of 1,2-CTD from C. albicans TL3 in various steps of purification…………………………………………………………….111 X.
(13) Figure 4-5. The mass spectrum of the purified 1,2-CTD from C. albicans TL3 (inset) and the deconvolution of the spectrum to give a molar mass of 31,994 atomic mass units……………………………………………………...112 Figure 4-6. ESI-MS/MS analysis of the product of catechols catalyzed by 1,2-CTD from C. albicans TL3………………………………………………….113 Figure 4-7. Kinetic property of 1,2-CTD from C. albicans TL3 for catechol……...114 Figure 4-8. Kinetic property of 1,2-CTD from C. albicans TL3 for 4-methylcatechol ……….……………………………………………..115 Figure 4-9. Optimal temperature of catechol 1,2-dioxygenase from C. albicans TL3 .………………………………………………………………...…116 Figure 4-10. Optimal pH of catechol 1,2-dioxygenase from C. albicans TL3……..117 Figure 4-11. Thermal stability of catechol 1,2-dioxygenase from C. albicans TL3..118 Figure 4-12. pH stability of catechol 1,2-duoxygenaase from C. albicans TL3……119 Figure 5-1. 2-D gel electrophoresis (pH 3–10 NL) of 1,2-CTD from C. albicans TL3.……………………………………………………………………133 Figure 5-2. 2-D gel electrophoresis (pH 4⎯7 NL)of 1,2-CTD from C. albicans TL3…………………………………………………………………….134 Figure 5-3. MALDI-TOF mass spectrometry analysis of 5 1,2-CTD isotypes from C. albicans TL3 on the 2-D gel…………………………………………..135 Figure 5-4. RP-HPLC separation of fragments from trypsin-digested 1,2-CTD of C. albicans TL3…………………………………………………………..136 Figure 5-5. De novo sequences of peptide fragment with m/z 932 Da derived from 1,2-CTD from C. albicans TL3……………………………………….137 Figure 5-6. De novo sequences of peptide fragment with m/z 1199 Da derived from 1,2-CTD from C. albicans TL3……………………………………….138 Figure 5-7. Internal amino acid sequence homology of 1,2-CTD of C. albicans TL3 with hypothetical protein CaO19_12036 of C. albicans SC5314 (XP_722784 XP_431250)…………………………………………….139 Figure 5-8. Amino acid sequence alignment of 1,2-CTDs and 1,2-ClCTD………..140. XI.
(14) Chapter 1 Background 1.1 Introduction Phenol and phenolic compounds have been a hazardous pollutant in the environment throughout the last century. Phenols compounds are present in many industrial effluents including resins, petrochemical, coal gasification, ceramic, pharmaceutical, and dye manufacturing industry (Swoboda-Colberg 1995).. Another. toxic compound ⎯ formaldehyde, sometimes be found in phenolic pollutant. The toxicity and bactericide effects of phenol often cause problems with the process of wastewater treatment.. For example, phenol can be toxic to fish at a concentration of. 5 mg/liter and imparts an objectionable taste to drinking water at far lower concentration (Throop 1975/1977). The physical and chemical methods of phenol treatment require many processing steps, which are not only costly and often produce other toxic end products as well (Kobayashi and Rittmann 1982). Biodegradation has been considered as one of the safest, least costly and most socially acceptable methods of decontamination of fouled environment.. The remarkable ability of. microbes to break down chemicals is useful not only in pollution remediation but also serves as a potential tool in pollutant detection. Many microorganisms including Acinetobacter calcoaceticus (Fewson 1967), 1.
(15) Pseudomonas putida (Bayly and Wigmore 1973), Alcaligenes eutrophus (Hughes and Bayly. 1983), Streptomyces. stearothermophilus. setonii (Antai. (Gurujeyalakshmi. and. and Oriel. Crawford 1989),. 1983), Bacillus. Rhodopseudomonas. palustrisand (Rahalkar et al. 1993), Comamonas testosterone (Yap et al. 1999), Trichosporon cutaneum (Neujahr and Varga 1970), Rhodotorula mucilaginosa (Cook and Cain 1974), Candida tropicalis (Neujahr 1974), Ochromonas danica (Semple and Cain 1996), and aquatic fungi (Ristanovic et al. 1975), were found to be capable of degrading phenol at different level of concentration.. These microorganisms utilize. commonly two different pathways of phenol degradation: ortho- and meta-cleavage pathways (Fig. 1-1). Both pathways use phenol hydroxylase in the first step of degradation but they are different in the second degradation step, eukaryotes and prokaryotes use intradiol dioxygenase (ortho-cleavage) and extradiol dioxygenase (meta-cleavage), respectively (Bastos et al. 2000; El-Sayed et al. 2003). Phenols initial conversion to catechols by phenol hydroxylase.. The aromatic. ring of catechols are further opened by intradiol dioxygenase via an ortho-cleavage pathway, to cis, cis-muconate or by extradiol dioxygenase via a meta-cleavage pathway, to 2-hydroxymuconic semialdehyde, respectively, which is subsequently metabolized towards the tricarboxylic acid cycle (Ngai et al. 1990; Chen and Lovell 1990; Aoki et al. 1990).. Mostly, both types of catechols dioxygenase use non-heme 2.
(16) iron as cofactor (intradiol dioxygenase and extradiol dioxygenase contain ferric and ferrous form, respectively) and catalyze the addition of both atoms of molecular oxygen to catechols (Nozaki 1979).. Intradiol dioxygenases are classified into two. structurally different families: catechols 1,2-dioxygenase and protocatechuate 3,4-dioxygenase (3,4-PCD), which are specific for catechol (or its derivatives) and hydroxybenzoates, respectively.. In general, catechols 1,2-dioxygenases are dimeric. proteins with identical or similar subunits. Catechols 1,2-dioxygenases are classified into two types according to their substrate specificities (Ferraroni et al. 2004): type I enzymes are specific for catechols, alkylated catechols (catechol 1,2-dioxygenases, 1,2-CTDs) (Nakai et al. 1990; Eck et al. 1991; Murakami et al. 1997; Briganti et al. 1997; Shen et al. 2004), and hydroxyquinols (hydroxyquinol 1,2-dioxygenases, 1,2-HQDs) (Latus et al. 1995); type II enzymes are specific for chlorocatechols (chlorocatechol 1,2-dioxygenases, 1,2-ClCTDs) (Broderick et al. 1991; Van der Meer et al. 1993; Maltseva et al. 1994) (Fig. 1-2).. Catechol 1,2-dioxygenases play important roles in the degradation pathways of various aromatic compounds and are ubiquitous in microorganisms (Broderick et al. 1991; Latus et al. 1995; Sauret-Ignazi et a1. 1996; Briganti et al. 1997; Strachan et al. 1998; An et al. 2001; Shen et al. 2004; Ferraroni et al. 2004; Ferraroni et al. 2005). Catechol 1,2-dioxygenases from prokaryotic cells have been extensively characterized 3.
(17) in terms of their biochemical and structural properties and their amino acid sequences (Kim et al. 1997; Eulberg et al. 1997; Feng et al. 1999; Pessione et al. 2001; Kim et al. 2002; Caposio et al. 2002; Kim et al. 2003; Earhart et al. 2005). Various catechol 1,2-dioxygenases isozymes that differ in the composition of their subunits are found in microorganisms such as Pseudomonas arvilla C-1, Acinetobacter lwoffii K24, Frateuria sp. ANA-18, Arthrobacter sp. Ba-5-17, and Acinetobacter radioresistens (Aoki et al. 1984; Nakai et al. 1990; Kim et al. 1997; Murakami et al. 1998; Briganti et al. 2000).. Comparison of the amino acid sequence of catechol 1,2-dioxygenases. from reported previously, high.. it was found that the identity of these enzymes are not. However, structural studies of catechol 1,2-dioxygenases showed that the. amino acid residues at the active site are highly conserved, especially those responsible for iron binding (Eulberg et al. 1997; Ridder et al. 1998; Vetting et al. 2000).. Several reports stated that certain soil yeasts possess a great inductive capacity for degradation of diverse aromatic compounds of small molar mass (Middelhoven 1993; Sampaio 1999), but, based on currently available literature, we found that yeasts were not only less commonly reported and in general, their tolerance and rate were inferior to those of bacteria in degrading phenol.. On the other hand, although. there are many reports concerning catechol 1,2-dioxygenase, they are almost (or all) 4.
(18) from bacteria.. Reports on the purification and characterization of purified catechol. 1,2-dioxygenases from eukaryotic cells are scanty or even never be cited. Therefore, how to isolate a naturally occurring yeast strain possessing a capacity to degrade effectively phenol at higher concentration for use as a prospective microorganism to degrade phenols in waste water or treatment of soil and how to purify and characterize 1,2-CTD from this eukaryotic strain are of major interest to us.. 5.
(19) 1.2 References An HR, Park HJ, Kim ES (2001) Cloning and expression of thermophilic catechol 1,2-dioxygenase gene (catA) from Streptomyces setoniihodochrous. FEMS Microbiol Lett 195:17-22. Aoki K, Konohana T, Shinke R (1984) Two catechol 1,2-dioxygenase from aniline-assimilating bacterium, Frateuria species ANA-18. Agric Biol Chem48 (8):2097-104. Aoki K, Nakanishi Y, Murakami S, Shinke R (1990) Microbial metabolism of aniline through a meta-cleavage pathway: isolation of strains and production of catechol 2,3-dioxygenase. Agric Biol Chem 54:205-6. Antai SP, Crawford DL (1983) Degradation of phenol by Streptomyces setonii. Can J Microbiol 29:142-3. Bastos AER, Tornisielo VL, Nozawa SR, Trevors JT, Rossi A (2000) Phenol metabolism by two microorganisms isolated from Amazonian forest soil samples. J Ind Microbiol Biotechnol 24:403-9. Bayly RC, Wigmore GJ (1973) Metabolism of phenol and cresols by mutants of Pseudomonas putida. J Bacteriol 113:1112-20. Briganti F, Pessione E, Giunta C, Scozzafava A (1997) Purification, biochemicalproperties and substrate specificity of a catechol 1,2-dioxygenase from a phenol degrading Acinetobacter radioresistens. FEBS Lett 416:61-4. Briganti F, Pessione E, Giunta C, Mazzoli R, Scozzafava A (2000) Purification and 6.
(20) catalytic properties of two catechol 1,2-dioxygenase isozymes from benzoate-grown cells of Acinetobacter radioresistens. J Protein Chem 19:709-16. Broderick. JB,. O,Halloran. TV. (1991). Overproduction,. Purification,. and. characterization of chlorocatechol dioxygenase, a non-heme iron dioxygenase with broad substrate tolerance. Biochemistry 30:7349-57. Chen YP, Lovell CR (1990) Purification and properties of catechol 1,2-dioxygenase from Rhizobium leguminosarum biovar viceae USDA2370. Appl Environ Microbiol 56:1971-3. Cook KA, Cain RB (1974) Regulation of aromatic metabolism in the fungi: Metabolic control of the 3-oxoadipate pathway in the yeast Rhodotorula mucilaginosa. J Gen Microbiol 85:37-50. Caposio P, Pessione E, Giuffrida G, Conti A, Landolfo S, Giunta C, Gribaudo G (2002) Cloning and characterization of two catechol 1,2-dioxygenase genes from Acinetobacter radioresistens S13. Res Microbiol 153:69-74. Eck R, Bettler J (1991) Cloning and characterization of a gene coding for the catechol 1,2-dioxygenase of Acinetobacter sp. mA3. Gene 123:87-92. El-Sayed WS, Ibrahim MK, Abu-Shady, M, El-Beih, F, Ohmura, N, Saiki, H, Ando A (2003) Isolation and characterization of phenol-catabolizing bacteria from a coking plant. Biosci. Biotechnol. Biochem. 67 (9):2026-9. Eulberg D, Golovleva LA, SchlOmann M (1997) Characterization of catechol catabolic genes from Rhodococcus erythropolis ICP. J Bacteriol 179: 370-81. 7.
(21) Earhart CA, Vetting MW, Gosu R, Michaud-Soret S, Jr LQ, Ohlendorf DH (2005) Structure of catechol 1,2-dioxygenase from Pseudomonas arvilla. Biochem. Biophys. Feng Y, Khoo HE, Poh CL (1999) Purification and characterization of gentisate1,2-dioxygenase from Pseudomonas alcaligenes NCIB9867 and Pseudomonas putida NCIB9869. Appl Environ Microbiol 65:946-50. Ferraroni M, Solyanikova IP, Kolomytseva MP, Scozzafava A, Briganti F (2004) Crystal. structure. of. 4-chlorocatechol. 1,2-dioxygenase. from. the. chlorophenol-utilizing gram-positive Rhodococcus opacus 1CP. J Biol Chem 279:27646-55. Ferraroni M, Seifert J, Travkin VM, Thiel M, Kaschabek S, Scozzafava A, Golovleva L, Schlomann M, Briganti F (2005) Crystal structure of the hydroxyquinol 1,2-dioxygenase from Nocardioides simplex 3E, a key enzyme involved in polychlorinated aromatics biodegradation. J Biol Chem 280:21144-54. Fewson CA (1967) The identity of the gram-negative bacterium NCIB8250 (‘Vibrio 01’), J Gen Microbiol 48:107-10. Gurujeyalakshmi G, Oriel P (1989) Isolation of phenol-degrading Bacillus stearothermophilus and partial characterization of the phenol hydroxylase. Appl Environ Microbiol 55:500-2. Hughes EJL, Bayly RC (1983) Control of catechol meta-cleavage pathway in Alcaligenes eutrophus. J Bacteriol 54:1363-70. Kim SI, Leem SH, Choi JS, Chung YH, Kim S, Park YM, Lee YN, Ha KS (1997) 8.
(22) Cloning and characterization of two catA genes in Acinetobacter lwoffii K24. J Bacteriol 179:5226-31. Kim SI, Kim SJ, Nam MH, Kim S, Ha KS, Oh KH, Yoo JS, Park YM (2002) Proteomeanalysis of aniline-induced proteins in Acinetobacter lwoffii K24. Curr Microbiol 44:61-6. Kim SI, Song SY, Kim KW, Ho EM, Oh KH (2003) Proteomic analysis of the benzoate degradation pathway in Acinetobacter sp. KS-1. Res Microbiol 154:697-703. Kobayashi H, Rittmann BE (1982) Microbial removal of hazardous organic compounds. Environ. Sci. Technol. 16:170–83. Latus M, Seitz HJ, Eberspächer J, Lingens F (1995) Purification and characterization of hydroxyquinol 1,2-dioxygenase from Azotobacter sp. StrainGP1. Appl Environ Microbiol 61:2453-60. Maltseva OV, Solyanikova IP, Golovleva LA (1994) Chlorocatechol 1,2-dioxygenase from Rhodococcus erythropolis 1CP. Kinetic and immunochemical comparison with analogous enzymes from gram-negative strains. Eur J Biochem 226:1053-61. Middelhoven WJ (1993) Catabolism of benzene compounds by ascomycetous and basidiomycetous yeasts and yeast-like fungi. The literature review and in the experimental approach. Antonie Van Leeuwenhoek 63:125-44. Murakami S, Kodama N, Shinke R, Aoki K (1997) Classification of catechol1,2-dioxygenase family: sequence analysis of a gene for the 9.
(23) catechol1,2-dioxygenase showing high specificity for methylcatechols from +. Gram aniline-assimilating Rhodococcus erythropolis AN-13. Gene 185:49-54.. Murakami S, Wang CL, Naito A, Shinke R, Aoki K (1998) Purification and characterization of four catechol 1,2-dioxygenase isozymes from the benzamide-assimilating bacterium Arthrobacter species BA-5-17. Microbiol Res153:163-71. Nakai C, Horiike K, Kuramitsu S, Kagamiyama H, Nozaki M (1990) Three isoenzymes of catechol 1,2-dioxygenase (pyrocatechase), αα, αβ, and ββ, from Pseudomonas arvilla C-1. J Biol Chem 265:660-5. Neujahr HY, Varga JM (1970) Degradation of phenols by intact cells and cell-free preparations of Trichosporon cutaneum. Eur J Biochem 13:37-44. Neujahr HY, Lindsjo S, Varga JM (1974) Oxidation of phenols by cells and cell-free enzymes from Candida tropicalis. Antonie Van Leeuwenhoek 40:209-216. Nozaki M (1979) Oxygenases and dioxygenases. Top Curr Chem 78:145-186. Pessione E, Giuffrida MG, Mazzoli R, Caposio P, Landolfo S, Conti A, Giunta C,Gribaudo. G. (2001). The. catechol. 1,2-dioxygenase. system. of. Acinetobacterradioresistens: Isoenzymes, inductors and gene localization. J Biol Chem 382:1253-61. Rahalkar SB, Joshi SR, Shivaraman N (1993) Photometabolism of aromatic compounds by Rhodopseudomonas palustris. Curr Microbiol 26:1-9. Ridder L, Briganti F, Boersma MG, Boeren S, Vis EH, Scozzafava A, Verger 10.
(24) C,Rietjens IM (1998) Quantitative structure/activity relationship for the rate of conversion. of. C4-substituted. catechols. by. catechol-1,2-dioxygenase. fromPseudomonas putida (arvilla) C1. Eur J Biochem 257:92-100. Ristanovic B, Muntanjola-Cvetkovic M, Munjko I (1975) Phenol degrading fungi from South Adriatic Sea and Lake Skadar. Eur J Appl Microbiol 1:313-22 Sampaio JP (1999) Utilization of low molecular weight aromatic compounds by heterobasidiomycetous yeasts: Taxonomic implications. Can J Microbiol 45:491-512. Sauret-Ignazi G, Gagnon J, Beguin C, Barrelle M, Markowicz J, Pelmont J, Toussaint A. (1996). Characterization. of. a. chromosomally. encoded. catechol. 1,2-dioxygenase(E.C.1.13.11.1) from Alcaligenes eutroohus CH34. Arch Microbiol 166:42-52. Semple KT, Cain RB (1996) Biodegradation of phenols by the alga Ochromonas danica. Appl Environ Microbiol 62:1265-73. Shen XH, Liu ZP, Liu SJ (2004) Functional identification of the gene locus (ncg12319) and characterization of catechol 1,2-dioxygenase in Corybebacterium glutamicum. Biotechnol Lett 26:575-80. Strachan PD, Freer AA, Fewson CA (1998) Purification and characterization of catechol 1,2-dioxygenase from Rhodococcus rhodochrous NCIM13259 and cloning and sequencing of its catA gene. Biochem J 333:741-7. Swoboda-Colberg NG (1995) Chemical contamination of the environment: sources, types, and fate of synthetic organic chemicals. In “Microbial transformation and 11.
(25) degradation of toxic organic chemicals”, eds Young, L.Y., and Cerniglia, C.E., Wiley-Liss, Inc., USA, 27-74. Throop WM (1975/1977) Alternative methods of phenol wastewater control. J Hazard Mater 1:319-29. Van der Meer JR, Eggen RIL, Zehnder AJB, De Vos WM (1993) Sequence analysis of the Pseudomonas sp. Strain P51 tcb gene cluster, which encodes metabolism of chlorinated catechols: evidence for specialization of catechol 1,2-dioxygenase for chlorinated substrates. J Bacteriol 173:2425-34. Vetting MW, Ohlendorf DH (2000) The 1.8Å crystal structure of catechol 1,2-dioxygenase reveals a novel hydrophobic helical zipper as a subunit linker. Struct Fold Des 8:429-440. Yap LF, Lee YK, Poh CL (1999) Mechanism for phenol tolerance in phenol-degrading Comamonas testosteroni strain. Appl Microbiol Biotechnol 51:833-40.. 12.
(26) OH. phenol hydroxylase. OH OH. Meta-fission. Ortho-fission catechol. catechol 2,3-dioxygenase. catechol 1,2-dioxygenase. OH COOH. COOH. COOH. CHO. cis, cis-muconic acid. 2-hydroxy muconic semialdehy. O CH3. C. O SCoA. CH3. +. C H. +. COOH. O CH3. C COOH. COOH. Figure 1-1. Two common phenol degradation pathways, the ortho- and meta-fission, occur in microorganisms.. 13.
(27) Figure 1-2. Aerobic catabolism of monoaromatic hydrocarbons. 14.
(28) Chapter 2. Experimental. 2.1 Experimental of Materials. 2.1.1 Strain. The strain, Candida albicans TL3, used in this study was newly isolated by enrichment culture from the soil sample of a petrochemical plant in Taiwan.. 2.1.2 Reagents. Formaldehyde, ammonium water and FeSO4 were purchased from RDH. Catechol, protocatechuate, Sephadex G-75, TCA, urea, thiourea, TritonX-100, DTT, IPG, ammonium bicarbonate, NADPH, β-mercaptoethanol and antipyrine were purchased from Sigma. 4-Chlorocatechol and cis,cis-muconic acid were purchased from Fluka.. Hydroxyquinol was purchased from Aldrich.. TFA,. phenol and 4-aminoantipyrene were purchased from Riedel-deHaen. Ammonium sulfate, SDS, potassium phosphate, EDTA , NaOH and glucose were purchased from J.T.Baker.. Acetonitrile, coomassie brilliant R250,. methanol and acetic acid were purchased from Merck. from Promega.. Trypsin was purchased. YNB (yeast nitrogen base), agar, tryptone and yeast extract 15.
(29) were purchased from Difco. was purchased from USB. Amersham Pharmacia. from Bio-Rad.. FAD was purchased from CalBiochem.. Agarose. N,N-Methylenebisacrylamide was purchased from. 40 % Acrylamide and protein assay kit were purchased. Tris-(hydroxymethyl) methylamine and glycine were. purchased from BDH. RGSF (RapiGestTM SF) was purchased from Waters.. 2.1.3 Buffers and solution. YNB without amino acids approximate formula per liter: Nitrogen source Ammonium sulfate .................................................... 5.0 g Vitamins Biotin ......................................................................... 2.0 ug Calcium pantothenate ............................................ 400.0 ug Folic acid ................................................................... 2.0 ug Inositol .................................................................2,000.0 ug Niacin .....................................................................400.0 ug p-Aminobenzoic acid .............................................200.0 ug Pyridoxine hydrochloride ...................................... 400.0 ug Riboflavin ...............................................................200.0 ug Thiamine hydrochloride .........................................400.0 ug Compounds supplying trace elements Boric acid ................................................................500.0 ug Copper sulfate .......................................................... 40.0 ug Ferric chloride ........................................................ 200.0 ug Manganese sulfate ...................................................400.0 ug Potassium iodide .................................................... 100.0 ug Sodium molybdate ..................................................200.0 ug Zinc sulfate ..............................................................400.0 ug Salts Calcium chloride .......................................................... 0.1 g Magnesium sulfate ....................................................... 0.5 g 16.
(30) Monopotassium phosphate .......................................... 1.0 g Sodium chloride ...........................................................0.1 g 25 % YNB medium: dissolve YNB in distilled water to make a 250 mg/mL (w/v) solution, and sterilized by filtration through a 0.2 µm filter.. Culture agar: add 6g bactoagar into distilled water and make up the final volume to 400 mL, autoclave. And then dissolve 0.564 g phenol and 10.7 mL 25 % YNB medium in sufficient sterilized agar solution to bring the total volume to 400 mL.. Nitrogen base medium approximate formula per liter: Ammonium sulfate ..................................................... 1.0 g Dipotassium phosphate................................................ 3.4 g Monopotassium phosphate ...........................................4.3 g Magnesium chloride......................................................0.3 g Yeast extract.................................................................0.05 g Calcium chloride .......................................................13.0 ug Ferrous sulfate .............................................................3.0 ug Sodium molybdate…..................................................30.0 ug Manganese sulfate.........................................................5.0 ug Phenol assay solution: mix 1% K3Fe(CN)6 (dissolve in pH 9.7, 0.1M glycine) and 1% antipyrine (dissolve in pH 9.7, 0.1M glycine) = 9 ﹕1. Formaldehy assay solution: add 7.5 g ammonium acetate, 0.1 ml acerylacetone and 0.15 ml acetic acid to 100 ml distilled water. 17.
(31) Phenol hydroxylase assay buffer: 50 mM potassium phosphate buffer, pH 7.6, containing 170-µM phenol, 1-mM β-mercaptoethanol, 0.1-mM EDTA, 10-µM FAD and 170-µM NADPH.. Catechol 1,2-dioxygenase assay buffer: 50 mM Tris-HCl buffer, pH 8.3, containing 5-mM β-mercaptoethanol, 20-µM FeSO4, and 1-mM catechol.. 50 mM Buffers of pH region: pH 5.0 ~ 6.0, sodium acetate; pH 6.5 ~ 8.5, potassium phosphate; pH 9.0 ~ 10.0, Tris-acetate.. 5X sample buffer (SDS-PAGE): mix 31.25 mL 1 M Tris/HCl (pH 6.8 ), 10 g SDS, 25 mL glycerol, 750 µL bromophenol blue (2% in ethanol), 5 µL 2-mercaptoethanol and make up the final volume to 100 mL using distilled water.. Store away 5-10 ml aliquots.. Separating gel buffer: dissolve 18.2 g Tris base and 0.36 mL TEMED in 90mL distilled water and adjust the pH to 8.8 using 6N HCl. Then make up the final volume 100 mL using distilled water, stored at 4℃. 18.
(32) Stacking gel buffer: dissolve 0.6 g Tris base and 40 µL TEMED in 8 mL distilled water and adjust the pH to 6.8 using 6N HCl.. Then make. up the final volume 10 mL using distilled water, stored at 4℃.. Running buffer: 12 g Tris base, 4 g SDS, 57.6 g glycine.. Adjust to pH 8.3 with. 6N HCl and make up the final volume 4 L using distilled water.. 0.1 % Coomassie Brilliant Blue R250: add 0.5 g Coomassie Brilliant Blue R250 200 mL methanol, then, add 50 mL acetic acid and make up the final volume to 500 mL using distilled water.. Destain solution I: mix 75 mL methanol with 100 mL acetic acid, and make up volume to 1 L using distilled water.. Destain solution II: add 200 mL acetic acid to 800 mL distilled water.. Sample buffer (2-DE): 0.5 % IPG buffer containing 6 M urea, 2 M thiourea, 0.5 % TritonX-100 and 1% DTT.. Monomer stock solution: dissolve 1.6 g N, N-Methylenebisacrylamide to 150 mL 40 % acrylamide and make up the final volume to 19.
(33) 200 mL ddH2O.. 4X resolving gel buffer: dissolve 181.5 g Tris basen in 750 mL ddH2O and adjust the pH to 8.8 using 6N HCl. Then make up the final volume 1 L using ddH2O.. Agarose solution: add 0.5 g agarose to 100 mL ddH2O.. Dissolve mixture in the. water bath.. SDS equilibration buffer: mix 1.5 M 10 mL Tris-HCl (pH 8.8), 4 g SDS , 69 mL glycerol, 72 g urea, 200 µL bromophenol blue and make up the final volume to 200 mL using ddH2O. 2.1.4 Equipment. UV-Vis spectrophotometer: Shimadzu, UV-1601 Centrifuges: 1.Beckman, Allegra 21 Serias 2. Kubota Ultrasonic processor: Sonics, VCX-750 HPLC system: Lab Alliance series IC analyzer: DX-500 with Gp40 gradient pump, electrochemical detector (ED40) GC-MS: Agilent 5973 Network MSD™ FPLC system: Amersham Biosciences 20.
(34) Q-TOF ESI-MS (MS / MS): Micromass ICP-MS: Agilent 7500a IPGphor: Pharmacia Hoefer SE 600: Amersham Biosciences TE2 transphor electrophoresis unit: Amersham Biosciences, Hoefer Edman sequencer: Applied Biosystems, Procise 494 sequencer MALDI-TOF ( TOF / TOF): Applied Biosystems, 4700 proteomics analyzer. 21.
(35) 2.2 Experimental of Principles 2.2.1. Experimental of Quantitative 2.2.1.1 Phenol determination (4-aminoantipyrine colorimetric method (Lacoste et al. 1959)): Phenol and 4-aminoantipyrine in an alkaline postassium ferricyanide solution form a dark red condensated product with an absorption maxima at approximately 505 nm (Fig. 2-1).. 2.2.1.2 Glucose determination (GOD-PAP assay) GOD-PAP method was developed for glucose determination.. Glucose oxidase. (GOD) converts the sample glucose into gluconate and hydrogen peroxide (H2O2) (Eq. 1).. H2O2 was coupled to phenol and 4-aminoantipyrine, and then were catalyzed by. peroxidase (POD) to a red quinone product (505 nm) (Eq. 2).. The increase in OD505. correlates with the glucose concentration of the sample. Glucose+O2. ⎯GOD ⎯→ ⎯ Gluconate+H2O2- - - - - - - - -(Eq. 1). ⎯→ Red quinone+ 4 H2O- -(Eq. 2) 2 H2O2+Phenol+4-Aminoantipyrine ⎯ ⎯ POD. 2.2.1.3 Formaldehyde determination (Hantzsch reaction) (Nash 1953): The mean of Hantzsch reaction usually used for colorimetric estimating formaldehyde concentration.. When traces of formaldehyde are added to 22.
(36) approximately neutral solutions of acetylacetone and ammonium salt, a yellow color gradually develops owing to the synthesis of diacetyldihydrolutidine (DDL). 2.2.1.4 Protein determination: Scopes method (Scopes 1974) ⎯ Using the below equation (Eq. 3), to obtain a value for the extinction coefficient of a protein at 205 nm which gives results mostly correct to within 2 % when used for estimating protein concentration. 27.0. Є2051 mg/ml = 1. - - - - - - - - -(Eq. 3). 3.85 X (A280/A205). Bradford method (Bradford 1976) ⎯ The protein concentration was estimated by the dye binding method of bicinchoninic acid (BCA) and using bovine serum albumin as a standard. This method combines the well-known reduction of Cu2+ to Cu1+ by protein in an alkaline medium with the highly sensitive and selective colorimetric detection of the cuprous cation (562 nm) using an unique reagent that contains bicinchoninic acid. 2.2.2 Experimental of Chromatographic separations 2.2.2.1 Ion chromatography (IC) Ion chromatography is a special form of liquid chromatography where charged species are separated by selective distributions in an electrolytic mobile phase and a stationary phase with weak ionic sites. Detection in Ion Chromatography is usually 23.
(37) performed by a conductivity detector - the greater the concentration of ions the higher the conductivity of the solution.. However, because the mobile phase consists of an. electrolyte, the conductivity of the mobile phase itself is quite high. This results in a large background current that must be dealt with in order to make sensitive measurements.. The "suppressor" system neutralizes the mobile phase salts thereby. lowering the background current. 2.2.2.2 Reverse phase high-performance liquid chromatography (RP HPLC) Reverse Phase HPLC is one of common form of chromatography used in compounds separation. (stationary. phase. is. Compounds stick to reverse phase HPLC columns generally. made. up. of hydrophobic. alkyl. chains. (-CH2-CH2-CH2-CH3 )) in high aqueous mobile phase and are eluted from RP HPLC columns with high organic mobile phase. In RP HPLC compounds are separated based on their hydrophobic character. Sample can be separated by running a linear gradient or isocratic mode of the organic solvent. 2.2.2.3 Q sepharose chromatography Q sepharose (strong anion exchanger) chromatography separates proteins with differences in charge. The separation is based on the reversible interaction between a charged protein and an anion exchanger (stationary phase). Proteins bind as they are loaded onto a column.. Conditions are then altered so that bound substances are 24.
(38) eluted differentially. This elution is usually performed by increases in salt concentration or changes in pH.. Most commonly, samples are eluted with salt, using. a gradient elution. 2.2.2.4 Gel filtration chromatography Gel filtration chromatography separates proteins with differences in size. this method, fine, porous beads are packed into a chromatography column.. In. When. proteins are loaded onto the column, larger molecules are excluded from the gel beads and emerge from the column sooner than smaller molecules, whose migration is retarded because they can enter the beads. 2.2.3 Experimental of Mass Spectrometry Methods. 2.2.3.1 Gas chromatography-mass spectrometry (GC-MS). GC-MS is a candidated technique use for the analysis of volatile compounds such as catechol. Capillary GC is a separation technique in the gaseous phase where a sample (which is most often derivatized) passes through capillary tubes whose inner walls contain a thin film of an adsorbing medium. When the components are eluted they may be detected by mass spectrometery. The MS performs either electron impact (EI) or chemical ionisation (CI) on the elutant in order to produce a mass spectrum.. 25.
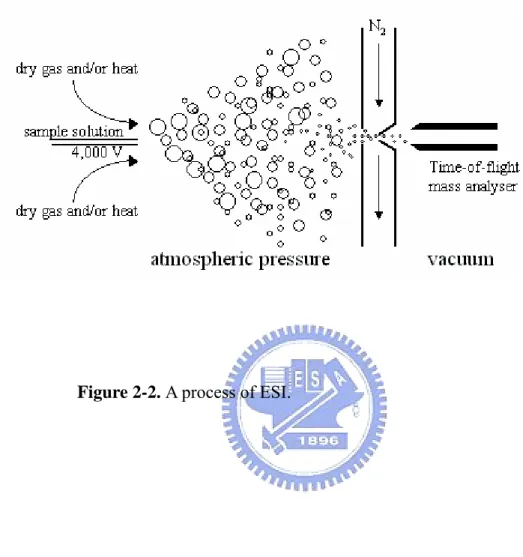
(39) This spectrum is then used to identify the components of the sample by compound library searching (e.g., via NIST which contains 80,000 spectra).. 2.2.3.2 Inductively Coupled Plasma Mass Spectrometry (ICP-MS): ICP-MS is a very powerful tool for trace (ppb-ppm) and ultra-trace (ppq-ppb) elemental analysis. In ICP-MS, a plasma or gas consisting of ions, electrons and neutral particles is formed from Argon gas. The plasma is used to atomize and ionize the elements in a sample. The resulting ions are then passed through a series of apertures (cones) into the high vacuum mass analyzer. The isotopes of the elements are identified by their mass-to-charge ratio (m/e) and the intensity of a specific peak in the mass spectrum is proportional to the amount of that isotope (element) in the original sample. IC 2.2.3.3 Quadrupole-time of flight electrospray ionization-mass spectrometry and tandem mass spectrometry (Q-TOF ESI-MS and MS/MS) ESI-MS is one of the two most common methods of mass spectrometry for protein analysis. In this MS method the ionization process is carried out at atmospheric pressure (API), and involves spraying a solution of the sample in a suitable solvent out of a small needle, to which a high voltage is applied (Fig. 2-2) (http://qbab.aber.ac.uk/roy/mss/qtof.htm). This process produces small charged droplets, and the solvent is the evaporated leaving the sample molecule in the gas phase 26.
(40) and ionized. This is then 'swept' into a MS that is held essentially in vacuo and the ions separated and detected using a reflectron-based time-of-flight (TOF) analyser. The attachment of many protons per protein molecule leads to a series of m/z peaks for this single protein. By computer analysis of the data from this series of peaks that generates a single peak at the correct molecular mass of the protein.. In this MS-MS approach (depicted below) a first mass spectrometer (MS-1) that employs a quadrupole mass filter is tuned to allow only the analyte ion of interest through (Fig. 2-3) (http://qbab.aber.ac.uk/roy/mss/qtof.htm). This is then taken into a collision cell where Argon is used to fragment the analyte, and the so-called daughter ions are then swept into a second time-of-flight MS (MS-2) where they are separated and detected.. 2.2.3.4 MALDI-TOF-MS and MALDI-TOF/TOF-MS. MALDI-TOF-MS is another of the two most common method of mass spectrometry for protein analysis. In this MS method a solid matrix is used, which absorbs. light. at. the. wavelength. the. laser. produces. (Fig.. 2-4). (http://qbab.aber.ac.uk/roy/mss/qtof.htm). The sample (e.g., the fragments of protein spot from a 2-D gel are excised and digested with a specific protease) is mixed with a matrix solution and allowed to co-crystallise on a target plate. When the laser is fired 27.
(41) at the target the matrix absorbs the laser light energy which vaporizes it (it desorbs from the surface) and this carries some of the sample with it. At the time that the laser is pulsed a voltage is applied to the target plate to accelerate the ionised sample towards a time-of-flight (TOF) mass analyser. This peptide mass fingerprint can then be used to search databases to identify the protein. The precision is considered to be approx 10 ppm.. In this tandem MS approach that there are an ion selecting filter (allow only the peptide fragment ion of interest through) and a collision cell between TOF-1 and TOF-2.. The de novo sequencing of this interested peptide can be predicted by. analysis of the special computer software. 2.2.4 Others. 2.2.4.1 Salting-out. The solubility of protein depends on the salt concentration in the solution. As the salt concentration is reached to the point of maximum protein solubility. Further increase in the salt concentration, protein starts to precipitate when there are not sufficient water molecules to interact with protein molecules. This phenomenon of protein precipitation in the presence of excess salt is known as salting-out. Among of. 28.
(42) these salts, ammonium sulfate has been the most widely used to effect protein separation and purification through salting-out.. 2.2.4.2 Edman sequencing. Edman sequencing is known as N-terminal sequencing of a protein. In this technique, the N-terminal amino acid is derivatized with PITC (phenylisothiocyanate), cleaved by acid and identified by reverse phase chromatography. Repeating this process gives a protein sequence.. 2.2.4.3 Two-dimensional gel electrophoresis Two-dimensional (2D) separation involves first separating protein based on their isoelectric point (pI) using isoelectric focusing (IEF).. The isoelectric point is the pH. at which there is no net electric charge on protein.. IEF is an electrophoretic. technique whereby proteins are separated in a pH gradient. An electric field is applied to the gradient and protein migrate to the position in the pH gradient equivalent to the pI (Gorg et al. 2000). The second step in 2D gel electrophoresis is to separate proteins based on molecular weight using SDS-PAGE. Individual proteins are then visualized by Coomassie or silver staining techniques or by autoradiography. Because 2D gel electrophoresis separate proteins based on independent physical characteristics, it is a 29.
(43) powerful means to resolve complex mixtures proteins. Modem large-gel formats are reproducible and are the most common method for protein separation in proteomic studies.. 30.
(44) 2.3 Experimental of Methods 2.3.1 Phenol determination. Mix 50 µL supernatant sample with 950 µL phenol assay solution at 30oC and measure spectrophotometrically absorbance at 505 nm after a 30 min incubation.. 2.3.2 Formaldehye determination. o Mix 10 µL supernatant sample with 990 µL formaldehyde assay solution at 50 C. and measure spectrophotometrically absorbance at 412 nm after a 5 min incubation.. 2.3.3 Glucose determination. o Mix 50 µL supernatant sample with 950 µL GOD-PAP assay buffer at 37 C and. measure spectrophotometrically absorbance at 505 nm after a 5 min incubation.. 2.3.4 Protein determination (Bradford method). Mix 10 µL supernatant sample with 990 µL protein assay solution at 37 C and o. measure spectrophotometrically absorbance at 562 nm after a 30 min incubation.. 2.3.5 Phenol hydroxylase activity assay. Mix 30 µL supernatant crude enzyme extract with 970 µL phenol hydroxylase o assay buffer at 25 C and measure spectrophotometrically absorbance at 340 nm per. 31.
(45) min (Hayaishi et al. 1957).. 2.3.6 Catechol 1,2-dioxygenase activity assay. Mix 2 (or 10) µL supernatant crude enzyme extract with 998 (or 980) µL o catechol 1,2-dioxygenase assay buffer at 25 C and measure spectrophotometrically. absorbance at 260 nm per min (Varga and Neujahr 1970).. 2.3.7 In-solution digestion 1.. Dissolve 300 µg of target protein in 700 µL of ABC solution and 200 µL of RGSF solution, in a 1.5-mL plastic microcentrifuge tube.. 2. Add 100 µL of DTT solution and mix the sample by gentle vortex. 3.. Reduce the protein mixture for 30 min at 60℃.. 4. Add 200 µL of IAA solution and mix the sample by gentle vortex. 5.. Alkylated the protein mixture for 30 min at room temperature and avoid light.. 6. Add 100 µL of trypsin solution and mix the sample by gentle vortex. Then, carry out the digestion for 37℃, 18 h. 7.. Adding 120 µL of HCl to stop the reaction (37℃, 45 min).. 8.. Centrifugation and filtration of the solution for HPLC separation. Table 2-1 list the in-solution digestion compositions. 32.
(46) 2.3.8 In-gel digestion. 1. Transfer the gel slices (protein sports) from 2-D gel into a cleaned 650 microcentrifuge PP tube (siliconized, methanol washed).. It is better to cut. the protein sports into 1 mm3 pieces.. 2. Add 100 µL of 50% acetonitrile / 25 mM ammonium bicarbonate buffer (pH 8.5).. Soak for 15 min.. buffer completely.. Centrifuge at 13000 rpm for 1 min. Remove. Repeat this step twice or more times.. 3. Soak the gel in 100 µL of 100 % acetonitrile for 5 min (allow gel slices turn white) and centrifuge at 13000 rpm for 1 min.. Remove acetonitrile.. 4. Dry the gel slices for about5 min in a speed vac. 5. Rehydrate the gel slices with 0.1 µg trypsin in 10 µL 25 mM ammonium bicarbonate buffer (pH 8.5).. 6.. Crash the gel slices with a cleaned siliconized PP microcentrifuge pestle.. 7.. Spin down the gel pieces / trypsin solution and incubate at 37 °C for 16 h.. 8. Add 50 µL of 50 % acetonitrile / 5 % TFA to sample gel.. Sonicate sample. gel for 10 seconds, and then stop for 10 seconds. Repeat sonication 10 times. 33.
(47) 9.. Spin down the gel pieces at 13000 rpm for 1 min.. Aspirate the. supernatant containing peptide mixtures from the sample tube and transfer to the corresponding new tube.. 10.. Repeat step 8 to 9.. Combine the two extract peptide solutions and. concentrate in a speed vac. at 35 °C to 1-2 µL.. 11.. Redissolvation:. It is recommended to dissolve the sample with 1 µL of 1 % formic acid first, then add 9 µL 50 % acetonitrile / 0.1 % formic acid and sonicate for 30 seconds.. 2.3.9 SDS-PAGE SDS-PAGE is performed essentially according to the method of Dais and Laemmli using a gel system (mightly Small II SE250).. In SDS-PAGE, the protein. sample is diluted in sample buffer (5X) at room temperature and a constant voltage of 150 V. Table 2-2 list the SDS-PAGE compositions.. 2.3.10 2-D PAGE First dimension (isoelectric focusing). 1. Pipettle sample buffer mixed with sample into the strip holder. 34. Then, place t.
(48) he IPG strip gel into the strip holder with the dried gel side down avoiding air bubbles.. Pipettle paraffin oil over the strip to avoid strip dry out or urea. crystallize out.. 2. Rehydration of the IPG strip loading under 30 V and focusing for 12 h in the strip holder on the IPGphor system.. Then, instrument setting as the. following program for IEF separation. Voltage 30 V 500 V 1000 V 8000 V. Time 12 h 2h 2h 4h. Second dimension (SDS polyacrylamide gel electrophoresis). 1. When IEF run is finished, the IPG strip is directly transferred to SDS equilibration buffer with 1% DTT or 2.5 % iodoacetamine for 12-15 min, and further undergo second dimension electrophoresis.. 2. The IPG strip is placed on the SDS gel and overlayed with agarose solution.. 3. SDS-PAGE run about 5 h 30 min under 200 V.. 2.3.11 Coomassie blue staining. After electrophoresis, the gel is soaked in Coomassie blue R250 staining 35.
(49) solution for 20 min.. Then the gel is destained with destaining solution I for 20 min. twice times and continue to destain the gel with destaining solution II until the stained band (or sport) is distinct against a clear background.. 36.
(50) 2.4 References. Blackstock WP, Weir MP (1999) Proteomics: quantitative and physical mapping of cellular proteins. Trends in Biotechnolgy 17:121-7. Bradford MM (1976) A rapid and sensitive methods for the quantitation of microgram quantities of protein utilizing the principle for protein-dye binding. Anal Biochem 72:248-54. Cole RB (1997) Electrospray ionization mass spectrometry: fundamentals, instrumentation and applications. Wiley, New York.. Gorg A, Obermaier C, Boguth G., Harder A, Scheibe B, Wildgruber R, Weiss W (2000) The current state of two-dimensional electrophoresis with immobilized pH gradients. Electrophoresis 21:1037-53. Hayaishi O, Katagiri M, Rothberg S (1957) Studies on oxygenases: pyrocatechase. J Biol Chem 229: 905-20. Lacoste RJ, Venable SH, Stone JC (1959) Modified 4-aminoantipyrene colorimetric method for phenols. Applications to an acrylic monomer. Anal Chem 31:1246-9. Nash T (1953) The colorimetric estimation of formaldehyde by means of the Hantzsch reaction. Biochem J 55:416-21. Scopes RK (1974) Measurement of protein by spectrophotometry at 205 nm. Anal Biochem 59:277-82. 37.
(51) Varga JM, Neujahr HY (1970) Purification and properties of catechol 1,2-dioxygenase from Trichosporon cutaneum. Eur J Biochem 12:427-34.. Yates JR (2000) Mass spectrometry - from genomics to proteomics. Trends in Genetics 16:5-8.. 38.
(52) Table 2-1. Compositions of in-solution digestion.. Reagents. Concentration. Ammonium bicarbonate. 25 mM. RGSF. 5X. DTT. 50 mM. IAA. 100 mM. Trypsin. 100 ng / µL. HCl. 500 mM. 39.
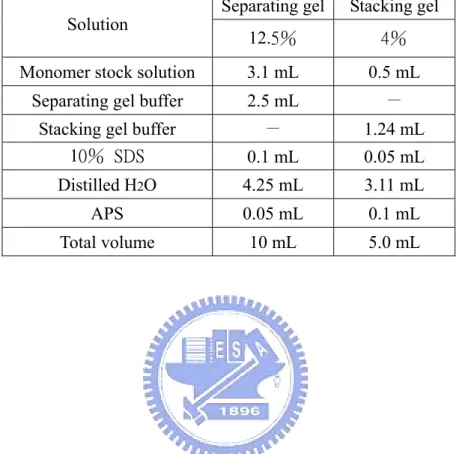
(53) Table 2-2. Compositions of SDS-PAGE.. Separating gel. Stacking gel. 12.5%. 4%. Monomer stock solution. 3.1 mL. 0.5 mL. Separating gel buffer. 2.5 mL. -. Stacking gel buffer 10% SDS. -. 1.24 mL. 0.1 mL. 0.05 mL. Distilled H2O. 4.25 mL. 3.11 mL. APS. 0.05 mL. 0.1 mL. Total volume. 10 mL. 5.0 mL. Solution. 40.
(54) Table 2-3. Compositions of 2-D PAGE. Solution. 12.5%. Monomer stock solution. 20.8 mL. 4X resolving gel buffer. 12.5 mL. TEMED 10% SDS. 16.5 µL. ddH2O. 15.9 mL. 10% APS. 250 µL. Total volume. 50 mL. 0.5 mL. 41.
(55) C6H5 H3C H3C. N. N. OH O NH2. +. C6H5 oxidation aklali. H3C H3C. N. N. O N. Figure 2-1. Condensational reaction of phenol and 4-aminoantipyrine.. 42. O.
(56) Figure 2-2. A process of ESI.. 43.
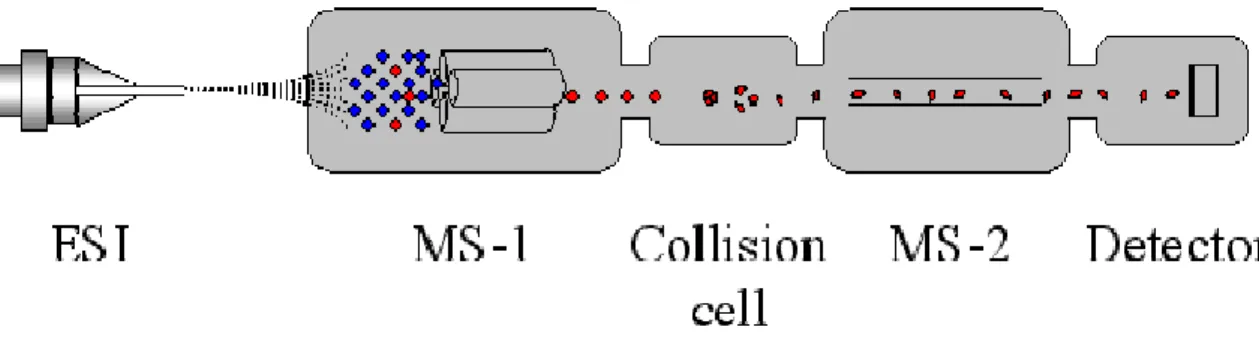
(57) Figure 2-3. Configuration used in Q-TOF ESI-MS/MS.. 44.
(58) Figure 2-4. A process of MALDI-TOF.. 45.
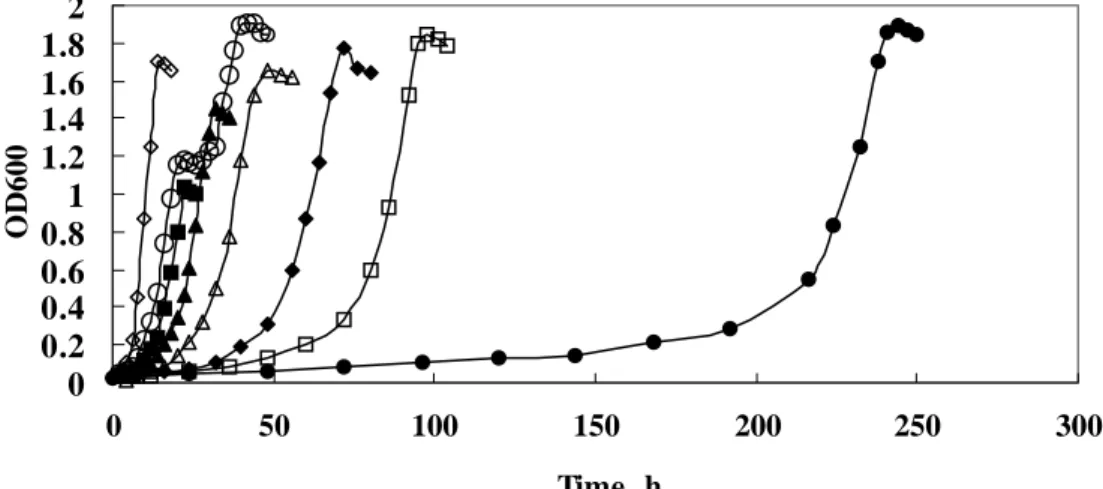
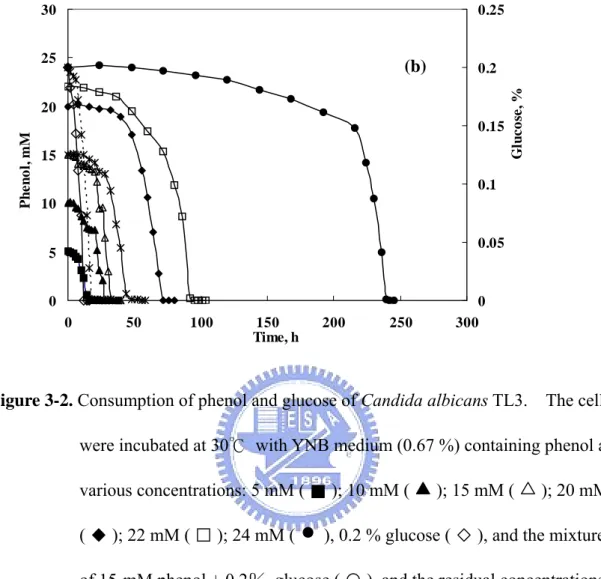
(59) Chapter 3 An isolated Candida albicans TL3 capable of degrading phenol at large concentration. 3.1 Abstract. An isolated yeast strain was grown aerobically on phenol as a sole carbon source up to 24 mM; the rate of degradation of phenol at 30 oC was greater than other microorganisms at the comparable phenol concentrations. This microorganism was further identified and is designated Candida albicans TL3.. The catabolic activity of. C. albicans TL3 for degradation of phenol was evaluated with the Ks and Vmax values of 1.7 ± 0.1 mM and 0.66 ± 0.02 µmol/min/mg of protein, respectively. With application of enzymatic, chromatographic and mass-spectrometric analyses, we confirmed that catechol and cis, cis-muconic acid were produced during the biodegradation of phenol performed by C. albicans TL3, indicating the occurrence of an ortho-fission pathway. The maximum activity of phenol hydroxylase and catechol-1,2-dioxygenase were induced when this strain grew in phenol culture media at 22 mM and 10 mM, respectively. In addition to phenol, C. albicans TL3 was effective in degrading formaldehyde, which is another major pollutant in waste water from a factory producing phenolic resin.. The promising result from the. bio-treatment of such factory effluent makes Candida albicans TL3 be a potentially 46.
(60) useful strain for industrial application.. Keywords: phenol degradation, phenol hydroxylase, catechol-1,2-dioxygenase, catechol, cis, cis-muconic acid. 47.
數據

+7
相關文件
Performance metrics, such as memory access time and communication latency, provide the basis for modeling the machine and thence for quantitative analysis of application performance..
The algorithm consists of merging pairs of 1-item sequences to form sorted sequences of length 2, merging pairs of sequences of length 2 to form sorted sequences of length 4, and so
For a 4-connected plane triangulation G with at least four exterior vertices, the size of the grid can be reduced to (n/2 − 1) × (n/2) [13], [24], which is optimal in the sense
BLAST is still one of the most robust and efficient sequence-matching and sequence- alignment
The results revealed that (1) social context, self-perception, school engagement, and academic achievement were antecedents of dropping out; (2) students’ self-factor was a
This database includes antigen’s PDB_ID, all sites (include interaction and non-interaction) of a nine amino acid sequence of primary structure and secondary structure.. After
This essay wish to design an outline for the course "Taiwan and the Maritime Silkroad" through three planes of discussion: (1) The Amalgamation of History and Geography;
Elsewhere the difference between and this plain wave is, in virtue of equation (A13), of order of .Generally the best choice for x 1 ,x 2 are the points where V(x) has
