Experimental and theoretical investigations of rate coefficients of the reaction S ( 3 P )+
O 2 in the temperature range 298–878 K
Chih-Wei Lu, Yu-Jong Wu, Yuan-Pern Lee, R. S. Zhu, and M. C. Lin
Citation: The Journal of Chemical Physics 121, 8271 (2004); doi: 10.1063/1.1792611 View online: http://dx.doi.org/10.1063/1.1792611
View Table of Contents: http://scitation.aip.org/content/aip/journal/jcp/121/17?ver=pdfcov
Published by the AIP Publishing
Articles you may be interested in
Experimental and theoretical investigation of rate coefficients of the reaction S ( P 3 ) + OCS in the temperature range of 298 – 985 K
J. Chem. Phys. 125, 164329 (2006); 10.1063/1.2357739
Experimental and theoretical studies of rate coefficients for the reaction O ( P 3 ) + C H 3 O H at high temperatures
J. Chem. Phys. 122, 244314 (2005); 10.1063/1.1924390
Determination of the internal state distribution of the SD product from the S ( 1 D)+ D 2 reaction
J. Chem. Phys. 122, 024303 (2005); 10.1063/1.1827598
Isomers of OCS 2 : IR absorption spectra of OSCS and O(CS 2 ) in solid Ar
J. Chem. Phys. 121, 12371 (2004); 10.1063/1.1822919
Rate coefficients for the reactions of Si ( 3 P J ) with C 2 H 2 and C 2 H 4 : Experimental results down to 15 K
J. Chem. Phys. 115, 6495 (2001); 10.1063/1.1396855
Experimental and theoretical investigations of rate coefficients
of the reaction S
„
3P
…¿
O
2in the temperature range 298–878 K
Chih-Wei Lu and Yu-Jong Wu
Department of Chemistry, National Tsing Hua University, Hsinchu 30013, Taiwan
Yuan-Pern Leea)
Department of Chemistry, National Tsing Hua University, Hsinchu 30013, Taiwan and Institute of Atomic and Molecular Sciences, Academia Sinica, Taipei 10764, Taiwan
R. S. Zhu and M. C. Linb)
Department of Chemistry, Emory University, Atlanta, Georgia 30322
共Received 1 June 2004; accepted 23 July 2004兲
Rate coefficients of the reaction S⫹O2with Ar under 50 Torr in the temperature range 298 – 878 K
were determined with the laser photolysis technique. S atoms were generated by photolysis of OCS with a KrF excimer laser at 248 nm; their concentration was monitored via resonance fluorescence excited by atomic emission of S produced from microwave-discharged SO2. Our measurements show that k(298 K)⫽(1.92⫾0.29)⫻10⫺12cm3molecule⫺1s⫺1, in satisfactory agreement with
previous reports. New data determined for 505– 878 K show non-Arrhenius behavior; combining our results with data reported at high temperatures, we derive an expression k(T)⫽(9.02⫾0.27)
⫻10⫺19T2.11⫾0.15exp关(730⫾120)/T兴 cm3molecule⫺1s⫺1 for 298⭐T⭐3460 K. Theoretical
calculations at the G2M 共RCC2兲 level, using geometries optimized with the B3LYP/6-311
⫹G(3d f ) method, yield energies of transition states and products relative to those of the reactants.
Rate coefficients predicted with multichannel RRKM calculations agree satisfactorily with experimental observations; the reaction channel via SOO(1A
⬘
) dominates at T⬍500 K, whereas channels involving formation of SOO(3A⬙
) followed by isomerization to SO2 before dissociation,and formation of SOO(1A
⬙
) followed by direct dissociation, become important at high temperatures, accounting for the observed rapid increase in rate coefficient. © 2004 AmericanInstitute of Physics. 关DOI: 10.1063/1.1792611兴
I. INTRODUCTION
The reaction of S(3P) with O2 is important in
combus-tion chemistry; it plays an important role in the SOxemission
during combustion of fuels containing sulfur compounds. Table I summarizes rate coefficients reported for this re action. The rate coefficient for this reaction near room temperature has been extensively investigated and values are reported in the range (1.5– 2.8)⫻10⫺12cm3 molecule⫺1s⫺1.1–7The temperature dependence of the rate coefficient below 423 K was reported to be small, with Ea/R
values of 0⫾50 K 共Ref. 3兲 or ⫺共153⫾108兲 K.6 Measure-ments of rate coefficients at high temperatures (T⭓675 K) have large discrepancies. Although the activation energy re-ported by Homann, Krome, and Wagner8 (Ea/R⫽2820 K)
is similar to that (Ea/R⫽3110 K) reported by Woiki
and Roth,9 the preexponential factors A vary more than fourfold. Saito et al.10 reported a value k⫽(6.3⫾1.2)
⫻10⫺12cm3molecule⫺1s⫺1 for temperatures between 1900
and 2200 K, about 0.4 times that reported by Woiki and Roth in this temperature range.9 Matsui and co-workers7,11
re-ported Ea/R⫽1840⫾300 K for temperatures between 980 and 1610 K, much smaller than that reported by Woiki and Roth,9 but rate coefficients determined in both works are within experimental uncertainties in the overlapping tem-perature range 1138 –1610 K. No experimental data exist for temperatures between 423 and 980 K except much smaller, and likely erroneous, values reported by Homann, Krome, and Wagner for T⭓675 K.8
The reaction might proceed via various channels: S共3P兲⫹O2→SO⫹O共3P兲 ⌬H0⫽⫺5.5 kcal mol⫺1,
共1a兲 ——→
M
SOO ⌬H0⬵⫺21 kcal mol⫺1, 共1b兲
——→ M
SO2 ⌬H0⫽⫺136 kcal mol⫺1.
共1c兲
Formation of O atoms was observed near 300 K共Ref. 3兲 and at high temperatures.9,10Miyoshi et al.7reported the yield of O atom to be 1.05⫾0.14 at 1566 K and 924 Torr, 1.06⫾0.11 at 293 K and 2.02 Torr, and 1.04⫾0.12 at 293 K and 50.2 Torr 共all with Ar buffer gas兲, indicating that reactions 共1b兲 and共1c兲 are unimportant.
The reaction of S(3P) with O2is expected to proceed via
multiple potential-energy surfaces 共PES兲. Based on an
ob-a兲Author to whom correspondence should be addressed. Electronic mail:
b兲Author to whom correspondence should be addressed. Also at Center
for Interdisciplinary Molecular Science, Chiao Tung University, Hsinchu, Taiwan. Electronic mail: [email protected]
8271
0021-9606/2004/121(17)/8271/8/$22.00 © 2004 American Institute of Physics
served small rate coefficient, Fair et al. proposed that reac-tion 共1兲 proceeds via SOO, which subsequently decomposes to SO⫹O;2the end-on attack to form SOO leads to an effec-tive cross section for collisions much smaller than that asso-ciated with the side-on attack, hence a smaller rate coeffi-cient. The existence of intermediate SOO is supported by its infrared absorption spectrum recorded after photolysis with laser radiation at 193 nm of an Ar matrix sample containing SO2.12 Craven and Murrell performed quasiclassical
trajec-tory 共QCT兲 calculations and predicted a rate coefficient of (1.67⫾0.17)⫻10⫺12cm3molecule⫺1s⫺1 for reaction 共1兲 at 298 K, in satisfactory agreement with experiment.13,14All trajectories show a common mechanism in which an initial SOO intermediate is formed, followed by rapid isomeriza-tion to OSO, which subsequently dissociates to O⫹SO. Lendvay, Shatz, and Harding performed a similar study with a many-body expansion 共MBE兲 PES calibrated with exten-sive ab initio calculations.15 Rodrigues and Varandas16 per-formed QCT calculations with an accurate single-value double many-body expansion共DMBE兲 PES of SO2共Ref. 17兲
and obtained rate coefficients of reaction 共1兲 and its reverse reaction in the temperature range 50–3500 K; the rate coef-ficient predicted at 300 K, (6.21⫾0.08)⫻10⫺12cm3
molecule⫺1s⫺1, is about two to four times that determined experimentally. They indicate that nearly all trajectories evolve via intermediate SOO, and only about one quarter of the trajectories are associated with a long-lived SO2 isomer having a lifetime⬃1.5 ps.
We have performed careful experimental work on the reaction of S⫹O2 under 50 Torr of Ar and extended rate
measurements from 298 to 878 K to bridge between the re-gion T⭐423 K with a nearly temperature-independent rate coefficient and the region T⭓980 K in which rate coeffi-cients show an activation energy corresponding to Ea/R ⫽1840– 3110 K. We also performed detailed theoretical
cal-culations to predict rate coefficients and to identify important channels in this reaction at various temperatures.
II. EXPERIMENTS
The experimental setup was described in detail previously;18,19only a brief description is given. The reaction vessel is a six-way tubular quartz cross 共diameter 40 mm兲 with one axis having sidearms ⬇15 cm in length and with Brewster windows for laser photolysis. The temperature of the reactor was regulated through resistive heating with a temperature controller共Omega CN 9000兲. S atoms were pro-duced by photolysis of OCS with radiation from a pulsed KrF excimer laser at 248 nm 共24–60 mJ cm⫺2, 1–3 Hz兲. Excessive Ar gas was added to the system to ensure that most S(1D) is quenched before reaction.20S atoms were ex-cited with emission of S(3S兲–S(3P2,1,0) at 180.73, 182.03,
and 182.62 nm, respectively, from a microwave-discharge lamp with a flowing gas mixture of SO2⬃0.10% in He. An
S1-UV lens共focal length f ⫽5 cm) served to collect light of wavelength⬎170 nm and to discriminate against emission of shorter wavelength.
The fluorescence was collected perpendicular to both photolysis laser and probe beams with a MgF2 lens ( f
⫽5 cm) before being detected with a solar-blind
photomul-tiplicr tube 共EMR 541G-09兲. The signal was converted to voltage with a low-noise amplifier 共Stanford Research Sys-tems, SR570兲 before being transferred to a digital oscillo-scope 共Tektronix, TDS-620B, 2.5 GS s⫺1 with 500 MHz band width兲. The signal was typically averaged over more than 500 laser pulses. The temporal profiles of S atoms were transferred to a computer for further processing.
He 共99.9995%兲, Ar 共99.9995%兲, and O2 共99.999%, all
AGA Specialty Gases兲 were used without further purifica-tion. OCS共99.98%, Matheson兲 was purified through
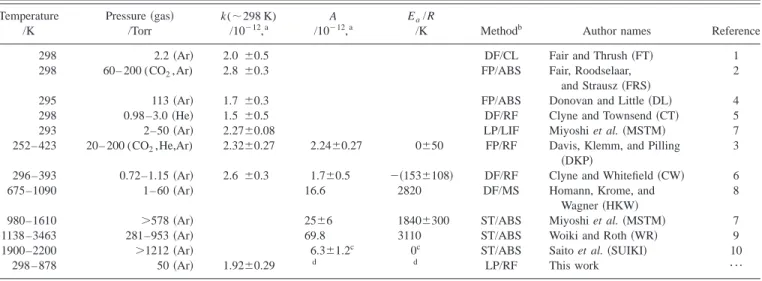
trap-to-TABLE I. Summary of reported experimental rate coefficients using various methods. Temperature /K Pressure共gas兲 /Torr k(⬃298 K) /10⫺12,a A /10⫺12,a Ea/R
/K Methodb Author names Reference
298 2.2共Ar兲 2.0 ⫾0.5 DF/CL Fair and Thrush共FT兲 1
298 60– 200 (CO2,Ar) 2.8 ⫾0.3 FP/ABS Fair, Roodselaar,
and Strausz共FRS兲
2
295 113共Ar兲 1.7 ⫾0.3 FP/ABS Donovan and Little共DL兲 4
298 0.98 –3.0共He兲 1.5 ⫾0.5 DF/RF Clyne and Townsend共CT兲 5
293 2–50共Ar兲 2.27⫾0.08 LP/LIF Miyoshi et al.共MSTM兲 7
252– 423 20– 200 (CO2,He,Ar) 2.32⫾0.27 2.24⫾0.27 0⫾50 FP/RF Davis, Klemm, and Pilling
共DKP兲
3
296 –393 0.72–1.15共Ar兲 2.6 ⫾0.3 1.7⫾0.5 ⫺共153⫾108兲 DF/RF Clyne and Whitefield共CW兲 6
675–1090 1– 60共Ar兲 16.6 2820 DF/MS Homann, Krome, and
Wagner共HKW兲
8
980–1610 ⬎578 共Ar兲 25⫾6 1840⫾300 ST/ABS Miyoshi et al.共MSTM兲 7
1138 –3463 281–953共Ar兲 69.8 3110 ST/ABS Woiki and Roth共WR兲 9
1900–2200 ⬎1212 共Ar兲 6.3⫾1.2c 0c ST/ABS Saito et al.共SUIKI兲 10
298 – 878 50共Ar兲 1.92⫾0.29 d d LP/RF This work ¯
a
In units of cm3molecule⫺1s⫺1.
bDF—discharge flow; FP—flash photolysis; LP—laser photolysis; ST—shock tube; CL—chemiluminescence; ABS—absorption; RF—resonance
fluores-cence; LIF—laser-induced fluorescence.
ck(T)⫽1.2⫻10⫺13T0.52cm3molecule⫺1s⫺1for all data reported in the range 250–2200 K. d
k(T)⫽(9.02⫾0.27)⫻10⫺19T2.11⫾0.15exp关(730⫾120)/T兴 cm3molecule⫺1s⫺1for temperature range 298 –3460 K.
8272 J. Chem. Phys., Vol. 121, No. 17, 1 November 2004 Luet al.
trap distillation. A 20% mixture of OCS in Ar was prepared with standard gas handling techniques. Flow rates of He, Ar, O2, and the OCS/Ar mixture were monitored with mass
flowmeters 共Tylan FM360兲 that were calibrated with a wet testmeter and by the pressure increase in a calibrated volume before and after experiments.
Typical experimental conditions were as follows: to-tal flow rate FT⫽7 – 11 STP cm3s⫺1 共STP⫽1 atm and
273 K兲, total pressure P⬵50 Torr, reaction temperature T
⫽298– 878 K, 关OCS兴⫽(1.50– 37.5)⫻1014molecule cm⫺3,
关S兴⫽(1.4– 33.4)⫻1011molecule cm⫺3, 关O
2兴⫽(1.0– 35.7)
⫻1014molecule cm⫺3, 关Ar兴⫽(5.5– 16.5)⫻1017molecule
cm⫺3, probed intervals of decay⫽20 s–20 ms, and mean flow spcedv⫽5.9– 24.2 cm s⫺1.
III. COMPUTATIONAL METHODS
The geometries of reactants, intermediates, transition states, and products of the title reaction were optimized at the B3LYP/6-311⫹G(3d f ) level of theory with Becke’s three-parameter nonlocal exchange functional21 and the nonlocal correlation functional of Lee, Yang, and Parr.22 Energies of all species were calculated at the G2M共RCC2兲 level of theory23using geometries optimized with the B3LYP/6-311
⫹G(3d f ) method. Intrinsic reaction coordinate
cal-culations24 were performed to connect each transition state with designated reactants and products. All calculations were carried out with GAUSSIAN98 共Ref. 25兲 and MOLPRO 2002 programs.26
Rate coefficients for various reaction channels were cal-culated with a microcanonical variational RRKM method us-ing the Variflex program.27The component rates were evalu-ated at E, J-resolved levels. The master equation was solved with an inversion approach for association and an eigenvalue-based approach for dissociation.28,29For the bar-rierless transition state, we used a Morse potential
E共R兲⫽De关1⫺e⫺共R⫺Re兲兴2, 共2兲
in which Deis the dissociation energy (D0) plus zero-point
energy, Reis the equilibrium bond distance, and  is fitted
from calculated potential energies at discrete atomic separa-tions R, to represent the potential energy in a stretching mode along the minimum energy path of each individual reaction coordinate. In addition, a Lennard-Jones pairwise potential and an anisotropic potential共a form for potential anisotropy assuming a bonding potential that is cylindrically symmetric with respect to each fragment兲 are combined to form the final potential for calculation of the variational rate coefficient with the Variflex code. For tight transition states, numbers of states were calculated with the rigid-rotor harmonic-oscillator approximation.
IV. RESULTS AND DISCUSSION A. Experimental rate coefficient
All experiments were carried out under pseudo-first-order conditions with关O2兴/关S兴 greater than 200. The initial
concentration of S,关S兴0, was estimated from the absorption
cross section (2.36⫻10⫺20cm2) of OCS and quantum yield
⌽(S)⫽0.72⫾0.08 at 248 nm,30and the fluence of the
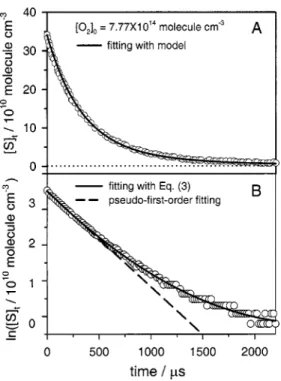
pho-tolysis laser. Figure 1共a兲 shows a typical temporal profile of
关S兴 observed when a flowing gas mixture containing OCS,
O2, and Ar was irradiated at 248 nm; a semilogarithmic plot
is shown in Fig. 1共b兲. The relative concentration of S atoms,
关S兴t, follows an exponential decay in the initial stage. The
apparent pseudo-first-order rate coefficient k1 may be
de-rived with the equation
ln共关S兴t/关S兴0兲⫽⫺k1t⫹at2⫺bt3, 共3兲
in which t is the reaction time and a and b are fitting param-eters to account for secondary reactions. To derive accurate rate coefficients, we employed a model consisting of the fol-lowing reactions:
S⫹O2→SO⫹O 共1a兲
——→ M SOO, 共1b兲 SOO——→ M S⫹O2 共4a兲 ——→ M SO⫹O, 共4b兲 S⫹OCS→S2⫹CO, 共5兲 O⫹SO→S⫹O2 共6a兲 ——→ M SO2, 共6b兲
FIG. 1. 共A兲 Temporal profiles of 关S兴t observed after photolysis of an Ar sample containing OCS and O2. T⫽878 K, 关O2兴⫽7.77 ⫻1014molecule cm⫺3, 关OCS兴⫽3.83⫻1014molecule cm⫺3, and 关Ar兴 ⫽5.53⫻1017molecule cm⫺3. The solid line represents fitted results
accord-ing to a model described in the text.共B兲 Semilogarithmic plot of 共A兲. The solid line represents fitted results according to Eq.共3兲 and the dashed line represents initial pseudo-first-order decay.
O⫹OCS→S⫹CO2 共7a兲 →SO⫹CO, 共7b兲 O⫹O2——→ M O3, 共8兲 SO⫹SO→S⫹SO2, 共9兲 SO⫹O2→O⫹SO2, 共10兲 S⫹SO2→SO⫹SO, 共11兲 O⫹S2→SO⫹S, 共12兲
for which rate coefficients have these reported dependences on temperature: k1b共T兲⫽1.09⫻10⫺25T⫺2.6 ⫻exp共⫺276/T兲 cm6molecule⫺2s⫺1, 共13兲 k4a共T兲⫽0.12T⫺2.19 ⫻exp共⫺10630/T兲 cm3molecule⫺1s⫺1, 共14兲 k4b共T兲⫽7.02⫻10⫺4T⫺1.72 ⫻exp共⫺10803/T兲 cm3molecule⫺1s⫺1, 共15兲 k5共T兲⫽3.16⫻10⫺19T2.35 ⫻exp共⫺1253/T兲 cm3molecule⫺1s⫺1 共16兲 k6a共T兲⫽3.76⫻10⫺18T1.79 ⫻exp共⫺2230/T兲 cm3molecule⫺1s⫺1 共17兲 k6b共T兲⫽4.82⫻10⫺31共T/298兲⫺2.17 cm6molecule⫺2s⫺1 共18兲 k7a共T兲⫽6.61⫻10⫺11exp共⫺2706/T兲 ⫻共0.4⫺202/T兲 cm3molecule⫺1s⫺1 共Ref. 31兲 共19兲 k7b共T兲⫽6.61⫻10⫺11exp共⫺2706/T兲 ⫻共0.6⫹202/T兲 cm3molecule⫺1s⫺1 共Ref. 31兲 共20兲 k8共T兲⫽2.16⫻10⫺27T⫺2.7 cm6molecule⫺2s⫺1 共Ref. 32兲 共21兲 k9共T兲⫽1.0⫻10⫺12
⫻exp共⫺1720/T兲 cm3molecule⫺1s⫺1 共Ref. 33兲
共22兲
k10共T兲⫽1.7⫻10⫺12
⫻exp共⫺4089/T兲 cm3molecule⫺1s⫺1 共Ref. 34兲
共23兲
k11共T兲⫽1.86⫻10⫺40
⫻exp共⫺4829/T兲 cm3molecule⫺1s⫺1 共Ref. 35兲
共24兲
k12共T兲⫽2.2⫻10⫺11
⫻exp共⫺84/T兲 cm3molecule⫺1s⫺1 共Ref. 14兲
共25兲
in which k1b, k4a, and k4bare calculated results discussed in
the following section, k5 is derived on fitting data at high
temperatures (860⭐T⭐1680 K) 共Ref. 36兲 and low tempera-tures (233⭐T⭐445 K) 共Ref. 37兲 to the equation, k6ais de-rived on fitting data at high temperatures (2212⭐T
⭐3385 K) 共Ref. 38兲 and those at low temperatures (252 ⭐T⭐423 K) 共Ref. 3兲 estimated from k1aand the equilibrium
constants based on ⌬G of formation,39 and k6b is
theoreti-cally predicted in our previous work on pyrolysis of SO2;38
the latter agrees satisfactorily with the expression 9.3
⫻10⫺31(T/298)⫺1.84cm6molecule⫺2s⫺1 reported by Grillo,
Reed, and Slack.40
We modeled observed temporal profiles of关S兴t with
re-actions 共1a兲, 共1b兲, and 共4兲–共12兲 with a commercial kinetic modeling program FACSIMILE;41 rate coefficients listed in Eqs.共13兲–共25兲 were held constant and the pseudo-first-order rate coefficient of the title reaction, k1aI , was varied to yield the best fit. Summary of experimental conditions and values of k1aI for 58 measurements in a temperature range 298 – 878 K may be found in Electronic Physics Auxiliary Publication Service 共EPAPS兲; we list also kI/k1aI for comparison.42 Val-ues of kIobtained with Eq.共3兲 based on initial pseudo-first-order decays deviate from k1aI by less than 15% in most cases, indicating that secondary reactions play only a minor role under the initial experimental conditions. Detailed mod-eling shows that secondary reactions are negligible at low temperatures, whereas at high temperatures and with large
关OCS兴 and 关S兴0 the corrections become greater; only
reac-tions 共5兲, 共7a兲, and 共7b兲 account for corrections greater than 3%.
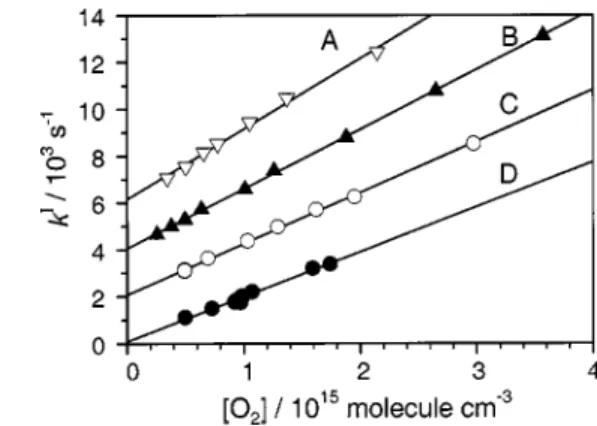
Values of k1aI determined with various concentrations of O2 at temperatures 298, 658, 726, and 878 K are plotted in
Fig. 2, with ordinates shifted vertically for each line for clar-ity; the slope of the line fitted with least squares yields the bimolecular rate coefficient k1aat each temperature. At 298
K, k1a⫽(1.92⫾0.08)⫻10⫺12cm3molecule⫺1s⫺1; unless
otherwise noted, the uncertainty represents one standard er-ror in fitting. In these experiments, rate coefficients remained
FIG. 2. Derived k1a
I as a function of关O
2兴 at various temperatures. 共A兲 878
K, symbol 䉮; 共B兲 726 K, symbol 䉱; 共C兲 658 K symbol 䊊; 共D兲 298 K symbol䊉. The ordinates are shifted for each set of data for clarity.
8274 J. Chem. Phys., Vol. 121, No. 17, 1 November 2004 Luet al.
the same while 关S兴0 was varied from 2.1⫻1011 to 3.34
⫻1012molecule cm⫺3. Combined systematic error
共measure-ments of flow rates, pressure, and temperature兲 of our system is estimated to be⬃8%, and the error in deriving k1aI and its dependence on关O2兴 is ⬃12%. Hence, we estimate an error
⬃15% for k1a and recommend a rate coefficient (1.92
⫾0.29)⫻10⫺12cm3molecule⫺1s⫺1at 298 K.
Rate coefficients k1a determined at 298, 406, 505, 658,
726, and 878 K are listed in Table II. k1aremains
approxi-mately constant from 298 to 505 K, but increases from
⬃1.8⫻10⫺12 to 3.0⫻10⫺12cm3molecule⫺1s⫺1 as the
tem-perature increases further to 878 K. In the temtem-perature range 298 –505 K, rate coefficients show a small negative tempera-ture dependence with Ea/R⫽⫺(65⫾40) K. Reported rate
coefficients are compared in Table I and Fig. 3; lines of vari-ous types are drawn for only the range of temperature inves-tigated. The value of k1aat 298 K determined in this work is
within experimental uncertainties of previous reports by Fair and Thrush 共designated FT in Fig. 3兲,1 Donovan and Little
共DL兲,4Clyne and Townsend共CT兲,5Miyoshi et al.共MSTM兲,7
and Davis, Klemm, and Pilling 共DKP兲,3 but is slightly smaller than values of (2.6⫾0.3)⫻10⫺12cm3 molecule⫺1s⫺1 by Clyne and Whitefield 共CW兲6 and (2.8
⫾0.3)⫻10⫺12cm3molecule⫺1s⫺1 by Fair, Roodselaar, and
Strausz 共FRS兲.2 The small negative activation energy of
Ea/R⫽⫺(65⫾40) K is consistent also with two previous
reports of Ea/R⫽⫺(153⫾108) K by CW
6
and 0⫾50 K by DKP,3even though their rate coefficients are slightly greater
than ours. Rate coefficients at 505– 878 K are new; they match well with rate coefficients reported for T⭓980 K by MSTM 共Ref. 7兲 and WR,9 as illustrated in Fig. 3.
Fitting our results yields an expression for the rate coef-ficient in the range 298⭐T⭐878 K:
k1a共T兲⫽共8.60⫾0.34兲⫻10⫺20T2.40⫾0.24
⫻exp关共960⫾120兲/T兴 cm3molecule⫺1s⫺1.
共26兲
When combined with data at high temperatures by MSTM and WR, a general expression
k1a共T兲⫽共9.02⫾0.27兲⫻10⫺19T2.11⫾0.15
⫻exp关共730⫾120兲/T兴 cm3molecule⫺1s⫺1
共27兲
is derived for 298⭐T⭐3460 K. This equation reproduces reported rate coefficients by MSTM, WR, and our work to within 30% except a few data points.
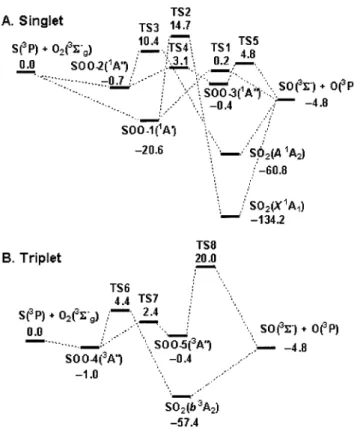
B. Potential-energy surfaces and reaction mechanism Our calculations show that several triplet and singlet in-termediates and transition states are involved in the reaction S(3P)⫹O
2(X3⌺g⫺) to produce SO(X3⌺⫺)⫹O(3P).
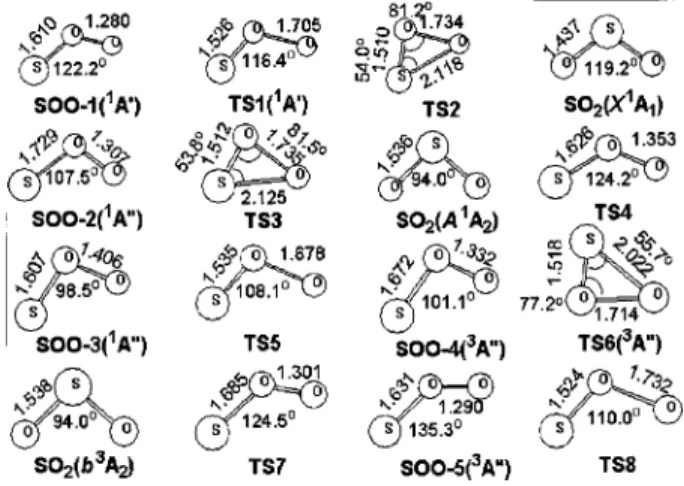
Opti-mized geometries of the intermediates and transition states involved in the reaction are shown in Fig. 4. The energy diagrams for singlet and triplet surfaces calculated with the G2M共RCC2)//B3LYP/6-311⫹G(3d f ) method are pre-sented in Fig. 5. Predicted vibrational wave numbers and rotational constants as well as available experimental data43– 47for the species involved are discussed and summa-rized in Table 4 of Ref. 38. The results indicate that the predicted vibrational wave numbers are underestimated by 0.2%–2.3% from experimental values.
The predicted enthalpy of reaction,⫺4.8 kcal mol⫺1, for reaction 共1a兲 is near the value obtained from JANAF Ther-malchemical Tables, ⫺5.5 kcal mol⫺1.39Figure 5 shows that S(3P)⫹O2(X3⌺g⫺) might proceed via singlet and triplet
SOO intermediates. The singlet channels involve two
sur-FIG. 3. Arrhenius plots of k1afor the reaction S⫹O2→O⫹SO. Our data are
shown as symbols 䉱 with a fitted equation shown as a thick solid line. Previous results on temperature dependence are shown as lines of various types drawn for the temperature range of study. A combination of first char-acters of each authors last name is used to indicate previous reports, as listed in Table I.
FIG. 4. Optimized geometries of transition states and intermediates of the S⫹O2system at the B3LYP/6-311⫹G(3d f ) level, with bond lengths in Å
and bond angles in degree. Small and large solid spheres in the structures represent O and S atoms, respectively.
TABLE II. Bimolecular rate coefficients k1aat various temperatures.
Temp /K P /Torr 关S兴 /1011,a /10关O142兴,a /10关Ar兴17,a k1a /10⫺12,b 298 51 2.12–33.4 4.96 –17.4 16.5 1.92⫾0.29 406 51 7.65 2.24 –12.3 12.0 1.74⫾0.26 505 50 7.72 1.01– 4.43 9.6 1.77⫾0.27 658 51 5.37–14.7 4.91–29.7 7.4 2.19⫾0.33 726 51 4.27 2.57–35.7 6.7 2.55⫾0.38 878 50 3.41–11.13 3.45–21.5 5.5 3.01⫾0.45 aIn units of molecule cm⫺3. bIn units of cm3molecule⫺1s⫺1.
faces, 1A
⬘
and1A⬙
. The 1A⬘
intermediate共SOO-1兲 is more stable than those of 1A⬙
共SOO-2 and SOO-3兲 and has nobarrier for formation from S(3P)⫹O2(X3⌺g⫺). The
pre-dicted energy of SOO-1, 113.6 kcal mol⫺1 above SO2(X1A1), is similar to a value of 117 kcal mol⫺1
pre-dicted by Kellogg and Schaefer,48but greater than a value of 105 kcal mol⫺1 predicted by Dunning and Raffenetti49 who employed a two-reference CI method with generalized valence-bond 共GVB兲 natural orbitals. SOO-1 can directly dissociate to SO⫹O via TS1 lying only about 0.2 kcal mol⫺1 above S(3P)⫹O2(X3⌺g⫺). This channel is hence the most
important path at low temperature. Otherwise, SOO-1 can isomerize to SO2(X1A
1) via TS2 with a large barrier, 14.7
kcal mol⫺1 above the reactants; this process is kinetically unimportant for the formation of SO⫹O. The second singlet channel proceeds via SOO-2(1A
⬙
) and SOO-3(1A⬙
) to form SO⫹O. TS4 connects SOO-2(1A⬙
) and SOO-3(1A⬙
), and TS5 corresponds to dissociation of SOO-3(1A⬙
) to the prod-ucts. Transition states TS4 and TS5 lie 3.1 and 4.8 kcal mol⫺1, respectively, above S⫹O2. In addition, SOO-2can isomerize to SO2(A1A2) via TS3 with a barrier of 10.4
kcal mol⫺1 above the reactants, followed by dissociation to products.
The triplet channel proceeds via SOO-4(3A
⬙
) without a barrier, followed by formation of SO2(b3A2) andSOO-5(3A
⬙
) via TS6 and TS7 with barriers of 5.4 and 3.4 kcal mol⫺1, respectively. SO2(b3A2) directly dissociates toSO⫹O with an endothermicity of 52.6 kcal mol⫺1 and SOO-5(3A
⬙
) dissociates to SO⫹O via TS8 at 20.0 kcal mol⫺1 above S(3P)⫹O2(X3⌺g⫺). The above singletchannel via TS4 and TS5 and the triplet channel via TS6 are expected to be insignificant at low temperatures, but become important at high temperatures.
The quintuplet surface is also investigated in this work, but no stable intermediates are found. One direct abstraction channel with a linear transition state is located; it lies 54.4 kcal mol⫺1above the reactants S⫹O2. Hence, the
contribu-tion of quintuplet surfaces to produccontribu-tion of SO⫹O is negli-gible even at high temperature.
Calculations based on variational transition-state and RRKM theories were carried out with the Variflex code27for the overall reaction
S⫹O2→SO⫹O 共1a兲
via three possible channels to yield rate coefficients
k1a-1共T兲⫽6.78⫻10⫺14T0.53 ⫻exp共⫺15/T兲 cm3molecule⫺1s⫺1, 共28兲 k1a-2共T兲⫽1.07⫻10⫺14T0.96 ⫻exp共⫺1980/T兲 cm3molecule⫺1s⫺1, 共29兲 k1a-3共T兲⫽8.69⫻10⫺15T0.89 ⫻exp共⫺2240/T兲 cm3molecule⫺1s⫺1. 共30兲
Channel 1 proceeds via SOO-1(1A
⬘
) and TS1 that has the smallest barrier relative to S⫹O2. Channel 2 involvesSOO-4(3A
⬙
) and TS6 on the triplet surface, with an energy of 4.4 kcal mol⫺1, whereas channel 3 proceeding via SOO-2(1A⬙
), TS4, SOO-3(1A⬙
), and TS5; TS5 has thegreatest energy共4.8 kcal mol⫺1兲 among these three channels. The predicted total rate coefficients are expressed as
k1a共T兲⫽1.29⫻10⫺17T1.78
⫻exp共430/T兲 cm3molecule⫺1s⫺1. 共31兲
In the above calculations, the association from S⫹O2 to
the potential minimum SOO-1(1A
⬘
) was calculated on in-creasing the S-O bond distance from its equilibrium value of 1.610 to 3.740 Å at intervals of 0.1 Å with the B3LYP/6-311⫹G(3d f ) method; the calculated energies were fitted to a Morse equation关Eq. 共2兲兴 to evaluate⫽4.06 Å⫺1. For the associations from S⫹O2to SOO-2(1A⬙
) and toSOO-4(3A
⬙
), because the wells are shallow,⫺0.7 and ⫺1.0 kcal mol⫺1, the rate coefficients for channels 2 and 3 are controlled by tight transition states TS4 and TS6, respec-tively; furthermore, because structures of SOO-1(1A⬘
), SOO-2(1A⬙
), and SOO-4(3A⬙
) are similar, the same value of 共4.06 Å⫺1兲 was used for the association processes. Dis-sociation energics predicted at the G2M level are used in calculations of the rate coefficient for association. The Lennard-Jones 共LJ兲 parameters required for the RRKM cal-culations are the same as those used for the reaction O⫹SO previously.38 The exponential-down model with ␣⫽1500 cm⫺1 is employed for collisional deactivation. Because the electronic ground state of the S atom is split into three 共quin-tuplet, triplet, and singlet兲 degenerate levels separated by 396.1 and 573.6 cm⫺1, the electronic partition function of these low-lying excited states are also taken into account in calculations of the rate constant.FIG. 5. Potential-energy diagrams for the S⫹O2reaction based on energies
calculated at the G2M共RCC2)//B3LYP/6-311⫹G(3d f ) level: 共A兲 singlet system and共B兲 triplet system. Energies are listed in kcal mol⫺1.
8276 J. Chem. Phys., Vol. 121, No. 17, 1 November 2004 Luet al.
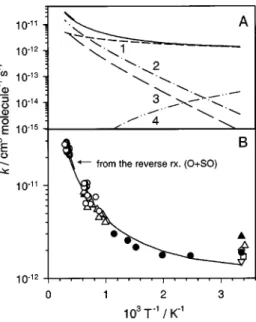
Rate coefficients for each channel and the total rate co-efficient, Eq. 共31兲, for the title reaction are plotted in Fig. 6共a兲; the total rate coefficient is compared with experimental results on an expanded scale in Fig. 6共b兲. Channel 1 is clearly the only available path at temperatures below 500 K, whereas channels 2 and 3 become important at higher tem-peratures, resulting in a more rapid increase of the rate coef-ficient at high temperatures. The total rate coefcoef-ficient agrees satisfactorily with experimental results in this work, and also with those at high temperatures reported by Miyoshi et al.7 and by Woiki and Roth.9In our previous experiments using a diaphragmless shock tube to investigate pyrolysis of SO2,38
we observed formation of S atoms from the secondary reac-tion,
O⫹SO→S⫹O2, 共6a兲
and determined a rate coefficient for the temperature range 2212–3385 K
k6a共T兲⫽共3.0⫾0.3兲⫻10⫺11
⫻exp关⫺共6980⫾280兲/T兴 cm3molecule⫺1s⫺1.
共32兲
Combining with the equilibrium constant derived from litera-ture values of ⌬G(T) for the corresponding species,39 we derive the rate expression for the title reaction in the tem-perature range 2212–3385 K to be
k1a共T兲⫽共1.1⫾0.3兲⫻10⫺11
⫻exp关⫺共4360⫾220兲/T兴 cm3molecule⫺1s⫺1.
共33兲
The results are consistent with previous experimental results by Woiki and Roth,9 and our theoretical predictions de-scribed above, as compared in Fig. 6.
The formation of SO2 via channel 2 is negligibly small.
SOO might be produced at high pressure and low tempera-ture via channel 1 关Reaction 共1b兲兴; subsequent decomposi-tion might produce S⫹O2 and SO⫹O:
SOO-1共1A
⬘
兲 ——→ M S⫹O2, 共4a兲 ——→ M SO⫹O. 共4b兲Rate coefficients for reactions 共1b兲, 共4a兲, and 共4b兲 are pre-dicted, as listed in Eqs.共13兲–共15兲; they are negligibly small at 50 Torr and 298 K.
It must be mentioned that the predicted rate coefficients at low temperatures are sensitive to pressure and the energy of TS1. Our results show that, at 298 K, increasing the pres-sure to 700 Torr and decreasing the exit barrier of TS1 by 0.2 kcal mol⫺1 can well reproduce the experimental value; a negative temperature-dependent effect on the rate coefficient
k1a in the low temperature range, 200–298 K, is also ob-tained, which is attributed to combined effects of the barri-erless association reaction 共1b兲 and the decomposition reac-tion 共4b兲.
V. CONCLUSION
Rate coefficients for the reaction of S with O2 to form O
and SO in the temperature range 298 – 878 K are determined using laser photolysis for production of S atoms and reso-nance fluorescence for detection of S atoms. Our result at 298 K, k1a⫽(1.92⫾0.29)⫻10⫺12cm3molecule⫺1s⫺1, is
consistent with previous measurements, and new data in the range 505– 878 K fill the gap between reported rate coeffi-cients for T⭐423 K and T⭓980 K. From combined avail-able data, rate coefficients fit well with the equation
k1a(T)⫽(9.02⫾0.27)⫻10⫺19T2.11⫾0.15exp关 (730⫾120) / T兴 cm3molecule⫺1s⫺1for temperatures in the range 298 –3460 K; listed uncertainties represent one standard error in fitting. Theoretical calculations based on PES computed at the G2M共RCC2)//B3LYP/6-311⫹(3d f ) level indicate that the reaction proceeds to form SOO having various conforma-tions; the reaction path via SOO(1A
⬘
) to form SO⫹O domi-nates at T⭐500 K, but two additional paths, one via SOO(3A⬙
) then SO2and one via SOO(1A⬘
), becomeimpor-tant at high temperatures. Predicted total rate coefficients agree with experiments throughout the temperature range un-der investigation. Predicted and reported experimental rate coefficients at high temperatures also agree satisfactorily with those calculated based on the reverse reaction O⫹SO and equilibrium constants.
ACKNOWLEDGMENTS
Y.P.L. thanks the National Science Council of Taiwan
共Grant No. NSC92-2113-M-007-034兲 and the MOE Program
for Promoting Academic Excellence of Universities 共Grant No. 89-FA04-AA兲 for support. R.S.Z. thanks the Office of Naval Research, U.S. Navy 共Contract No.
N00014-89-FIG. 6. 共A兲 Theoretically predicted rate coefficients for the reaction S
⫹O2→O⫹SO. Channel 1—via SOO-1(
1
A⬘) and TS1; channel 2—via SOO-4(3A⬙), TS6, and SO
2(b3A2); channel 3—via SOO-2(1A⬙), TS3,
SOO-3(1A⬙), and TS4; channel 4—rate of association of SOO(1A⬘); solid
line—total rate coefficient.共B兲 Comparison of predicted total rate coeffi-cient k1a共solid line兲 with experimental data 共䊉—this work; 䊊—Woiki and
Roth共Ref. 9兲; 䉭—Miyoshi et al. 共Ref. 7兲; 〫—Fair and Thrush 共Ref. 1兲; 䉱: Fair, Roodselaar, and Strausz共Ref. 2兲; 䉮—Clyne and Townsend 共Ref. 5兲;
䊐—Donovan and Little 共Ref. 4兲.
J1949兲 for support. M.C.L. acknowledges support from the National Science Council of Taiwan for a distinguished vis-iting professorship.
1
R. W. Fair and B. A. Thrush, Trans. Faraday Soc. 65, 1557共1969兲.
2R. W. Fair, A. van Roodselaar, and O. P. Strausz, Can. J. Chem. 49, 1659
共1971兲.
3D. D. Davis, R. B. Klemm, and M. Pilling, Int. J. Chem. Kinet. 4, 367
共1972兲.
4R. J. Donovan and D. J. Little, Chem. Phys. Lett. 13, 488共1972兲. 5M. A. A. Clyne and L. W. Townsend, Int. J. Chem. Kinet. 1, 73共1976兲. 6M. A. A. Clyne and P. D. Whitefield, J. Chem. Soc., Faraday Trans. 2 75,
1327共1979兲.
7
A. Miyoshi, H. Shiina, K. Tsuchiya, and H. Matsui, Symp. Int. Combust. Proc. 26, 535共1996兲.
8K. H. Homann, G. Krome, and H. Gg. Wagner, Ber. Bunsenges. Phys.
Chem. 72, 998共1968兲.
9
D. Woiki and P. Roth, Int. J. Chem. Kinet. 27, 59共1995兲.
10K. Saito, Y. Ueda, R. Ito, T. Kakumoto, and A. Imamura, Int. J. Chem.
Kinet. 18, 871共1986兲.
11K. Tsuchiya, K. Kamiya, and H. Matsui, Int. J. Chem. Kinet. 29, 57
共1997兲.
12
L.-S. Chen, C.-I. Lee, and Y.-P. Lee, J. Chem. Phys. 105, 9454共1996兲.
13J. N. Murrell, W. Craven, and S. C. Farantos, Mol. Phys. 49, 1077共1983兲. 14W. Craven and J. N. Murrell, J. Chem. Soc., Faraday Trans. 2 83, 1733
共1987兲.
15
G. Lendvay, G. C. Shatz, and L. B. Harding, Faraday Discuss. 102, 389 共1995兲.
16S. P. J. Rodrigues and A. J. C. Varandas, J. Phys. Chem. A 107, 5369
共2003兲.
17A. J. C. Varandas and S. P. J. Rodrigues, Spectrochim. Acta, Part A 58,
629共2002兲.
18E. W.-G. Diau and Y.-P. Lee, J. Chem. Phys. 96, 377共1992兲. 19L.-H. Lai, Y.-C. Hsu, and Y.-P. Lee, J. Chem. Phys. 97, 3092共1992兲. 20G. Blake and L. E. Jusinski, J. Chem. Phys. 82, 789共1985兲. 21
A. D. Becke, J. Chem. Phys. 98, 5648共1993兲; ibid. 96, 2155 共1992兲; ibid.
97, 9173共1992兲.
22C. Lee, W. Yang, and R. G. Parr, Phys. Rev. B 37, 785共1988兲. 23A. M. Mebel, K. Morokuma, and M. C. Lin, J. Chem. Phys. 103, 7414
共1995兲.
24
C. Gonzalez and H. B. Schlegel, J. Phys. Chem. 90, 2154共1989兲.
25M. J. Frisch, G. W. Trucks, H. B. Schlegel et al.,
GAUSSIAN 98, Revision A.9, Gaussian Inc., Pittsburgh, PA, 1998.
26
MOLPROis a package of ab initio programs written by H.-J. Werner and
P. J. Knowles, with contributions from J. Almlo¨f, R. D. Amos, A. Berning
et al.
27S. J. Klippenstein, A. F. Wagner, R. C. Dunbar, D. M. Wardlaw, and S. H.
Robertson,VARIFLEX: Version 1.00, 1999.
28R. G. Gilbert and S. C. Smith, Theory of Unimolecular and Recombina-tion ReacRecombina-tions共Blackwell Scientific, Carlton, Australia, 1990兲.
29K. A. Holbrook, K. J. Pilling, and S. H. Robertson, Unimolecular Reac-tions共Wiley, Chichester, U.K., 1996兲.
30R. N. Rudolph and E. C. Y. Inn, J. Geophys. Res., C: Oceans Atmos. 86,
9891共1981兲.
31N. Isshiki, Y. Murakami, K. Tsuchiya, A. Tezaki, and H. Matsui, J. Phys.
Chem. A 107, 2464共2003兲.
32H. Hippler, R. Rahn, and J. Troe, J. Chem. Phys. 93, 6560共1990兲. 33
K. Schofield, Combust. Flame 124, 137共2001兲.
34K. Tsuchiya, K. Kamiya, and H. Matsui, Int. J. Chem. Kinet. 29, 57
共1997兲.
35Y. Murakami, S. Onishi, T. Kobayashi, N. Fujii, N. Isshiki, K. Tsuchiya,
A. Tezaki, and H. Matsui, J. Phys. Chem. A 107, 10996共2003兲.
36H. Shiina, M. Oya, K. Yamashita, A. Miyoshi, and H. Matsui, J. Phys.
Chem. 100, 2136共1996兲.
37R. B. Klemm and D. D. Davis, J. Phys. Chem. 78, 1137共1974兲. 38C.-W. Lu, Y.-J. Wu, Y.-P. Lee, R. S. Zhu, and M. C. Lin, J. Phys. Chem. A
107, 11020共2003兲.
39M. W. Chase, Jr., J. Phys. Chem. Ref. Data Monogr. 9, 1共1998兲. 40A. Grillo, R. Reed, and M. W. Slack, J. Chem. Phys. 70, 1634共1979兲. 41
FACSIMILE is a computer software for modeling process and chemical-reaction kinetics released by AEA Technology, Oxfordshire, United King-dom.
42
See EPAPS Document No. E-JCPSA6-121-027438 for experimental con-ditions and values of K1a
I
. A direct link to this document may be found in the online article’s HTML reference section. The document may also be reached via the EPAPS homepage 共http://www.aip.org/pubservs/ epaps.html兲 or from ftp.aip.org in the directory /epaps/. See the EPAPS homepage for more information.
43
T. Shimanouchi, Tables of Molecular Vibrational Frequencies
Consoli-dated共National Bureau of Standards, Gaithersberg, MD, 1972兲, Vol. 1,
pp. 1–160.
44A. G. Hopkins and C. W. Brown, J. Chem. Phys. 62, 2511共1975兲. 45
C.-C. Zen, I.-C. Chen, and Y.-P. Lee, J. Phys. Chem. A 104, 771共2000兲.
46C. L. Huang, I.-C. Chen, A. J. Merer, C.-K. Ni, and A. H. Kung, J. Chem.
Phys. 114, 1187共2001兲.
47L.-S. Chen, C.-I. Lee, and Y.-P. Lee, J. Chem. Phys. 105, 9454共1996兲. 48
C. B. Kellogg and H. F. Schaefer III, J. Chem. Phys. 102, 4177共1995兲.
49T. H. Dunning and R. C. Raffenetti, J. Am. Chem. Soc. 85, 1350共1981兲.
8278 J. Chem. Phys., Vol. 121, No. 17, 1 November 2004 Luet al.