Frequency stabilization of an external cavity diode
laser to molecular iodine at 657.483 nm
Hui-Mei Fang, Shing-Chung Wang, and Jow-Tsong Shy
The saturation spectrum of the P(84) 5–5 transition of127I
2at 657.483 nm is obtained with the third-harmonic demodulation method using an external cavity diode laser. The laser frequency is modulated by modulating the diode current instead of modulating the cavity length with a piezoelectric transducer (PZT). Current modulation allows a modulation frequency that is higher than PZT modulation. The signal-to-noise ratio of 1000 is better than previous results presented in the literature. The laser is frequency stabilized to the hyperfine component o of the P(84) 5–5 transition with a frequency stability of better than 10 kHz共2.2 ⫻ 10⫺11relative stability). © 2006 Optical Society of America
OCIS codes: 020.2930, 300.6260, 300.6390, 140.2020, 300.6360, 300.6550.
1. Introduction
Molecular iodine has a broad spectrum of absorption lines from the near infrared to the dissociation limit at 499.5 nm. Its hyperfine structure (HFS) compo-nents have been studied extensively with high reso-lution and high precision. Such HFS components provide a dense spectrum of reference frequencies for frequency stabilization of lasers. Some are recom-mended as optical frequency–wavelength standards by the Consultative Committee for Length (CCL).1
The dominant optical frequency standard has been a He–Ne laser stabilized to iodine at 633 nm. Most member states of the Convention du Mètre have adopted such lasers as the national realization of the meter. A frequency uncertainty of⫾10 kHz is regu-larly achieved.1 However, the output power of a
He–Ne laser is low, and He–Ne lasers are large in size and mechanically vulnerable. Thus there is growing interest in using diode lasers for frequency stabilization. For diode lasers, their smaller size, larger tuning range, higher power, and compactness make them an attractive source for stabilization.
Frequency stabilization of the external cavity diode laser (ECDL) to the iodine HFS components using an
extra-cavity iodine cell has been extensively studied and reported at 633 nm,2–5637 nm,6,7and 657 nm.8A
portable laser frequency standard at 633 nm has been constructed by frequency stabilizing a miniatur-ized ECDL.5 Its frequency stability matches that of
iodine-stabilized He–Ne lasers at 633 nm. The best stability, 1⫻ 10⫺13, is reached at an integration time of 4000 s. The systems in Refs. 2– 8 use the tradi-tional third-harmonic locking technique. The fre-quency modulation is achieved by modulating the cavity length of the ECDL using a piezoelectric trans-ducer (PZT). This modulation scheme limits the modulation frequency to⬍10 kHz. The frequency of ECDL can also be modulated by modulating current through the diode. The current modulation allows a modulation frequency that is higher than PZT mod-ulation for an ECDL. To reduce the noise, we chose to modulate the laser frequency by modulating the di-ode current instead of the cavity length by the PZT. The reasons we chose a P(84) 5–5 transition of127I2
at 657.483 nm for our study are as follows. First, the
1S
0–3P1 intercombination line of Ca at 657.459 nm
has a linewidth that is much narrower than the HFS components of iodine. It is a useful reference for a precise optical frequency standard. Recently we have developed a novel Ca absorption cell and successfully observed its saturation absorption spectrum with a linewidth below 300 kHz.9To further investigate the
high-resolution spectroscopy of Ca, we wanted to de-velop a stable diode laser system at 657 nm as a stable light source. Second, the diode laser at 657 nm has the characteristics of lower cost and a higher power than a diode laser at 633 nm. It is an attractive alternative for red diode laser systems locked to H.-M. Fang ([email protected]) and S.-C. Wang are with
the Department of Photonics, Institute of Electro-Optical Engi-neering, National Chiao Tung University, Hsinchu 300, Taiwan. J.-T. Shy is with the Department of Physics, National Tsing Hua University, Hsinchu 300, Taiwan.
Received 18 February 2005; revised 17 June 2005; accepted 24 June 2005.
0003-6935/06/133173-04$15.00/0 © 2006 Optical Society of America
iodine. Therefore we decided to investigate the satu-ration spectrum of the hyperfine components of the
P(84) 5–5 transition of127I2at 657.483 nm共⬃17 GHz
away from the Ca transition) for frequency stabiliza-tion of our ECDL laser.
Previous works on this iodine transition are briefly reviewed here. In 1997, Kurosu and co-workers re-ported high-sensitive spectroscopy of the hyperfine components of the P(84) 5–5 transition with a signal-to-noise ratio (SNR) of 500 at a 1 s time constant by means of a power-stabilized light from a diode laser spectrometer.10The power-stabilized laser system is
a master–slave laser system whose intensity noise was reduced by feedback stabilization. Although they obtained good SNR, they did not stabilize the laser frequency to the hyperfine component. Later, Masuda and co-workers reported the first frequency stabilization of a diode laser to the hyperfine compo-nent f of the P(84) 5–5 transition.8Their
experimen-tal setup is complex in that the iodine cell is placed inside an external resonant cavity to increase the signal. However, the SNR is low 共⬃30 at a 1 s time constant) and the frequency stability is estimated to be 300 kHz.
In this paper we have obtained the third-harmonic demodulated saturation absorption signal of the hy-perfine components of the P(84) 5–5 transition with a SNR of 1000 at a 1 s time constant without using an external resonant cavity to increase the signal or without using power stabilization to reduce the in-tensity noise. Simply by using a longer iodine cell to increase the signal and higher modulation frequency by modulating the laser current to reduce the noise we can easily achieve this high SNR. We have locked the laser frequency to the hyperfine component o with a frequency stability of better than 10 kHz 共2.2 ⫻ 10⫺11relative stability). We have also determined
the linewidth of the hyperfine components of the
P(84) 5–5 transition using the dependence of the peak
amplitude of the third-derivative signal on the mod-ulation width. The measured full width at half-maximum (FWHM) of the hyperfine component
o is 7.5 MHz.
2. Experimental Setup
Our diode laser system is shown in Fig. 1. The ECDL is a commercial system from Environmental Optical Sensors, Incorporated. Its operation wavelength is at 657 nm. The ECDL is of the Littman–Metcalf de-sign11and is composed of a laser diode, a diffraction
grating, and a tuning mirror. The diode laser output is collimated and is incident on the grating at a graz-ing angle. Its first-order beam is diffracted toward the tuning mirror. The retroreflection off the mirror se-lects which wavelength is diffracted back into the diode laser. The output beam is the zero-order dif-fraction off the grating. The output power of the ECDL is 5.5 mW. The linewidth of the ECDL at free running is less than 1 MHz. Its frequency can be coarsely tuned by rotating the tuning mirror and finely tuned by applying a voltage to the PZT
at-tached to the grating or changing the injection cur-rent of the laser diode. To reduce environmental noises affecting the ECDL stability, we put it into an aluminum box and pasted soundproof material onto the box. The soundproof material is a sound-absorbing foam material containing two lead sep-tums separated by foam. To further reduce the vibration from the table, the aluminum box is placed on a layer of damping rubber.
Before investigating the iodine spectrum we first study the amplitude modulation of our ECDL in-duced by PZT modulation and current modulation. The PZT modulation has a resonance at 1 kHz. The amplitude modulation is 0.42% at 30 MHz modula-tion width for a modulamodula-tion frequency of less than 800 Hz. For current modulation the amplitude mod-ulation is 0.5% at the same modmod-ulation width. We would like to emphasize that the amplitude modula-tion under current modulamodula-tion is comparable to PZT modulation. Therefore we chose to modulate the laser frequency by current modulation.
The laser beam from the ECDL passes through a Faraday isolator (FI) to prevent the optical feedback effect, and then it is divided into two beams by a beam splitter (BS). The weaker beam is used to monitor the laser mode and wavelength in real time by a scanning Fabry–Perot interferometer and a wavemeter, re-spectively. The scanning Fabry–Perot interferometer has a free spectral range (FSR) of 1.5 GHz and a finesse of⬎200, and the wavemeter has an accuracy of 10⫺3nm. The main beam is collimated to 2 mm in diameter by a lens (L) and then passes through a 60 cm iodine cell as a saturating beam with an optical power of approximately 3 mW. The intensity of the saturating beam is approximately 1 mW兾mm2. A
fraction of the beam is then reflected back as a probe Fig. 1. Experimental setup. ECDL, external cavity diode laser; FI, Faraday isolator; BS, beam splitter; M, mirror; L, lens; PBS, polarizing beam splitter; 兾4, quarter wave plate; ND, filter-neutral density filter; PD, photodetector.
beam using a neutral density (ND) filter. A quarter waveplate共兾4兲 and a polarizing beam splitter (PBS) are used to direct the probe beam to a photodetector (PD), and this also improves the optical isolation for the ECDL. The probe beam power entering the pho-todetector is 0.3 mW. The cold finger temperature of the iodine cell is normally stabilized to 15 °C, resulting in an iodine vapor pressure of approximately 17 Pa. The Doppler-free saturation spectrum of the hyper-fine components of the P(84) 5–5 transition is observed and recorded with the conventional third-harmonic de-modulation method by a lock-in amplifier. We modu-late the ECDL frequency at 15.1 kHz by modulating the laser diode injection current using the sine output of the lock-in amplifier and scan its frequency by applying a triangular signal to the PZT of the ECDL. To stabilize the laser frequency, the third-harmonic output of the lock-in amplifier is fed into the laser PZT by a simple one-stage integral feedback control loop.
3. Results and Discussion
The third-derivative signal of the saturation spectrum of the hyperfine components of the P(84) 5–5 transition is shown in Fig. 2(a), in which the modulation width is 11.66 MHz. The absorption line consists of 15 hyper-fine components from a to o, distributed within 1 GHz. The observed spectrum shows a flat baseline with a negligible offset, which is important for abso-lute frequency stabilization. The isolated components
a, f, and o are the best choices for frequency
stabili-zation. The hyperfine components are obtained with a SNR of 1000 at a time constant of 1 s. Here the SNR is the peak-to-peak amplitude of the third-derivative signal divided by the noise level. The peak-to-peak amplitude of the third-derivative signal is 10 V and the noise level is 10 mV. The present SNR is mainly limited by the detection electronics. Using our diode laser system to gain a SNR of 1000 is relatively easy. The main reasons that we can obtain such a high SNR are a longer iodine cell and a higher modulation frequency as compared to those in Refs. 8 and 10. In our experiment, the iodine cell length is 60 cm as compared to 25 and 20 cm in Refs. 8 and 10, and the modulation frequency is 15.1 kHz as compared to 780 and 333 Hz in Refs. 8 and 10. A longer cell gives a higher signal, and a higher modulation frequency reduces the noise. We have observed the noise size of the third-harmonic demodulated signal with an os-cilloscope and we find that noise decreases as we increase the modulation frequency. The higher mod-ulation frequency reduces noise and improves SNR. Considering the limitation of the current driver of our ECDL, we chose a modulation frequency of 15.1 kHz instead of 34 kHz that was set by our lock-in ampli-fier. The signal amplitude versus the cold finger tem-perature shows a maximum at approximately 15 °C. Therefore in our study we keep the cold finger tem-perature at 15 °C.
In Fig. 2(a) the spectrum of the 15 hyperfine com-ponents from a to o shows a little asymmetry in their line shapes. It is an artifact due to the fast scan rate.
The line shape is symmetric when using a slower scan rate. The line shape of the o component at a slow scan rate is shown in Fig. 2(b).
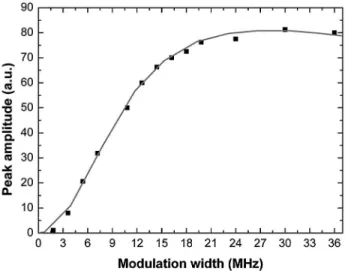
To determine the linewidth of the HFS components one needs a precisely tunable laser system. Our ECDL does not satisfy this requirement. According to Nakazawa’s analysis,12we investigate the amplitude
of the third-derivative signal at various modulation widths and analyze the dependence between the sig-nal amplitude and the modulation width using the result of Nakazawa’s analysis. The amplitude of the third-derivative signal of HFS component o versus the modulation width is shown in Fig. 3, in which the experimental result is coordinated with the fitted the-oretical curve. From the fitted thethe-oretical curve, it indicates that the measured linewidth is 7.5 MHz for HFS component o. The standard error is better than 0.4 MHz (or 5%). By using this method, we have also determined the linewidth of the HFS components of a and f. Both have the same linewidth with a similar standard error. To verify the method described above we use another method to measure the linewidth for HFS components. According to Nakazawa’s analysis, the frequency interval between the two side zero-Fig. 2. (a) Third-derivative signal of the saturation spectrum of the hyperfine components of the P(84) 5–5 transition. Here the time constant is 1 s. (b) The third-derivative signal of the o com-ponent using a slower scan rate.
cross points of the third-derivative signal is the line-width when the modulation line-width is small.12 The
frequency interval between the two side zero-cross points of the third-derivative signal at 2 MHz modu-lation width is approximately 7.2 MHz. This indi-cates that the linewidth is approximately 7.2 MHz, which is consistent with the above result.
Nakazawa’s analysis12also shows that, when the
modulation width is 1.64 times the linewidth, the third-derivative signal obtains a maximum slope and enables the laser spectrometer system to obtain an optimal frequency stability. Under this optimal mod-ulation, the third-derivative signal is fed into the laser PZT by a feedback control loop. Without a sec-ond identical laser system, we estimate the frequency stability from the error signal after locking by con-verting the error voltage to the frequency change. The frequency stability is estimated to be better than 10 kHz, corresponding to a relative value of 2.2⫻ 10⫺11. The error signal is recorded by a chart recorder with a response time of slightly lower than 1 s. The SNR of 1000 at a 1 s time constant and a linewidth of 7.5 MHz implies that the optimum sta-bility is 1.6⫻ 10⫺11⫺1兾2, assuming a white frequency fluctuation. Therefore the stability estimated from the error signal is quite reasonable. When the aver-aging time is 4000 s, the frequency stability is pre-dicted to be 2.5 ⫻ 10⫺13, which is not far from the stability of iodine-stabilized He–Ne lasers at 633 nm. Although the feedback loop is not optimized, our laser system obtains a good frequency stability. For com-parison, Masuda and co-workers8 reported the
fre-quency stabilization of a diode laser to the hyperfine component f of the P(84) 5–5 transition, and the sta-bility they achieved was only 300 kHz.
4. Conclusions
We have developed a simple and compact diode laser stabilization system. HPS components of P(84) 5–5
transition of molecular iodine 共127I2兲 at 657.483 nm
are observed with a SNR of 1000 at a 1 s time con-stant. Our system is less complex than the systems discussed in the previous literature.8,10The diode
la-ser is frequency stabilized to the hyperfine compo-nent o of the saturated absorption signal. A frequency stability of better than 10 kHz is achieved. It is ex-pected that the stability can be further improved by employing a higher modulation frequency and by op-timizing the feedback loop.
In our system we modulate the frequency by cur-rent modulation instead of cavity length modulation by PZT, which was employed by others. Our results indicate that the amplitude modulation induced by current modulation is comparable to PZT modulation and the amplitude modulation-induced drift is negli-gible. We demonstrate that the SNR and stability can be increased by the current modulation since we can modulate the laser at a frequency that is higher than PZT modulation. Our scheme can be applied to ECDL at other wavelengths.
The authors thank M. S. Huang of the Center for Measurement Standards, ITRI, for fruitful comments and useful support of this research.
References
1. T. J. Quinn, “Practical realization of the definition of the metre, including recommended radiations of other optical frequency standards (2001),” Metrologia 40, 103–133 (2003).
2. H. R. Simonsen, “Iodine-stabilized extended cavity diode laser at ⫽ 633 nm,” IEEE Trans. Instrum. Meas. 46, 141–144 (1997).
3. C. S. Edwards, G. P. Barwood, P. Gill, and W. R. C. Rowley, “A 633 nm iodine-stabilized diode-laser frequency standard,” Metrologia 36, 41– 45 (1999).
4. J. Lazar, O. Cíp, and P. Jedlicka, “Tunable extended-cavity diode laser stabilized on iodine at ⫽ 633 nm,” Appl. Opt. 39, 3085–3088 (2000).
5. M. Merimaa, P. Kokkonen, K. Nyholm, and E. Ikonen, “Por-table laser frequency standard at 633 nm with compact external-cavity diode laser,” Metrologia 38, 311–318 (2001). 6. C. S. Edwards, G. P. Barwood, P. Gill, and W. R. C. Rowley,
“Absolute frequency stabilization of a 637 nm laser diode using Doppler-free I2spectra,” Electron. Lett. 31, 796 –797 (1995). 7. C. S. Edwards, G. P. Barwood, P. Gill, F. Rodríguez-Llorente,
and W. R. C. Rowley, “Frequency-stabilized diode lasers in the visible region using Doppler-free iodine spectra,” Opt. Com-mun. 132, 94 –100 (1996).
8. T. Masuda, T. Kimura, T. Tako, and A. Morinaga, “Frequency stabilization of a visible laser diode to an enhanced saturated absorption signal of molecular iodine in an external cavity,” Jpn. J. Appl. Phys. Part 2 36, L1443–L1445 (1997).
9. M. S. Huang, M. H. Lu, and J. T. Shy, “A calcium vapor cell for atomic spectroscopy,” Rev. Sci. Instrum. 73, 3747–3749 (2002). 10. T. Kurosu, J. Ishikawa, and N. Ito, “High-sensitive spectros-copy of molecular iodine by means of power-stabilized light from a diode laser spectrometer,” Jpn. J. Appl. Phys. Part 1 36, 4513– 4516 (1997).
11. M. G. Littman, “Single-mode operation of grazing-incidence pulsed dye laser,” Opt. Lett. 3, 138 –140 (1978).
12. M. Nakazawa, “Phase-sensitive detection on Lorentzian line shape and its application to frequency stabilization of lasers,” J. Appl. Phys. 59, 2297–2305 (1986).
Fig. 3. Measured peak amplitude of the third-derivative signal as a function of modulation width (dotted points) and the theoretical fitted curve (solid curve). The fitted FWHM width is 7.5⫾ 0.4 MHz.