Numerical Investigation of the Role of Turbulent Bursting
in Sediment Entrainment
Fu-Chun Wu
1and Men-Rong Jiang
2Abstract: In this work we incorporate a Gram–Charlier-type joint probability distribution of near-bed two-dimensional instantaneous
velocities into a simple mechanistic model to investigate the role of turbulent bursting in sediment entrainment. The results reveal that under typical values of bed-shear stress共⬎3 Pa兲, the time fractions of Quadrants 1–4 共Q1–Q4兲 remain constantly as 16, 34, 19, and 31%, respectively. Entrainment of the fine sediment mixtures is dominated by the lifting mode, whereas entrainment of the coarse ones is dominated by rolling. Sweeps 共Q4兲 are consistently the most significant contributor to entrainment under various types of sediment mixtures. As the standard deviation of grain-size distribution increases, the hiding effect exerted on the finer grains of the mixture is reduced, leading to the elevated correction factors for effective hydrodynamic forces, and thus the reduced threshold velocities for entrainment. The reduced thresholds would, in turn, enhance the fractional contributions of ejections and inward interactions共Q2 and Q3兲, which are associated with negative longitudinal velocity fluctuations, such that the fractional contribution of outward interactions 共Q1兲 would become less significant.
DOI: 10.1061/共ASCE兲0733-9429共2007兲133:3共329兲
CE Database subject headings: Sediment; Entrainment; Velocity; Shear stress.
Introduction
Turbulent bursting constitutes a near-bed coherent structure in open-channel flows共Nezu and Nakagawa 1993兲. Burst events can be divided into four quadrants关Quadrants 1–4 共Q1–Q4兲兴 by their longitudinal and vertical velocity fluctuations u⬘andv⬘, namely, outward interactions 共u⬘⬎0, v⬘⬎0兲, ejections 共u⬘⬍0, v⬘⬎0兲, inward interactions 共u⬘⬍0, v⬘⬍0兲, and sweeps 共u⬘⬎0, v⬘⬍0兲. A better understanding of the coupling between near-bed turbu-lence and sediment entrainment would facilitate prediction of bed-load transport in fluvial morphodynamic modeling. Limited by the difficulties inherent in simultaneous measurements of local sediment movement and adjacent fluid velocities at turbulence-resolving frequencies, accurate measurements of the interactions between turbulent bursting and sediment motion were first made possible with a synchronized laser-Doppler velocimetry 共LDV兲 and high-speed cinematography 共Nelson et al. 1995兲. From the measurement results, Nelson et al.共1995兲 found that sweeps 共Q4兲 collectively move the majority of the sediment; outward interac-tions共Q1兲 individually move as much sediment as sweeps; and ejections and inward interactions 共Q2 and Q3兲 move much less
sediment than sweeps and outward interactions. However, the ob-servations were made under very limited conditions of flow and sediment, thus the generality of their findings remains to be fur-ther investigated.
In this work we incorporate a Gram–Charlier共GC兲 joint prob-ability distribution of near-bed two-dimensional 共2D兲 instanta-neous velocities into a simple mechanistic model to replicate the burst events and predict the incipient motions of sediment. The role of turbulent bursting in sediment entrainment under vari-ous flow strengths and grain size distributions are explored numerically.
Probability Distribution of Near-Bed Velocities
Several previous studies共e.g., Frenkiel and Klebanoff 1973; Na-kagawa and Nezu 1977; Wu and Yang 2004兲 have suggested that the GC probability density function共pdf兲 well describes the dis-tribution of near-bed velocity fluctuations. The third-order GC joint pdf g3共U,V兲 is used in this work 共Fig. 1兲, which can be expressed as g3共U,V兲 = g0共U,V兲 · 共1 + L1+ L2+ L3+ L4兲 共1兲 where g0共U,V兲 = 1 2冑1 − Ruv2 exp
冋
−U 2− 2R uvUV + V2 2共1 − Ruv 2兲册
L1= Su 3!冋
−冉
Rv 1 − Ruv2冊
3 + 3Rv 共1 − Ruv兲2册
L2= M21 2!冋
3RuvU − 2Ruv 2V − V 共1 − Ruv2 兲2 − RuRv 2 共1 − Ruv2兲3册
1Professor, Dept. of Bioenvironmental Systems Engineering, Hydrotech Research Institute and Center for Ecological Engineering, National Taiwan Univ., Taipei 106, Taiwan, R.O.C. E-mail: fcwu@ ntu.edu.tw
2
Graduate Research Assistant, Dept. of Bioenvironmental Systems Engineering, National Taiwan Univ., Taipei 106, Taiwan, R.O.C.
Note. Discussion open until August 1, 2007. Separate discussions must be submitted for individual papers. To extend the closing date by one month, a written request must be filed with the ASCE Managing Editor. The manuscript for this technical note was submitted for review and possible publication on May 3, 2005; approved on August 28, 2006. This technical note is part of the Journal of Hydraulic Engineering, Vol. 133, No. 3, March 1, 2007. ©ASCE, ISSN 0733-9429/2007/3-329–334/ $25.00.
L3= M12 2!
冋
3RuvV − 2Ruv 2U − U 共1 − Ruv2 兲2 − RvRu 2 共1 − Ruv2兲3册
L4= Sv 3!冋
−冉
Ru 1 − Ruv2冊
3 + 3Ru 共1 − Ruv兲2册
in which U = u⬘/u; V =v⬘/v; u⬘= ub− u¯b; v⬘=vb−v¯b, ub and vb⫽near-bed instantaneous longitudinal and vertical velocities; u¯band¯vb⫽time-averaged velocities; uandv⫽standard deviations; Ruv=具u⬘v⬘典/uv⫽correlation coefficient, where 具典 denotes the
ensemble mean; Ru= RuvV − U; Rv= RuvU − V; Su=具u⬘3典/u 3; and
Sv=具v⬘3典/v
3⫽skewness factors; and M
21=具u⬘2v⬘典/u 2
v and M12=具u⬘v⬘2典/uv
2⫽diffusion factors. The values of these param-eters are determined as follows.
The near-bed correlation coefficient Ruvtypically ranges from
−0.4 to −0.5共Pope 2000兲. Given a compilation of data for various roughness regimes and experimental settings 共Wu and Yang 2004兲, we adopt a value of Ruv= −0.45 throughout this
study. Based on such data, Wu and Yang 共2004兲 proposed u/ u*= −0.187 ln共ks
+兲+2.93 and S
u= 0.102 ln共ks
+兲 for smooth and transitional regimes 共ks+ⱕ70兲, where u*=
冑
0/; 0⫽bed-shear stress; ⫽density of fluid; ks+= u*ks/; ks= 2D50; D50⫽median grain size; and⫽kinematic viscosity of fluid. For rough regimes 共ks+⬎70兲, constant values of u/ u*= 2.14 and Su= 0.43 were
sug-gested. In addition, constant values ofv/ u*= 1, Sv= 0, M12= 0.1, and M21= −0.04 are adopted in this work because no significant variations of these parameters are observed from the compiled data set.
It has been pointed out that the GC pdf may result in small negative values at tail regions 共Frenkiel and Klebanoff 1973兲. Although, in principle, negative densities are unacceptable, the resulting probability distribution is usable if appropriate precau-tions are taken by specifying zero densities to tail regions and rescaling the density function 共generally, ⱕ1±0.05%兲 such that the cumulative probability共integration of pdf over U and V兲 sums up to unity. The instantaneous velocities ubandvbcan be
decom-posed into a mean velocity and a fluctuation component, where the longitudinal mean velocity u¯bis evaluated using the approach detailed in Wu and Yang共2004兲, and the vertical mean velocity¯vb is taken to be zero.
Mechanistic Model for Sediment Entrainment
A simple mechanistic model presented by Wu and Yang共2004兲 is adopted in this work. Only the conceptual framework is outlined here; the readers are referred to the original work for details. The external forces applied on a resting sediment particle include the submerged weight W and instantaneous hydrodynamic forces, which can be resolved into an effective drag FDand an effective lift FL, both formulated in terms of ub, as adopted by Cheng and
Chiew共1999兲, Fischer et al. 共2002兲, and Wu and Yang 共2004兲, i.e.
FD=iCD Aub 2 2 , FL=iCL Aub 2 2 共2兲
wherei⫽hiding-exposure correction factor for grain size Di; CD and CL⫽drag and lift coefficients, respectively; and A⫽exposed
frontal area. The approach adopted herein implies that the instan-taneous lift is in phase with the instaninstan-taneous drag共since both are evaluated using ub兲, which at best represents a necessarily simpli-fied treatment of force balance because using vb to evaluate the
instantaneous lift lacks any physical evidence. Although it has been also argued that in turbulent boundary layers the Reynolds stress共−u⬘v⬘兲 plays a significant role in producing shear forces, an increasing number of studies indicated that the near-bed lon-gitudinal velocity, rather than the Reynolds stress, is most respon-sible for sediment motions 共e.g., Williams et al. 1989; Nelson et al. 1995; Schmeeckle and Nelson 2003兲. In this work, the 2D effect of turbulent bursting is nevertheless accounted for through the GC joint pdf, as described in the next section.
The criterion for a static particle to be instantaneously en-trained in the rolling mode can be expressed by
FDLD+ FLLL⬎ WLW 共3兲
where LD, LL, and LW⫽moment arms of FD, FL, and W,
respec-tively. Substituting the expressions of the forces and moment arms into Eq.共3兲 leads to
ub2⬎ BR2 共4兲
where BR⫽threshold velocity for incipient rolling. Similarly, the
criterion for a static particle to be instantaneously entrained in the lifting mode can be expressed by
FL⬎ W 共5兲
Substituting the expressions of the forces into Eq.共5兲 yields
ub2⬎ BL2 共6兲
where BL⫽threshold velocity for incipient lifting. It has been
shown that the lifting threshold BL is higher than the rolling
threshold BR共Wu and Chou 2003兲.
Probabilities of Sediment Entrainment
The probability of sediment entrainment in the rolling mode is defined by PR= P关共BR 2⬍ u b 2⬍ B L 2兲 艚 共u lⱕ ubⱕ uu兲兩共vlⱕvbⱕvu兲兴 共7兲
where the instantaneous velocities ul= u¯b+ ul⬘and uu= u¯b+ uu⬘, and ul⬘ and uu⬘⫽lower and upper bounds of u⬘ corresponding to the region within which g3共U,V兲 is positive 共Fig. 1兲; andvl=v¯b+vl⬘
and vu=¯vb+vu⬘, and vl⬘ and vu⬘⫽lower and upper bounds of v⬘
corresponding to the region with positive g3共U,V兲. The condi-tional probability defined by Eq.共7兲 implies that for eachv⬘
be-Fig. 1. Three-dimensional plot showing the third-order Gram–Charlier joint pdf of the normalized velocity fluctuations 共u*= 0.055 m / s兲
tween 共vl⬘,vu⬘兲 there exists a corresponding range of u⬘ between 共ul⬘, uu⬘兲 through which the 2D constraint of turbulent bursting is
imposed. The rolling probability PRis then evaluated by
integrat-ing g3共U,V兲 over suitable ranges of U and V, i.e.
PR=
冕
VR冕
URg3共U,V兲dUdV 共8兲
where UR and VR denote the ranges of U and V that
simulta-neously meet the constraints for incipient rolling and joint pdf of turbulent bursting. The mean rolling probability, PR, is the ex-pected value of Eq.共8兲 over the full ranges of the supporting grain size Dk, exposure height⌬j, and friction height⌬k共for details see
Wu and Yang 2004兲.
Similarly, the probability of sediment entrainment in the lifting mode is defined by
PL= P关共BL2⬍ ub2兲 艚 共ulⱕ ubⱕ uu兲兩共vlⱕvbⱕvu兲兴 共9兲
The lifting probability PL is evaluated by integrating g3共U,V兲 over suitable ranges of U and V, i.e.
PL=
冕
VL冕
ULg3共U,V兲dUdV 共10兲
where UL and VL denote the ranges of U and V that simulta-neously meet the constraints for incipient lifting and joint pdf of turbulent bursting. The mean lifting probability, PL, is the ex-pected value of Eq.共10兲 over the full ranges of ⌬jand⌬k. Since
rolling and lifting are two independent modes, the total entrain-ment probability PT is given by PR+ PL.
Quadrant Analyses
The proportion of time occupied by the burst events in the ith quadrant, denoted as Ti, is evaluated by
Ti=
冕
Vi冕
Uig3共U,V兲dUdV for i = 1, ... ,4 共11兲 where Uiand Vi⫽ranges of integration in the ith quadrant. The
fractional contribution 共FC兲 of the ith quadrant to sediment en-trainment, denoted as FCi, is evaluated by
FCi=共PRi+ PLi兲/PT for i = 1, ... ,4 共12兲
where PRi⫽expected value of PR,iover the full ranges of共Dk,⌬j,
⌬k兲; and PLi⫽expected value of PL,iover the full ranges of共⌬j,
⌬k兲, in which PR,i=兰VR,i兰UR,ig3共U,V兲dUdV, PL,i=兰VL,i兰UL,ig3 共U,V兲dUdV; UR,iand VR,i⫽partial ranges of URand VRin the ith
quadrant; and UL,iand VL,i⫽partial ranges of ULand VLin the ith
quadrant.
Results Verification
Time Fractions of Four Quadrants
The predicted proportions of time occupied by four quadrants are verified with two sets of experimental data. The first was col-lected by Nelson et al. 共1995兲 in a recirculating flume with a well-sorted sand bed. The grain size was lognormally distributed with a mean of 0.9 mm and a standard deviation of 0.1 mm. Mea-surements of the fluid velocities were made by the LDV at a point 5 mm above the bed. Mean flow conditions were 0= 0.78 Pa,
u
¯b= 32.9 cm/ s, u= 5.3 cm/ s, v= 3.2 cm/ s, and Ruv= −0.44,
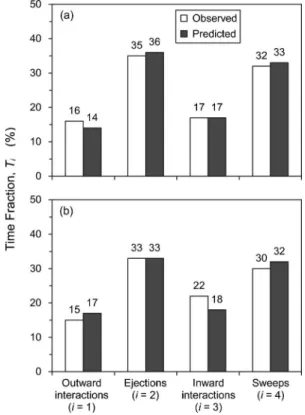
classified as a transitional regime 共ks+⬵50兲. The predicted and observed patterns of Tiare shown in Fig. 2共a兲, where satisfactory agreement is demonstrated. Ejections 共Q2兲 were the most com-mon events; sweeps 共Q4兲 were slightly less common; these two types of burst events occupied more than 65% of the total dura-tion. Inward interactions 共Q3兲 were slightly more common than outward interactions共Q1兲.
The second set of data was collected by Papanicolaou et al. 共2001兲 using a flume with lead spherical particles 共8 mm in di-ameter兲 placed atop a bed packed with glass beads of 8 mm in size. Three packing densities of lead spheres were used to simu-late the isosimu-lated, wake-interference, and skimming flow regimes. Only the data for the skimming flow regime共70% packing den-sity兲 are adopted here because the other two apparently represent different bed configurations from the densely packed bed consid-ered in this study. Velocity measurements were made by the LDV at a point 4.7 mm above the lead sphere. Flow conditions were 0= 8.7 Pa, u¯b= 34.6 cm/ s, u= 16.1 cm/ s, and v= 10.5 cm/ s,
classified as a rough regime 共ks+⬵1,500兲. The predicted and ob-served patterns of Ti are shown in Fig. 2共b兲, where satisfactory
agreement is again demonstrated. Similar to the results shown in Fig. 2共a兲, ejections and sweeps 共Q2 and Q4兲 were the most com-mon events, with the time fractions of both slightly reduced, which was probably due to the 70% packing density. Although the flow regimes used in the above two experiments were different 共transitional versus rough regimes兲, the patterns of Tishown in
Figs. 2共a and b兲 were quite similar, implying that the time frac-tions of four quadrants may not be very sensitive to flow regimes. We will address this issue in the section of model applications.
Fig. 2. Time fractions of four quadrants for 共a兲 0= 0.78 Pa, mean
Fractional Contributions to Sediment Entrainment
The simultaneous measurements of fluid velocities and sediment movement performed by Nelson et al. 共1995兲 using a synchro-nized LDV and high-speed CCD are used here to verify the pre-dicted fractional contributions of four quadrants to sediment entrainment. The predicted and observed patterns of FCi are
shown in Fig. 3共a兲, where satisfactory agreement is demonstrated. Sweeps共Q4兲 were the major contributor to sediment entrainment, with ⬃50% of the entrainment being attributed to these events; outward interactions 共Q1兲 contributed about 1/2 of that amount, roughly equal to the combined contribution of ejections共Q2兲 and inward interactions 共Q3兲. Since both sweeps 共Q4兲 and outward interactions 共Q1兲 are associated with positive u⬘, the significant contributions of these two quadrants may be attributed to the greater longitudinal velocities. Nelson et al.共1995兲 further argued that the fractional contribution of sweeps共Q4兲 was more signifi-cant than that of outward interactions共Q1兲 because sweeps were much more common events关Fig. 2共a兲兴, which is confirmed by the patterns of FCi/ Tishown in Fig. 3共b兲. It is revealed that Q1 and
Q4 were those two quadrants with the highest values of FCi/ Ti,
indicating that outward interactions共Q1兲 individually entrained as much sediment as sweeps共Q4兲. Generality of this argument will be investigated in the following section.
Model Applications
In this section, we investigate the effect of flow strength on the time fractions of four quadrants. The proposed model is also ap-plied to explore the effect of grain-size distribution on the frac-tional contributions of four quadrants to sediment entrainment.
Effect of Flow Strength on Time Fractions
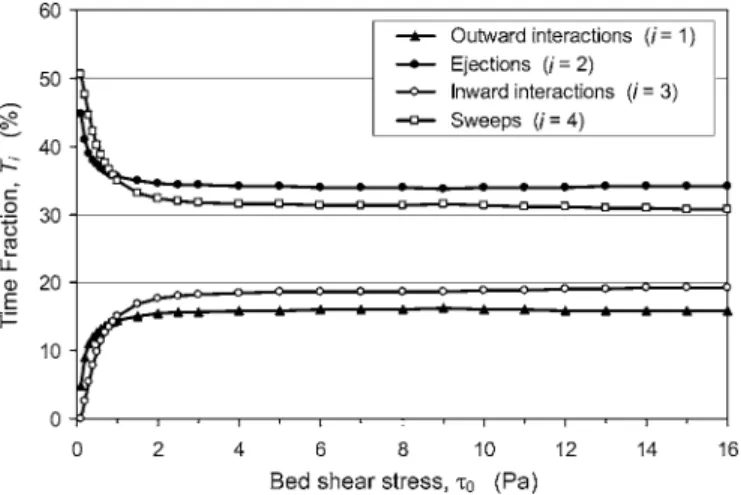
To investigate the effects of flow strength 共0兲 and grain rough-ness 共D50兲 on the time fractions of four quadrants, we calculate the values of Tifor a number of0ranging from 0.1 to 16 Pa. For each 0, the grain sizes corresponding to a typical range of 共Shields number兲 between 0.01 and 10 are evaluated, and the resulting values of ks+and Tiare then determined. From the results
we find that for each0, the values of Tiexhibit little variations
although the grain size and ks+ are increased by three orders of magnitude, indicating that grain roughness has negligible effects on the time fractions of four quadrants. Shown in Fig. 4 are the relations between Tiand0, where significant variations of Tiare
observed only in a narrow range of0between 0 and 3 Pa. Varia-tions of Ti are, however, not apparent for 0⬎3 Pa, where the values of T1– T4 remain as 16, 34, 19, and 31%, respectively. With such results in view, it is not surprising that the patterns of
Tishown in Figs. 2共a and b兲 are so similar. Fig. 4 also reveals that
sweeps 共Q4兲 and ejections 共Q2兲 would become extremely com-mon at very low values of 0, which remains open to further investigations. LDV measurements are currently undertaken by the writers to verify such results.
Effect of Grain Size Distribution on Fractional Contributions
Given that the time fractions of four quadrants are affected neither by grain roughness nor the values of 0 typical of open-channel flows, we speculate that the fractional contributions of four quad-rants to sediment entrainment would respond to the variation of grain-size distribution. To explore the effect of grain-size distri-bution, two types of sediment mixture共fine and coarse兲 are used here. Both mixtures have lognormally distributed grain sizes, which cover a range from 0.13 to 9.77 mm for the fine mixture 共D50= 1 mm兲, and from 0.47 to 52.5 mm for the coarse mixture 共D50= 6 mm兲. For each type of mixture, two degrees of grain sorting are considered, namely, well sorted 共g= 2兲 and poorly sorted 共g= 3.6兲, where g⫽geometric standard deviation
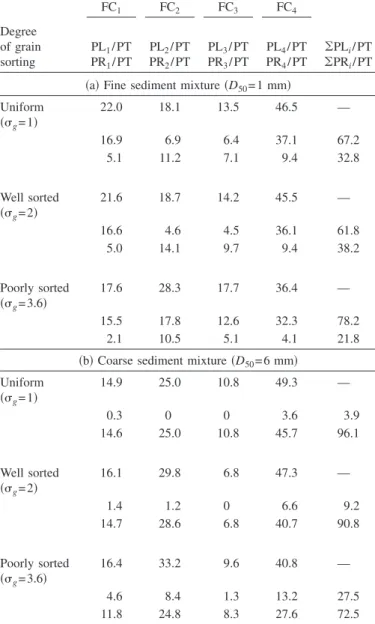
⫽D84/ D50. The predicted fractional contributions associated with various sediment mixtures are shown in Table 1, where the results associated with uniform sediments共g= 1兲 are also demonstrated
to provide a basis for comparisons. The values of0used for the
Fig. 3.共a兲 Fractional contributions; 共b兲 unit fractional contributions
of four quadrants for0= 0.78 Pa and mean grain size⫽0.9 mm
Fig. 4. Variations of time fraction with bed-shear stress 共each data
point represents the mean value corresponding to a range of between 0.01 and 10兲
fine and coarse sediment mixtures are 3 and 10 Pa, respectively, with the corresponding values of ks+= 110 and 1,200, both classi-fied as fully rough regimes.
Entrainment of the fine sediment mixtures is dominated by lifting, with consistently more than 60% entrained in the lifting mode共respectively, 67, 62, and 78% for the uniform, well-, and poorly sorted sediments兲; whereas entrainment of the coarse sedi-ment mixtures is dominated by rolling, with consistently less than 30% entrained in the lifting mode共respectively, 4, 9, and 28% for the uniform, well-, and poorly sorted sediments兲. The fractional contributions of sweeps共Q4兲 are consistently the most significant ones under various sediment mixtures, because of both the greater longitudinal velocities 共u⬘⬎0兲 and time fractions 共T4= 31%兲. Outward interactions 共Q1兲 are the second significant contributor only under the uniform and well-sorted fine sediments. Under the coarse sediment mixtures and the poorly sorted fine sediment, however, the fractional contributions of ejections共Q2兲 exceed the corresponding values of outward interactions 共Q1兲. In other words, the earlier argument made by Nelson et al.共1995兲, claim-ing that sweeps共Q4兲 and outward interactions 共Q1兲 are two major contributors to entrainment, seems not to be valid for all types of sediment mixtures with different degrees of sorting.
To further look into this problem, the dominant mode of en-trainment in each quadrant is individually identified by the values of PLi/ PT and PRi/ PT listed in Table 1. Under the uniform and
well-sorted fine sediments for which outward interactions 共Q1兲 are the second major contributor, the dominant mode of entrain-ment in Q1 and Q4 is lifting, different from the rolling mode that dominates the sediment entrainment in Q2 and Q3. However, under the coarse sediment mixtures and the poorly sorted fine sediment for which ejections共Q2兲 are the second major contribu-tor, the dominant mode of entrainment in four quadrants is con-sistent, which is lifting under the poorly sorted fine sediment but is rolling under the coarse sediment mixtures. Therefore, whether outward interactions共Q1兲 or ejections 共Q2兲 are the second major contributor depends on if the dominant mode of entrainment in Q1 and Q4共both with u⬘⬎0兲 is consistent with that in Q2 and Q3 共both with u⬘⬍0兲, which is elucidated below in more detail.
In Fig. 4 we see that outward interactions共Q1兲 are very rare events, with the time fraction T1consistently no more than 16%. As such, their remarkable contribution to entrainment relies on the greater longitudinal velocities共u⬘⬎0兲 but not the time occu-pied. Under the uniform fine sediment, lifting is the dominant mode of entrainment. Both sweeps and outward interactions共Q4 and Q1兲 play significant roles in entrainment given their greater longitudinal velocities, many of which exceed the lifting thresh-olds. In contrast, the entrainment induced by ejections and inward interactions共Q2 and Q3兲 is dominated by rolling because of their inherently smaller longitudinal velocities共u⬘⬍0兲. The fractional contributions of Q2 and Q3 are, however, enhanced by the expo-sure effect associated with the well-sorted fine sediment mixture; such effect is exerted on those coarser grains with sizes⬎D50. As a result, the proportions entrained by rolling are increased from 11.2 and 7.1% to 14.1 and 9.7% in Q2 and Q3, respectively. However, as the poorly sorted fine sediment mixture is used, the hiding effect exerted on those finer grains with sizes ⬍D50 is reduced, leading to the higher correction factors for effective lift forces共in average 13% higher than the corresponding values of the well-sorted fine mixture兲. The elevated correction factors would in turn reduce the threshold velocities required for lifting. Once the lifting thresholds are lowered, the entrainment in all quadrants would be consistently dominated by lifting, such that the fractional contribution of Q2共ejections兲 would exceed that of Q1共outward interactions兲 since ejections are so much more com-mon than outward interactions.
Under all kinds of coarse sediment mixtures, rolling is consis-tently the dominant mode of entrainment in four quadrants. The fractional contribution of Q2共ejections兲 consistently exceeds that of Q1 共outward interactions兲 because ejections are much more common events. Although the time fraction of Q3共inward inter-actions兲 is slightly greater than that of Q1 共outward interactions兲, the fractional contributions of Q3 are consistently the least sig-nificant ones due to the inherently smaller longitudinal velocities 共u⬘⬍0兲. As the value of gbecomes greater, the proportions
en-trained by lifting are increased in all quadrants. Under the poorly sorted coarse sediment mixture, the reduced hiding effect exerted on those finer grains leads to the higher correction factors for effective drag and lift forces 共in average 16% higher than the corresponding values of the well-sorted coarse mixture兲. The el-evated correction factors would reduce the threshold velocities required for entrainment of those finer grains. The reduced thresh-old velocities in turn enhance the fractional contributions of Q2 and Q3, both associated with negative values of u⬘.
Table 1. Fractional Contributions of Four Quadrants to Entrainment of
Various Sediment Mixtures共Units in %兲
FC1 FC2 FC3 FC4 Degree of grain sorting PL1/ PT PR1/ PT PL2/ PT PR2/ PT PL3/ PT PR3/ PT PL4/ PT PR4/ PT 兺PLi/ PT 兺PRi/ PT
共a兲 Fine sediment mixture 共D50= 1 mm兲 Uniform 共g= 1兲 22.0 18.1 13.5 46.5 — 16.9 6.9 6.4 37.1 67.2 5.1 11.2 7.1 9.4 32.8 Well sorted 共g= 2兲 21.6 18.7 14.2 45.5 — 16.6 4.6 4.5 36.1 61.8 5.0 14.1 9.7 9.4 38.2 Poorly sorted 共g= 3.6兲 17.6 28.3 17.7 36.4 — 15.5 17.8 12.6 32.3 78.2 2.1 10.5 5.1 4.1 21.8
共b兲 Coarse sediment mixture 共D50= 6 mm兲 Uniform 共g= 1兲 14.9 25.0 10.8 49.3 — 0.3 0 0 3.6 3.9 14.6 25.0 10.8 45.7 96.1 Well sorted 共g= 2兲 16.1 29.8 6.8 47.3 — 1.4 1.2 0 6.6 9.2 14.7 28.6 6.8 40.7 90.8 Poorly sorted 共g= 3.6兲 16.4 33.2 9.6 40.8 — 4.6 8.4 1.3 13.2 27.5 11.8 24.8 8.3 27.6 72.5
Conclusions
The role of turbulent bursting in sediment entrainment is numeri-cally investigated in this study. The results reveal that the time fractions of four quadrants remain constant under typical values of bed-shear stress. Sweeps共Q4兲 are consistently the most signifi-cant contributor to sediment entrainment under various flow and sediment conditions. The fractional contributions of ejections and inward interactions共Q2 and Q3兲 increase with the standard de-viation of grain-size distribution. Under the poorly sorted sedi-ment mixtures, the fractional contribution of ejections共Q2兲 would exceed that of outward interaction 共Q1兲. Experimental studies should be conducted to further verify these results. Although plausible, the simple mechanistic model adopted in this work may be revised in the future by incorporating the vertical velocity component. In addition, the higher-order correlations of near-bed 2D velocities under various conditions can be also derived from the experimental studies to better predict the turbulent bursting and sediment motions.
Acknowledgments
The writers acknowledge the research funding granted by the Na-tional Science Council, Taiwan, R.O.C. Comments from the ASCE reviewers helped improve the clarity of this work.
Notation
The following symbols are used in this technical note: A ⫽ exposed frontal area;
BL, BR ⫽ lifting and rolling thresholds; CD, CL ⫽ drag and lift coefficients;
Di, Dk ⫽ grain sizes of fraction i and downstream supporting particle;
D50, D84 ⫽ median and 84th-percentile grain sizes;
FD, FL ⫽ instantaneous effective drag and lift forces;
FCi ⫽ fractional contribution of quadrant i=共PRi + PLi兲/PT;
g3共U,V兲 ⫽ third-order Gram–Charlier joint pdf;
ks ⫽ equivalent roughness height⫽2D50;
ks+ ⫽ roughness Reynolds number⫽u*ks/; LD, LL, LW ⫽ moment arms of FD, FL, and W;
M12, M21 ⫽ diffusion factors;
PL, PR ⫽ lifting and rolling probabilities;
PL, PR, PT ⫽ mean lifting, rolling, and total entrainment probabilities;
Ru, Rv, Ruv ⫽ RuvV − U, RuvU − V, and correlation
coefficient;
Su, Sv ⫽ skewness factors;
Ti ⫽ time fraction of quadrant i; U, V ⫽ u⬘/uandv⬘/v;
UL, VL ⫽ ranges of U and V meeting the constraints
for lifting and GC joint pdf;
UR, VR ⫽ ranges of U and V meeting the constraints
for rolling and GC joint pdf;
UL,i, VL,i ⫽ partial ranges of ULand VLin quadrant i; UR,i, VR,i ⫽ partial ranges of URand VRin quadrant i;
u⬘,v⬘ ⫽ longitudinal and vertical velocity fluctuations;
ub,vb, u¯b,v¯b ⫽ near-bed instantaneous and mean
longitudinal and vertical velocities;
ul, uu,vl,vu ⫽ u¯b+ ul⬘, u¯b+ uu⬘,v¯b+vl⬘, and¯vb+vu⬘; ul⬘, uu⬘,vl⬘,vu⬘ ⫽ lower and upper bounds of u⬘andv⬘for
GC joint pdf;
u* ⫽ bed-shear velocity⫽
冑
0/;W ⫽ submerged weight;
⌬j,⌬k ⫽ exposure and friction heights;
␥s,␥ ⫽ specific weights of sediment and water;
⫽ Shields number based on
D50=0/共␥s−␥兲D50;
, ⫽ kinematic viscosity and density of fluid; i ⫽ hiding-exposure correction factor for grain
size Di;
g ⫽ geometric standard deviation⫽D84/ D50; u,v ⫽ standard deviations of longitudinal and
vertical velocities; and 0 ⫽ bed-shear stress.
References
Cheng, N.-S., and Chiew, Y.-M. 共1999兲. “Closure to Discussion of ‘Pickup probability for sediment entrainment.’” J. Hydraul. Eng.,
125共7兲, 789.
Fischer, P. F., Leaf, G. K., and Restrepo, J. M.共2002兲. “Forces on par-ticles in oscillatory boundary layers.” J. Fluid Mech., 468, 327–347. Frenkiel, F. N., and Klebanoff, P. S.共1973兲. “Probability distributions and correlations in a turbulent boundary layer.” Phys. Fluids, 16, 725– 737.
Nakagawa, H., and Nezu, I.共1977兲. “Prediction of the contributions to the Reynolds stress from bursting events in open-channel flows.” J. Fluid Mech., 80, 99–128.
Nelson, J. M., Shreve, R. L., McLean, S. R., and Drake, T. G.共1995兲. “Role of near-bed turbulence structure in bed load transport and bed form mechanics.” Water Resour. Res., 31共8兲, 2071–2086.
Nezu, I., and Nakagawa, H.共1993兲. Turbulence in open-channel flows, Balkema, Rotterdam, The Netherlands.
Papanicolaou, A. N., Diplas, P., Dancey, C. L., and Balakrishnan, M. 共2001兲. “Surface roughness effects in near-bed turbulence: Implica-tions to sediment entrainment.” J. Eng. Mech., 127共3兲, 211–218. Pope, S. B.共2000兲. Turbulent flows, Cambridge University Press, New
York.
Schmeeckle, M. W., and Nelson, J. M.共2003兲. “Direct numerical simu-lation of bedload transport using a local, dynamic boundary condi-tion.” Sedimentology, 50, 279–301.
Williams, J. J., Thorne, P. D., and Heathershaw, A. D.共1989兲. “Measure-ments of turbulence in the benthic boundary layer over a gravel bed.” Sedimentology, 36, 959–971.
Wu, F.-C., and Chou, Y.-J.共2003兲. “Rolling and lifting probabilities for sediment entrainment.” J. Hydraul. Eng., 129共2兲, 110–119.
Wu, F.-C., and Yang, K.-H.共2004兲. “Entrainment probabilities of mixed-size sediment incorporating near-bed coherent flow structures.” J. Hy-draul. Eng., 130共12兲, 1187–1197.