行政院國家科學委員會專題研究計畫 成果報告
有階層結構性的板塊資料單根檢定: Gibrat 定律的再檢定.
計畫類別: 個別型計畫 計畫編號: NSC91-2415-H-002-005- 執行期間: 91 年 08 月 01 日至 92 年 07 月 31 日 執行單位: 國立臺灣大學經濟學系暨研究所 計畫主持人: 朱家祥 報告類型: 精簡報告 處理方式: 本計畫可公開查詢中 華 民 國 92 年 11 月 4 日
Investigating the Gilbrat’s Law
Using Modified Panel Unit Root Tests
Chia-Shang Chu Department of Economics National Taiwan University
Taipei Taiwan
1 Introduction
The law of proportional effect, also known as the Gilbrat’s law, states that the growth rate of firm is independent to the initial size of the firm. Earlier empirical studies focused on univariate unit root tests for individual firms. Mansfield (1962), Utton (1971), Singh and Whittington (1975) and Tschoegl (1983) presented evidence supporting the Gilbrat’s law. On the other hand, Hart (1956), Samuels and Chester (1972), Kumar (1985), Hall (1987), Evans (1987), Dune and Hughes (1994) ad Hart and Oulton (1996) rejected the Gilbrat’s law. Most of these studies did not apply the proper null distribution to examine the significance of the t statistics, which might explain why there exist diverse findings on both sides of the fence.
The low power of the unit root test based on the univariate time series is notoriously well known. The development of the panel unit root test by Levin, Lin and Chu (2002), and Im, Pesaran and Shin (1997), henceforth LLC test and IPS test, respectively, have shown that the unit root test enjoys dramatic power increase in panel data. Re-investigating the Gilbrat’s law using the panel unit root tests can shed new light on this issue. Recently Acs et. al. (2000), Armington et. al. (2000), and Goddard et. al. (2002) and Breitung and Meyer investigated the growth rate of firms in Japanese manufacturing industry in terms of the total assets, and found that the Gilbrat’s law was rejected. Hamilton et. al. (2002) use a sample of 175 Canadian high-tech firms and studies their growth rates in terms of sales. They found that the sizes of the firm do not follow a random walk. In particular, smaller firms exhibits higher growth rate. In other words, the Gilbrat’s law is also rejected.
However, the panel unit root LL test and IPS tests hinge on a crucial assumption of cross sectional dependence. Such an assumption may well be unrealistic in the panel data of growth rates of firms for obvious reasons. Maddala and Wu (1999) show that the empirical sizes of LL and IPS tests suffer great distortion, when the cross sectional dependence is present. Moreover, it requires greater technicalities to prove that the central limit theorem works for the pooled unit root test statistics. There many
on-going research in the unit root test for dependent panel, while some advance is made, in this article a simple solution based on the stratified samples repeated generated from a cross sectional dependent panel is proposed. Though simple, simulations show that it corrects the size distortion of LL and IPS tests at the expense of a little power loss when the assumption of cross sectional independence holds. The proposed modified LLC and IPS tests are further applied to the Taiwanese data set. Results show that the Gilbrat’s law is rejected.
2 Monte Carlo Studies Data Generating Process
Let the total number of industries be G, and there be N firms in each industry, hence
G N× cross sectional observations.
(1) Generating process for{ },
ε
it i=1, 2,...GN t; =1, 2,...T .(1a) For each industry g, g=1,2,…G, generate a positive definite matrix * *
[ ] '
g ij g g
ρ
=ω
=υ υ
, where υg is a N×1 vector drawn from normal iid N(0.5,1). Let* * , , , , * , , { } 0.8 0.2 { } g ij i j g ij g ij i j g ij Min Max
ρ
ρ
ρ
ρ
− = + × , and use the elements
ρ
g ij, ,i≠ j form the correlation matrixρ
gfor the industry g, g=1,2…G.(1b) Create a GN GN× block diagonal matrix ρ using ρg ,g=1,2…G, i.e.
1 2 0 0 0 0 0 0 N N N N G N N
ρ
ρ
ρ
ρ
× × × = K L M M O M L .Draw
σ
i2 from uniform distribution U[0.5,1.5], i=1, 2,...NG . As a result, the variance-covariance matrix Ω can be calculated.(1c) generate{ }
ε
t from a GN-dimensional normal N(0, ),Ω =t 1,...T+l(2) Use{ }
ε
t to constructyit = −(1α
)yit−1+ε
it, and discard the first (l−1) observation to avoid initial effect. Whenα =0, the panel contains a unit root. Stationary panel is characterized by 0< <α 1.Table I displays the empirical size performance of the panel LLC and IPS test, in contrast to the modified LL and IPS test, denoted as IPS-bar, and LLC-bar, respectively. The cross sectional structure in each sample consists ten groups, and there are five firms within each group. The number of replication times is two thousand. As seen clearly, the empirical sizes of original LLC and IPS tests suffer great distortion in a cross sectional dependent panel. On the other hand, the modified test statistics based on repeated stratified sampling delivers a little conservative size compared to the nominal. Nevertheless, it has restored the sizes to acceptable level,
Table I Empirical Sizes oof Panel Unit Root Tests 0.1 α = 0.05α = T=20 30 50 100 200 T=20 30 50 100 200 IPS_bar .043 .038 .041 .079 .089 .048 .041 .037 .035 .038 IPS .217 .242 .281 .237 .269 .219 .204 .222 .198 .224 LLC_bar .083 .093 .079 .070 .067 .038 .048 .034 .021 .022 LLC .309 .298 .321 .317 .340 .256 .235 .257 .255 .249
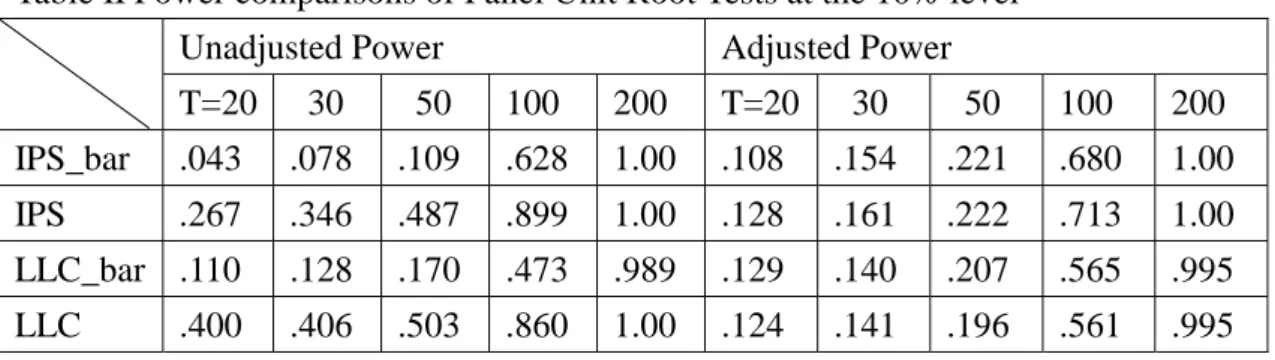
Table II Power comparisons of Panel Unit Root Tests at the 10% level Unadjusted Power Adjusted Power
T=20 30 50 100 200 T=20 30 50 100 200 IPS_bar .043 .078 .109 .628 1.00 .108 .154 .221 .680 1.00 IPS .267 .346 .487 .899 1.00 .128 .161 .222 .713 1.00 LLC_bar .110 .128 .170 .473 .989 .129 .140 .207 .565 .995 LLC .400 .406 .503 .860 1.00 .124 .141 .196 .561 .995
The power performance of the various tests is summarized in Table II. The original LLC and IPS tests have much unadjusted power compared to the modified statistics due to the highly inflated empirical sizes. On the other hand, when the sample size is small, the conservative modified statistics delivers some empirical power lower than the ten percent nominal size.
Adjusting the power provides a clearer contrast between the original and modified test statistics. Generally, the modified LLC test performed as well as the original test. The modified IPS test, however, is slightly less powerful than the original IPS test. These results suggest that the modified test statistics correct the size distortion in the cross sectional dependent panel at a little cost of less power, if any.
3 Empirical Results
The sample contains 90 Taiwanese public companies, classified into 18 industries. The growth rate is calculated in terms of the monthly sales. Natural log is taken for statistical analysis.
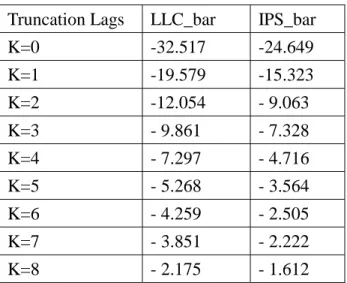
Table III Test Statistics for Taiwanese Firms Truncation Lags LLC_bar IPS_bar
K=0 -32.517 -24.649 K=1 -19.579 -15.323 K=2 -12.054 - 9.063 K=3 - 9.861 - 7.328 K=4 - 7.297 - 4.716 K=5 - 5.268 - 3.564 K=6 - 4.259 - 2.505 K=7 - 3.851 - 2.222 K=8 - 2.175 - 1.612
The modified LLC and IPS test procedures were implemented, and the results are summarized in Table III. Various truncation lags for estimating the covariance were also tried. All of the test statistics are significant at least at the ten percent level, except the modified IPS statistics when the truncation lags were eight. These results strongly suggest that the Gilbrat’s law does not hold for the sample Taiwanese firms.
Reference
Goodard, J., J. Wilson and Peter Blandon (2002), “Panel Test of Gilbrat’s Law for Japan’s Manufacturing,” Journal of Industrial Organization 20, 415-433.
Hamliton, O., D. Shapiro and A. Vinging (2002), “ The Growthe Patterns of Canadian High Tech Firms,” International Journal of Technology Management 24 (4), 458-472. Im, K.S., H. Parasan and Y. Shin, (997), “ Testing for Unit Roots in Heterogenous Panel,” University of Cambridge, revised version of DAE Working Paer 9526.
Levin, A., C.F. Lin and C.S. Chu (2002), “ Unit Root Tests in Panel Data: Asymptotics and Finite Sample Properties,” Journal of Econometrics 108, 1-24.
Maddala, G.S. and S. Wu (1999), “A Comparative Study of Unit Root Tests with Panel Data and a New Simple Test,” Oxford Bulletin of Economics and Statistics 61, 631-652.