Current Knowledge about european eel AnguillA
AnguillA (l.) mtdna d-loop region HaplotypiC Variety
dalius butKauSKaS1, adomas ragauSKaS1, aniolas Sruoga1, Linas LOŽYS1, wann-nian tZeng2
1Institute of Ecology of Vilnius University, Akademijos 2, LT-08412 Vilnius-21, Lithuania. E-mail: dalius@ekoi.lt 2Department of Life Science and Institute of Fisheries Science, National Taiwan University, Taipei, Taiwan 106, ROC
abstract. Today, there are only two information sources about Anguilla anguilla mtDNA D-loop region haplotypic variety and both are quite old. Our research group updated the ten year-old mtDNA D-loop region database of 80 sequences by adding the homological sequences of 45 European eels caught in Lithuanian territorial waters, i.e., in the Baltic Sea, the Curonian Lagoon, and in inland Lakes Dringis and Siesartis. Even 37 unique haplotypes of European eel were found. Based on all available mtDNA D-loop sequence data, 115 polymorphic sites (S), 132 mutations (η), 0.9965 (± 0.002) overall haplotype diversity (H) and 0.02523 nucleotide diversity (π) were determinated. No significant clustering related to the sampling location was identified after the evaluation of the distribution patterns of different haplo-types in the phylogenetic tree constructed using 125 European eel mtDNA D-loop sequences. However, limited genetic differentiation based on geographic distribution of some haplogroups of A. anguilla be-came evident after the refinement of haplotype relationships using a network approach. The ambiguous clustering of specimens representing geographically related sampling locations in the phylogenetic tree derived using the neighbor-joining method and a non-random distribution of some haplotypes in the median joining network are discussed.
Key words: A. anguilla, European eel, mtDNA, D-loop, haplotype, panmixia, IBD, IBT
I
ntroductIonVariation within and between populations and stock discrimination within exploited species are important issues not only for fisheries management, but also for conservation programmes (Okumuş & Çiftci 2003). Molecular genetic studies of natural populations are dependent on polymorphic neutral markers and offer the possibility to investigate the population structure, to provide scientific data for the regulation of harvest in order to protect weaker populations and, finally, to enable the long-term management of fisheries resources (Çiftci & Okumuş 2002). However, many commercially exploited marine fish species exhibit no or a low degree of genetic differentiation in neutral marker genes. The lack of genetic differentiation, typically attributed to a high degree of gene flow in the marine environments, sometimes supports the thinking that genetically indis-tinguishable stocks can be managed as one panmictic population (Cano et al. 2008).
European eel (Anguilla anguilla (L.)) is a facultatively catadromous (Lin et al. 2007) commercially exploited fish (Huertas & Cerdà 2006; Trautner 2006), the catches of which started to decline in Europe a few decades ago (Palstra et al. 2006; Maes & Volckaert 2007). At the moment, the stock is outside safe biological limits
(Åström & Dekker 2007), therefore this species has been recently added to Appendix II of the CITES Red List of Endangered Species (Maes & Volckaert 2007). Due to the complex life cycle of European eel (Van Ginneken et al. 2007; Bonhommeau et al. 2008), the conservation and management of this species is a diffi-cult task, therefore many 30 year-long efforts to produce economically profitable quantities of eels in aquaculture failed (Maes & Volckaert 2007). Thus, future stu dies on the genetics of A. anguilla should focus on the conservation issues and evolution history of this fish with the aim of integrating genetics into management (Maes & Volckaert 2007). While the panmixia status of this species is on debate (Dannewitz et al. 2005; Maes & Volckaert 2007; Wysujack 2007), the restocking strategy for this fish should be viewed with precaution (Sruoga et al. 2007).
In most species, mtDNA is highly variable and there-fore is a good marker for detecting possible genetic differentiations (Okumuş & Çiftci 2003), however, few attempts were made to study A. anguilla mtDNA using the direct sequencing of cytochromes or D-loop sequences (Lintas et al. 1998; Daemen et al. 2001). To our knowledge, only Daemen et al. 2001 reported the results about European eel mtDNA cytochrome b and four microsatellite loci, and only Lintas et al. 1998
published the article with the description of 55 A. an-guilla mtDNA D-loop sequences. Data on the combined European eel mtDNA D-loop and cytochrome b (cyt b) (Murgia et al. 1998) are still unpublished (sequence data are deposited in GenBank). Moreover, due to unclear reasons, A. anguilla mtDNA D-loop investigations were terminated 10 years ago. Therefore, a new investigation into D-loop haplotypic diversity of A. anguilla with utilisation of DNA sequencing data deposited in Gen-Bank under accession numbers AJ225953-AJ226007 and AJ246983-AJ247007 was initiated by our research group in order to get a better understanding of intraspe-cific genetic variability of this species.
The main goals of the investigation are to: 1) update the European eel mtDNA D-loop region sequence database; 2) test the median joining network method for the recovery of the evolution history of this species; 3) verify the pan-mictic status of European eel; 4) increase the knowledge about A. anguilla mtDNA D-loop haplotypic diversity; 5) find out if the haplotype variety of predominantly natu-rally recruited European eels caught in the Baltic Sea and in the Curonian Lagoon differs from that of introduced eels from Lakes Dringis and Siesartis; 6) provide new informa-tion for the conservainforma-tion for this species.
M
aterIalandMethodsSampling
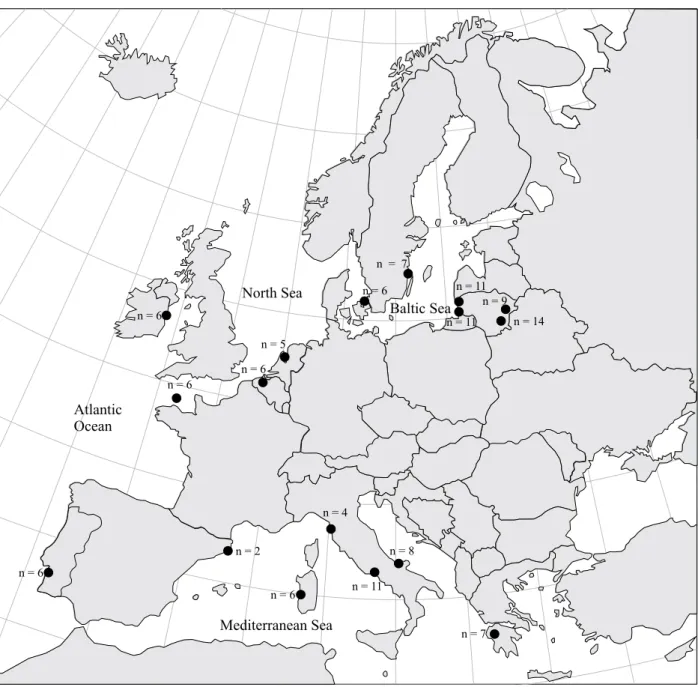
During this research, a total of 45 European eels were investigated. Animals were caught during the period 2004–2006 in the Lithuanian territorial waters of the Baltic Sea, Curonian Lagoon, Lake Dringis and Lake Siesartis (Fig. 1).
DNA extraction and amplification
DNA was extracted using universal and rapid salt-extraction of genomic DNA for PCR-based analysis (Aljanabi & Martinez 1997). DNA was extracted from frozen or ethanol preserved muscle tissue. In some cases, DNA was extracted using blood samples.
Instead of a primer pair created for A. japonica and A. marmorata by Lintas et al. 1998, which enabled the amplification of a 493 bp fragment of mtDNA (part of the tRNA for threonine, the tRNA for proline and part of the D-loop), a new primer pair (Ang1-F and Ang1-R), specific for A. anguilla, was created using the Primer 3 program (Rozen & Skaletsky 2000) and data from GenBank, i.e., comparison of all available mtDNA D-loop region sequences in Anguilla species enabled to choose the most suitable primer annealing area. Oligonucleotide primer sequences were as follows: 5’-TCGGTTTTGTAATCCGAAGA-3’ for Ang1-F and
5’-CCAAATGCCAGTAATAGTTCATTTTA-3’ for Ang1-R. The chosen oligonucleotides were synthesized by biomers.net GmbH.
PCR was performed using the Eppendorf Mastercycler gradient PCR machine. PCR volume for each sample was 25 μl and consisted of: 5 μl of genomic DNA at a concentration of approximately 50 μg/μl, 0.75 μl Taq DNA Polymerase LC (MBI Fermentas), 2.5 μl Taq buffer + KCl, 2.5 μl MgCl2, 2.5 μl 2 mM dNTP Mix,
1 μl of each oligonucleotide, i.e., Ang1-F and Ang1-R, and water.
Amplification started with an initial denaturation step for 5 min at 95°C, followed by 35 cycles of denatura-tion for 45 sec at 94°C, annealing for 45 sec at 54°C and elongation for 1 min at 72°C, ended with a final elongation step for 5 min at 72°C.
After amplification, 5 μl of each PCR product was mixed with 2 μl loading dye and then loaded in 1.5% agarose gel. AGE (Agarose Gel Electrophoresis) was carried out in for 1 hour at 100 V in the Pharmacia Gel GNA-100 apparatus. Agarose gel, after staining with ethidium bromide, was examined using the Biometra BioDocAnalyze apparatus. The amplified fragment was approximately 610 bp. Only well-amplified fragments were selected for sequencing after the incubation of 5 μl of amplificate mixed with 1 μl CIAP (MBI Fermentas) and 0.5 μl exonuclease I (MBI Fermentas) for 15 min at 37°C and 15 min at 85°C, re-spectively. Purified PCR products and the same primers Ang1-F and Ang1-R were used for DNA sequencing in the Sequencing Centre of the Institute of Biotechnology (Lithuania) using the Big-Dye® Terminator v3.1 Cycle
Sequencing Kit (Applied Biosystems, USA) and 3130xl Genetic Analyzer (Applied Biosystems, USA).
A. anguilla mtdna sequence analysis
After sequencing, chromatogram files were displayed and transferred to other programs using the CHROMAS 2.33 program (free software from www.technelysium.com.au). Newly detected A. anguilla mtDNA D-loop region se-quences were aligned together with 80 homological frag-ments determined by previous investigators (data on 55 European eel mtDNA sequences (AJ225953-AJ226007) (Lintas et al. 1998) and 25 European eel homological mtDNA sequences (AJ246983-AJ247007) (Murgia et al. 1998) deposited in GenBank). A total of 125 sequences were aligned together with one sequence of A. rostrata (AB030662) using the CLC Sequence Viewer 5.1.1 pro-gram (free software from www.clcbio.com).
The number of polymorphic sites (S), total number of mutations (η), haplotype diversity (H), nucleotide diver-sity (π) and θ were estimated using the DNASP 4.50.3 program (Rozas et al. 2003). θ values were estimated according to the infinite sites model (Ewens 1972) using
three different estimators: θS, θπ and θη (Tajima 1996).
The DNASP 4.50.3 program eliminated all positions containing gaps, except where otherwise stated. Most phylogenetic analyses were conducted in MEGA4 (Tamura et al. 2007), but all possible shortest and least complex phylogenetic trees were constructed using the median joining (MJ, Bandelt et al. 1999) option in the NETWORK 4.5.1.0 program (free software from www. fluxus-engineering.com/). The MEGA4 program eliminated from the dataset all positions con-taining gaps (complete deletion option), whereas the NETWORK 4.5.1.0 program calculated the positions
containing gaps. In MEGA4, the evolutionary history was inferred using the neighbour-joining method (NJ, Saitou & Nei 1987). The bootstrap consensus tree was inferred from 500 replicates (Felsenstein 1985). The evolutionary distances were computed using the Maximum Composite Likelihood method (Tamura et al. 2004) and are in the units of the number of base substitutions per site.
The rho statistic for time estimates was used first by Morral et al. 1994 under a different name and then ex-plored by Forster et al. 1996. The calculation of standard errors for rho was presented by Saillard et al. 2000.
Figure 1. Sampling locations of European eel during this research (small dots) and two earlier investigations (large dots):
Lintas et al. 1998 and Murgia et al. 1998 (article unpublished; data from GenBank). Sampling locations of earlier investiga-tions are approximate (particularly the samples from France).
Therefore, in this investigation rho statistic was selected for time estimations. Both rho and standard errors for rho were calculated using the NETWORK 4.5.1.0 program. Aoyama and Tsukamoto 1997 suggest that molecular evolution in eels may be much slower than in other animals, therefore an approximately four times slower mutation rate than that for human mtDNA in the stretch between np 16,090 and np16,365 was selected. Thus, one mutation in 80000 years was selected instead of one mutation in 20180 years (default option).
Based on DNASP 4.50.3 program θ values, the effective population female size was estimated according to θ = 2 Neμ model, with Ne – the effective population female size and μ – the mutation rate. The assumed mutation rate of 10-6 mutations per locus per generation in cyt
b in fishes (Canatore et al. 1994 cited in Daemen et al. 2001) allowed to presume that a mutation rate of 10-5
in the D-loop in A. anguilla should be sufficient for ap-proximate analyses, since mutations in the D-loop region accumulate faster than in other mtDNA regions. KXY, the divergence between groups of sequences as
measured by the uncorrected average number of nucleotide substitutions per site between populations (Nei 1987) and some other measures of the extent of DNA divergence among populations were calculated using the DNASP 4.50.3 program. Note that during these calculations gaps as the fifth state were considered. The obtained pairwise distances between populations were used for neighbour-joining analysis in MEGA4. The tree was drawn to scale, with branch lengths in the same units as those of the evo-lutionary distances used to infer the phylogenetic tree.
r
esultsdata on mtdna sequence variation
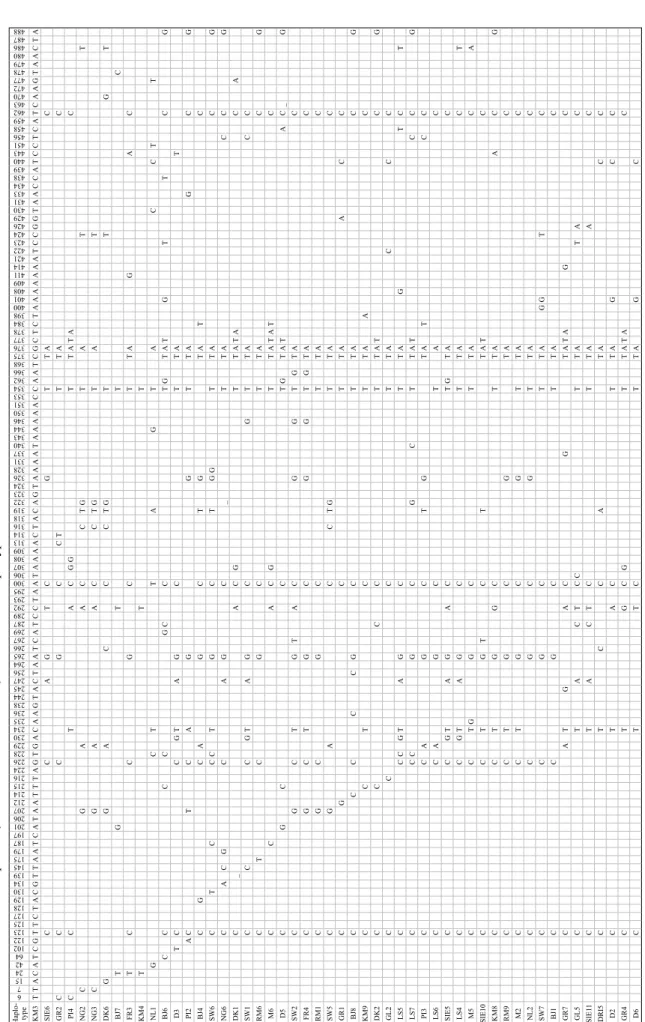
Based on a 493 bp fragment of mtDNA, 110 haplo-types were observed (Fig. 2). Consequently, all current knowledge about A. anguilla mtDNA 493 bp fragment variability are presented in Table 1. Currently, 36 new haplotypes are found in Lithuania (the sequences are deposited in the GenBank database under accession numbers FJ707255-FJ707280), but none of them was detected twice. Thus, comparison of 125 European eel sequences revealed 14 newly detected D-loop region sequences previously identified by other authors as haplotypes GL3 (2), FR4 (1), LS4 (1), M1 (5), NG1 (2), NG3 (1), NL2 (1), NL4 (1) and RM3 (1).
Using the DNASP 4.50.3 program, the following cal-culations (gaps excluded) were made: polymorphic sites (S) = 115, total number of mutations (η) = 132, overall haplotype diversity (H) = 0.9965 (± 0.002) and nucleotide diversity (π) = 0.02523.
phylogenetic tree
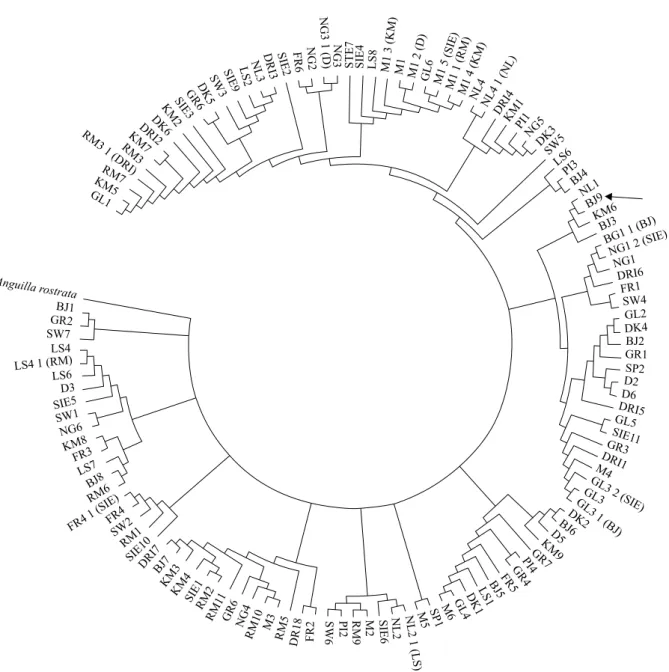
The phylogenetic tree derived from 125 European eel sequences and one homological sequence of American eel is presented in Figure 3. Comparison of the results derived from our phylogenetic tree and those of phy-logenetic analysis by Lintas et al. 1998 suggests the absence of any significant clustering related to sampling locations. However, in contrast to previous reports, one specific group of phylogenetically and geographically related haplotypes BJ3, BJ9 and KM6 was detected predominantly in the Lithuanian territorial waters of the Baltic Sea and the Curonian Lagoon (see arrow, Fig. 3), with one exceptional specimen NL1 detected in the Netherlands. Interestingly, NETWORK 4.5.1.0 MJ results (Fig. 4) also indicate that these four haplotypes belong to one phylogenetic group (D1).
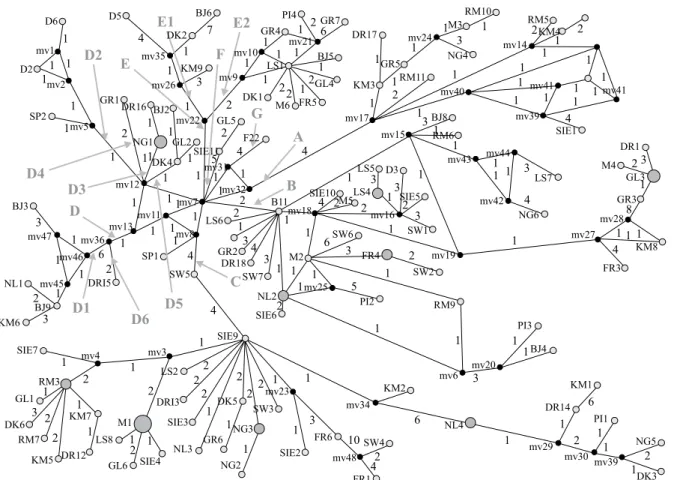
networks and haplogroups
More traditional methods developed to estimate inter-specific relationships, such as maximum likelihood, maximum parsimony and minimum evolution, cannot properly take account of the fact that, at the popula-tion level, several phenomena violate some of their assumptions (Posada & Crandall 2001). Interestingly, networks are appropriate representations of intraspecific genetic variation even if they also have some limitations (Posada & Crandall 2001). Consequently, one network programme was selected. All possible shortest and least complex phylogenetic trees were constructed using the NETWORK 4.5.1.0 program MJ option. The esti-mated number of mutations of the shortest tree in this intraspecific network was 319. According to the results presented in Figure 4, at least several haplogroups could be defined. In haplogroups A and B, smaller subgroups were not defined because it was impossible to determine correctly the number of additional subgroups. Haplogroup C was not divided into subgroups either, since it was not reasonable to split it into smaller units having only 1–2 representatives (in most cases). However, it is obvious that haplogroup C, like haplogroup B, can be separated into several subgroups. Since haplogroups F and G have only three representatives, only haplogroups D and E
Table 1. Current knowledge about A. anguilla mtDNA
(493 bp amplified fragment comprised of part of the tRNA for threonine, tRNA for proline and part of the D-loop noncoding region) haplotypes.
Haplotypes This research only (Lintas et al. 1998 and Earlier investigations Murgia et al. 1998) Total
Different 36 74 110
Repetition 9 6 15
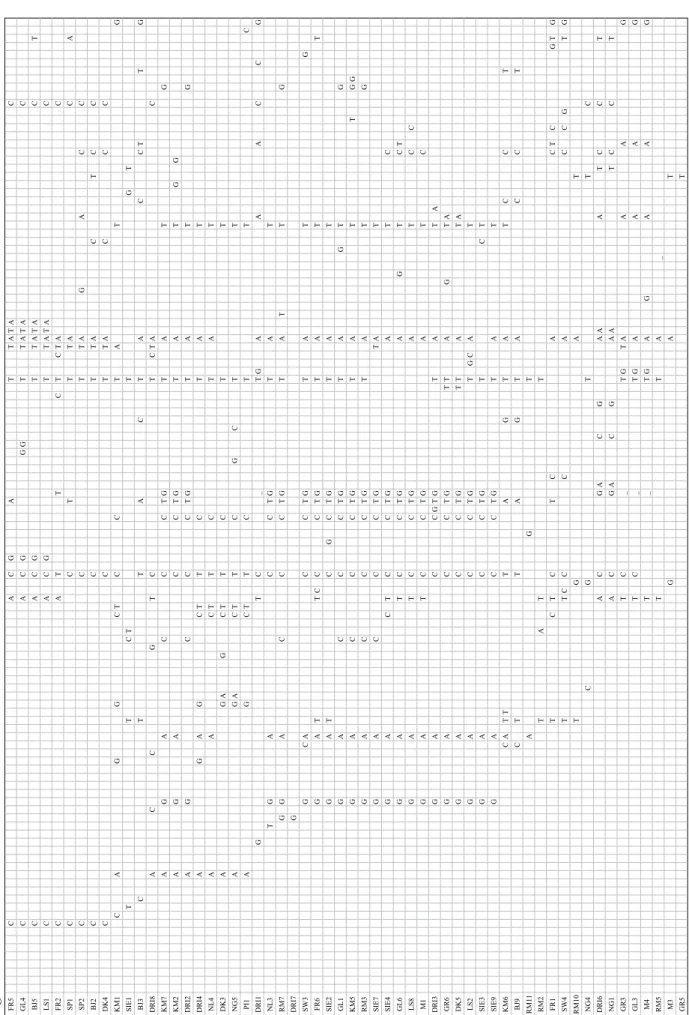
Figur e 2 . Summary of all dif ferent A. anguilla mtDNA (493 bp ampl ified fragment comprised of part of the tRNA for threonine, the tRNA for proline and part of the D-loop non-coding region) haplotypes. Data comprise the results of this research and two earlier investigations: Lintas et al. 1998 and Mur gia et al. 1998. All the rest sequences are given in
relation to the reference sequence (access number FJ707266) ascertained as haplotype KM3. Haplo
-type 6 715 24 42 64 102 122 123 125 127 128 129 130 134 139 145 175 179 187 197 201 206 207 212 214 215 216 224 226 228 229 230 234 235 236 238 244 245 247 256 264 265 266 267 269 287 289 292 293 295 300 306 307 308 309 313 314 316 318 319 322 323 324 326 328 331 337 340 343 344 346 350 351 353 354 362 366 368 375 376 377 378 384 398 400 401 408 409 411 414 421 422 423 424 426 429 430 431 433 434 438 439 440 443 451 456 458 459 462 463 470 472 477 478 479 480 486 487 488 KM3 T T A C A T C G T T C T A C G T T A A T C A T A A T T T A G T G A C A A G T A C T A A T C A T C C T A A T A A A A C T A C A G T A A A A T A A A A A C C A A T C G C T C T A A A A A A A T C C G G T A A C C A T C C T C A T C A A G T A A C T A SIE6 C C A G T C G T T A C GR2 C C C G C C T T T A C PI4 C C T A C G G T T A T A C NG2 C G A A C C T G T A T T NG3 C G A A C C T G T A T DK6 G G A C C C T G T T G T BJ7 T G T T C FR3 T C C G C T T A G A C KM4 T T T NL1 G C T T A G T A C C T T BJ6 C C C C G C C T G T A T G T T C G D3 T C C G T A G C T T A T PI2 A C T C A G G T T A G C G BJ4 C G C A G C T G T A T C SW6 C T C C C T G C T G G T T A C G NG6 C A C G C A G C _ T T A C C G DK1 C _ A C G T T A T A C A SW1 C C C G T A G C G T T A C C RM6 C T C G C T T A C G M6 C C A C G T T A T A T C D5 C G C C T G T A T A C _ G SW2 C G C T G T A C G G T G T A C FR4 C G C T G C G G T G T A C RM1 C G C G C T T A C SW5 C G A C C T G T T A C GR1 C G C T T A A C C BJ8 C C C C C G C T T A C G KM9 C C T C T T A A C DK2 C C C C T T A T C G GL2 C C C T T A C C C LS5 C C C G T A G C T T A G T C T LS7 C C C G C G C T T A T C C G PI3 C C A G C T G T A T C C LS6 C C A G C T A C SIE5 C C G T A G A C T G T A C LS4 C C G T A G C T T A C T M5 C C T G G C T T A C A SIE10 C C T G T C T T A T C KM8 C C T G G C T T A A C G RM9 C C T G C G T A C M2 C C T G C G T T A C NL2 C C G C G T T A C SW7 C C G C T T A G G T C BJ1 C C G C T T A C GR7 C A T G A C G T A T A G C GL5 C T A C T C C T T A T A C SIE1 1 C T A C T C T T A A C DRI5 C T C C A T A C C D2 C T A C T T A G C C GR4 C T G C G T T A T A C D6 C T T C T T A G C
Figur e 2 . Continued FR5 C A C G A T T A T A C GL4 C A C G G G T T A T A C BJ5 C A C G T T A T A C T LS1 C A C G T T A T A C FR2 C A T T C T C T A C SP1 C C T T T A C A SP2 C C T T A G A C C BJ2 C C T T A C T C C DK4 C C T T A C C C KM1 C A G G C T C C T A T G SIE1 T T C T T G T BJ3 C T T A C T A C C T T G DRI8 A C C G T C T C T A C KM7 A G A C C C T G T A T G KM2 A G A C C T G T A T G G DRI2 A G C C C T G T A T G DRI4 A G A G C T T C T A T NL4 A A C T T C T A T DK3 A G A G C T T C T T NG5 A G A C T T C G C T T PI1 A G C T T C T T C DRI1 G T C _ T G A A A C C G NL3 T G A C C T G T A T RM7 G G A C C C T G T A T T G DRI7 G SW3 G C A C C T G T A T G FR6 G A T T C C C T G T A T T SIE2 G A T C G C T G T A T GL1 G A C C C T G T A G T G KM5 G A C C C T G T A T T G G RM3 G A C C C T G T A T G SIE7 G A C C C T G T A T SIE4 G A C T C C T G A T C GL6 G A T C C T G A G T C T LS8 G A T C C T G A T C C M1 G A T C C T G A T C DRI3 G A C C G T G T A T A GR6 G A C C T G T T A G T A DK5 G A C C T G T T A T A LS2 G A C C T G T G C A T SIE3 G A C C T G T C T SIE9 G A C C T G T A T KM6 C A T T T A G T A T C C T BJ9 C T T A G T A C C T RM1 1 A G T RM2 T A T T FR1 T C T C T C A C T C G T G SW4 T T C C C A C C G T G RM10 T G A T NG4 C G T T C DRI6 A C G A C G A A A T C C T NG1 A C G A C G A A T C C T GR3 T C _ T G T A A A G GL3 T C _ T G A A A G M4 T _ T G A G A A G RM5 T T A _ M3 G A T GR5 T
were divided into smaller units. Haplogroup E was di-vided into two clearly separated subgroups. It should be noted that subgroups combined into haplogroup D could be distinguished as different branches, since NETWORK revealed a few possible ways for some branches. In order to find out if all haplogroups and subgroups are defined correctly, further investigations are necessary.
time estimates
The application of the median joining network, con-structed using only one available A. rostrata sequence and 125 A. anguilla sequences, showed that haplogroup B was the most similar to A. rostrata sequence. It took
at least 1320000 ± 226274 years for haplogroup B to evolve from the ancestor of these two species. It seems that at least 560000 ± 80000 years have passed since all other haplogroups evolved from ancestral haplogroup B. The above calculations suggest that the evolution of haplogroups A and C–G has lasted not less than 844138 ± 125846 years. Consequently, the estimated divergence times obtained by our research group appeared to be a bit shorter in comparison to those of earlier reports suggesting that A. rostrata and A. anguilla speciation occured between 3 (Daemen et al. 2001) and 10 (Aoyama & Tsukamoto 1997) MA (million years ago).
Figure 3. Evolutionary relationships of 126 taxa (A. rostrata sequence accession number in GenBank is AB030662). The
evo-lutionary history was inferred using the neighbor-joining method. The bootstrap consensus tree inferred from 500 replicates. Specimens with same haplotypes have different names with additional numbers and sampling location indications.
Female effective population size
The female effective population size (Ne) calculated according to θπ, θS and θη estimators are presented in
Table 2. Based on the absence of significant differ-ences between previous sequencing data (Murgia et al. 1998; Lintas et al. 1998) and the results obtained in this research, we suggest that there was no appar-ent bottleneck in A. anguilla population during the last decade.
population structure
Characteristics of the A. anguilla population, which was divided into subpopulations depending on large scale and small scale geographic regions, were derived from
mtDNA D-loop region sequences (Table 3). The aver-age number of nucleotide differences (K) was largest in the hypothetical northern A. anguilla subpopulation which included the samples from the Curonian Lagoon, the Baltic Sea and the North Sea. Despite complex evolutionary relationships among different haplogroups in the haplotypic network, we focused our attention on close evolutionary relationships of individuals attributed to haplogroup D1. Among four individuals from the northern subpopulation, three individuals with given haplotypes were detected only in the inshore area of the Baltic Sea and in the Curonian Lagoon (Lithuanian territorial waters), whereas the fourth one was caught in the Netherlands (haplotype NL1). So, it seems that part
Figure 4. Network of 125 A. anguilla sequences. Numbers between nodes indicate mutational steps, node sizes are proportional
to frequencies, mv (any number) is median vectors, i.e., hypothetical sequences which were not found.
Table 2. Comparison of female effective population size (Ne) values derived from θS, θπ and θη estimators calculated using data obtained by three different research groups.
Investigation Investigated sequences θ Estimator Ne
π θS θη
Our research group 45 0.02666 0.03771 0.04048 1333 1885 2024
Murgia et al. 1998 25 0.02659 0.03544 0.03642 1329 1772 1821
of European eels living in the North Sea and the Baltic Sea differs from the rest of the A. anguilla population, though the overall genetic differentiation between arti-ficially composed subpopulations is not significant. Comparison of eels representing low scale subpopula-tions, such as of the inshore zone of the Baltic Sea and the Curonian Lagoon, revealed that the average number of nucleotide differences (K) between these two low scale subpopulations was different. Higher K values were detected among the samples representing the Baltic Sea subpopulation. However, it is not surprising that the Baltic Sea eel subpopulation occupies the largest water body as compared to other small scale sampling areas (Curonian Lagoon and two inland lakes). According to the results obtained by Shiao et al. 2006 from otolith analysis, about 20% of European eels caught in the Curonian Lagoon originated from the stock of intro-duced eels. Thus, theorethically it is possible to detect the recurrence of the same haplotypes in the Curonian Lagoon, i.e., the K value for the lagoon should be lower than in the Baltic Sea sample. This assumption was partly confirmed by the detection of animals with haplotype M1 both in Curonian Lagoon and in Lake Siesartis samples.
Haplotype M1 is the most common A. anguilla haplo-type, which, besides Lithuania, was also found in Ireland and Italy, therefore the possibility of natural recruitment of MI-haplotype eels found in the Curonian Lagoon can-not be excluded. Regardless of this, it is more likely that MI-haplotype individuals (attributed to haplogroup C) migrated to the Curonian Lagoon after they escaped from inland lakes. It should be noted that haplogroup C representatives have not yet been detected in the Baltic Sea near Lithuania, althought the representatives of this haplogroup have been observed in the Baltic Sea near Sweden (Fig. 5).
Two NJ trees based on the mean number of pairwise nucleotide differences between populations (KXY) are presented in Figure 6. With regard to overall genetic similarity, the Curonian Lagoon sample as compared to the Baltic Sea sample seems to be closer to the sam-ples of introduced eels from Lake Dringis and Lake Siesartis, at least on a small geographic scale. The pooling of samples into subpopulations representing large scale geographic differentiation revealed diffe- rences between the hypothetical northern subpopulation comprised of Curonian Lagoon, Baltic Sea and North Sea samples and the other two hypothetical subpopula-tions representing the Atlantic and Mediterranean pools of haplotypes. As for the Lithuanian case, it seems that the sample representing introduced eels should not be attributed to any of the three hypotetical A. anguilla subpopulations. It is obvious that introduced eels could be recognised as possessing a haplotypic pool which is intermediate between the northern and the rest of the European population.
d
IscussIonHaplotype variety
New results based on A. anguilla mtDNA D-loop region sequencing obtained in this study renewed investiga-tions of haplotypic variability in European eel initiated by two research groups in 1998 (Lintas et al. 1998; Murgia et al. 1998, unpubl. data). It has become obvi-ous that at least this particular species displays a wide mtDNA D-loop region variety: a total of 111 different haplotypes were found among the 125 animals inves-tigated. Comparable data on haplotypic variability in the mtDNA cytochrome b partial sequence of Anguilla species were provided by another research group
(Dae-Table 3. Characteristics of A. anguilla populations: 1) hypothetical population divided into Atlantic, Mediterranean and
north-ern subpopulations, and introduced eels caught in Lithuanian inland waters; 2) Lithuanian samples of eels representing the Baltic Sea, Curonian Lagoon, Lake Dringis and Lake Siesartis (n – samples, S – polymorphic sites, H – haplotype diversity, K – average number of nucleotide differences).
Analysis Population n Haplotypes S H K
1) Atlantic 18 18 55 1 12.90196 Mediterranean 38 36 64 0.99716 11.57610 North 46 43 90 0.99710 13.82029 Introduced 23 23 51 1 12.71542 Total 125 110 119 0.99652 12.88452 2) Baltic Sea 11 11 47 1 13.94545 Curonian Lagoon 11 10 39 0.98182 12.29091 Lake Dringis 9 9 41 1 13.55556 Lake Siesartis 14 14 39 1 12.47253 Total 45 41 75 0.99495 13.19899
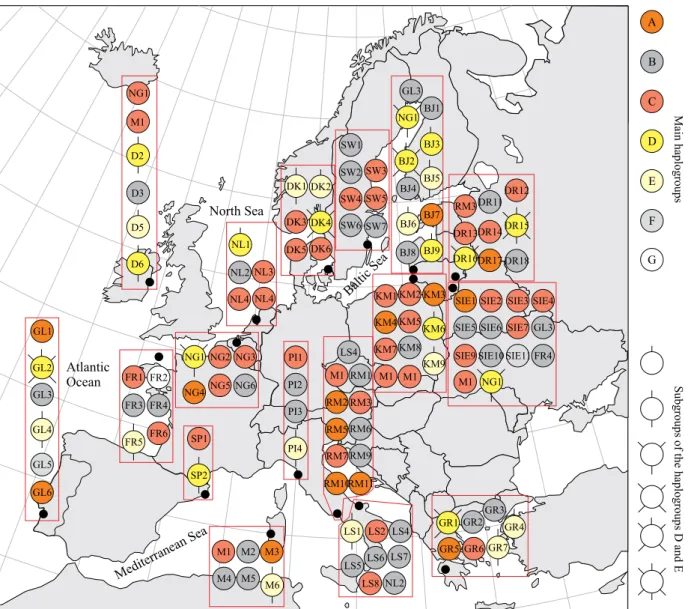
Figure 5. Distribution of haplotypes listed according to sampling locations (small dots represent our research areas, large
dots indicate areas studied by other authors): GL (Portugal, Atlantic coast), SP (Spain, Barcelona), M (Italy, Cabras Lagoon), PI (Italy, Pisa), RM (Italy, Rome, Tiber River, LS (Italy, Lesina Lagoon), GR (Greece, Messolonghi Lagoon), D (Ireland, Dublin), FR (France, West Coast), NG (Netherlands, Rhine River), NL (Netherlands, Niew Koop Lagoon), DK (Denmark, Copenhagen, Lake Arresø), SW (Sweden), BJ (Lithuania, Baltic Sea), KM (Lithuania, Curonian Lagoon), DRI (Lithuania, Lake Dringis), SIE (Lithuania, Lake Siesartis). Spectrum of colours represents different haplogroups, D and E haplogroups divided into subgroups, different subgroups have different shape. Some haplotypes found in different sampling areas were named according to one sampling location. Sampling locations of earlier investigations are approximate.
men et al. 2001). The investigation of 107 A. anguilla mtDNA cytochrome b (392 bp) sequences revealed only 17 different haplotypes, 10 of which were singletons (Daemen et al. 2001). Thus, the mutation rates in the A. anguilla mtDNA cytochrome b sequence are more than six times lower than those in the mtDNA D-loop region.
network and haplogroups
Studies on European eel were initiated more than 100
years ago and hypotheses concerning its population structure were tested using newly developed techniques every time they appeared (Maes & Volckaert 2007). In-traspecific gene evolution cannot always be represented by a bifurcating tree because traditional methods for estimating phylogenies are not designed and might not be adequate for within-species phylogeny (Posada & Crandall 2001). Unfortunately, only bifurcating trees have been used so far in the investigations of A. anguilla and A. japonica within-species phylogenies. Therefore,
a considerable amount of valuable information about these species has been missed. Consequently, previous investigations (Lintas et al. 1998; Sang et al. 1994 and Ishikawa et al. 2001) failed to reach full potential, i.e., valuable information which could have been obtained from A. anguilla and A. japonica D-loop region vari-ability was omitted. Nevertheless, the accumulated data could be used as initial database for future investiga-tions.
A wide mtDNA D-loop region haplotype variety allowed, instead of haplotypes, to use a haplogroup category as the most appropriate category to estimate the connection between the sampling location and genetic variability. Since a network based approach can incorporate popu-lation processes in the construction of the refinement of haplotype relationships and enable a more detailed dis-play of population information than strictly bifurcating trees (Posada & Crandall 2001), haplogroup category was quite informative when used for evaluation of phyloge-netic relationships among different A. anguilla samples. Several main haplogroups, i.e., A-G, and a few subgroups of haplogroups D and E, were defined after a detailed evaluation of the haplotypic network. It should be taken into account that if new haplotypes are detected during further investigations, some branches of the network might change, but the probablility of dramatic changes in phylogenetic relationships between the defined haplo-groups is very low. Actually, it is very important for future research to use historical material and/or new sampling regions, as well as all possible information about otolith investigation results, other genetic markers, etc.
A. anguilla and A. rostrata speciation and european
eel within-species evolution
A. anguilla and A. rostrata speciation dates from 3 (Dae-men et al. 2001) to 10 (Aoyama & Tsukamoto 1997) MA. New A. anguilla and A. rostrata speciation time estimates are in accordance with the results of earlier studies. Time estimates obtained in this study also show that the time of divergence of these two species is near 3 MA. It could be assumed that after the speciation event haplogroup B was formed as one of the most ancestral haplogroup of A. anguilla that still has representatives even today. The pattern of haplotypic network structure (Fig. 4) suggests that after A. anguilla and A. rostrata speciation only one European eel evolution branch occurred, from which all presently found haplogroups evolved. Since the evolution of haplogroups A and C-G is estimated to be approximately 0.85 million years, we suggest that the within-population divergence in A. an-guilla species lasted for at least ~2 MA. According to cyt b investigation results by Daemen et al. 2001, time estimates of within-population divergence were 1.9–3.8 million years before present. In order to get a better understanding of A. anguilla evolution, further more detailed investigations are necessary.
A. anguilla genetic differentiation complexity Panmixia in A. anguilla was widely accepted until three independent genetic studies (Daemen et al. 2001; Wirth & Bernatchez 2001; Maes & Volckaert 2002) reported evidence indicating a weak, but significant population structure (Dannewitz et al. 2005; Palm et
Figure 6. NJ trees of A. anguilla populations based on pairwise KXY distances between mtDNA haplotypes. At the top: rela-tionships among eel samples representing small scale geographic differences between some sampling locations in Lithuania. At the bottom: relationships between three hypothetical A. anguilla subpopulations and the sample of eels introduced into Lithuanian inland lakes.
al. 2009). Genetic differentiation in A. anguilla popu-lations could be explained not only by the isolation-by-distance (IBD) pattern (Wirth & Bernatchez 2001, 2003), but also by the role of temporal genetic variation (Maes & Volckaert 2002; Dannewitz et al. 2005). Tem-poral restriction on gene flow is called IBT to acknowl-edge its analogy with IBD. During the presence of IBT, variation in selection throughout the reproductive season may lead to adaptive temporal variation in phenotypic traits (adaptation-by-time) (Hendry & Day 2005). Actu-ally, isolation-by-time (IBT) is even more important in shaping the genetic structure of A. anguilla than IBD (Maes & Volckaert 2007).
Unfortunately, during this investigation temporal sam-ples were collected only from the Curonian Lagoon and Lake Dringis, thus discussions about IBT are not appropriate. Current knowledge about A. anguilla mtDNA D-loop region haplotype variety suggests the absence of IBD within this species. This view is supported by similar assumptions from earlier inves-tigations of the mtDNA D-loop region in A. anguilla and A. japonica (Lintas et al. 1998; Sang et al. 1994; Ishikawa et al. 2001). For example, a wide haplotype variety, low nucleotide diversity (π), node bifurcations of the NJ phylogenetic tree were not strongly supported. However, analysis of 125 European eel mtDNA D-loop region sequences without any additional information, i.e., otolith results, DNA microsatellites, etc., does not allow the conclusion about the absence of genetic differentiation within this species. Futhermore, even genetic homogeneity does not necessarily imply a single panmictic population (Lintas et al. 1998). Consequently, even a low level of geographical genetic differentiation at neutral molecular markers may lead to serious under-estimation of quantitative and adaptive differentiation between populations (Maes & Volckaert 2007). Interestingly, the employment of haplogroup category, demonstrated limited evidence of genetic differentia-tion in A. anguilla. Analysis of the haplotypic network (Fig. 4) showed that special attention should be focused on the haplotypes of subgroup D1, attributed to haplo-group D, because of a limited geographic area where the representatives of this subgroup were detected: they were found only in Lithuanian territorial waters and the Netherlands (haplotype NL1). The possibility that haplotypes of subgroup D1 were grouped according to geographic location accidentally seems to be unlikely. First, the values of populational parameters (n – number of the investigated eels, S – number of polymorphic sites and K – average number of nucleotide differences) derived from mtDNA sequences (Table 3) were much higher in the hypothetical northern A. anguilla popula-tion than in other hypothetical A. anguilla populapopula-tions.
Second, the haplotypes of subgroup D1 differ in very few mutational steps which suggest that they closely coevolved long enough to evolve into a haplotypic subgroup. Third, the paradigm that European eel con-stitutes a panmictic population is difficult to maintain because of recent evidence from the related studies (Daemen et al. 2001). Finally, the haplotypic network indicates that A. anguilla has never been a panmictic animal. Consequently, the definition of D1 as subgroup representing geographically and genetically connected individuals requires further investigations.
Diadromy in eels is more complex than simple separa-tion into catadromous and non-catadromuos individuals (Daverat et al. 2006). Actually, Daverat et al. (2006) identified more than six types of the main habitat use by eels. Interestingly, the types of habitat use were observed in different proportions in different geo-graphic regions (Daverat et al. 2006). However, it is still unknown whether this is due to a remnant genetic trait that determines if an individual enters freshwater or not, or if it is simply due to behavioural plasticity that enables each species to use the maximum range of habitats (Tsukamoto & Arai 2001). Evidence exists that semi-catadromous European eels live in the Baltic Sea (Tzeng et al. 2000), therefore further investigations of the mtDNA D-loop region, combined with otolith analysis, might yield valuable information about the discussed subject.
naturally recruited and introduced european eels in lithuania
According to Shiao et al. (2006), most of European eels which live in the Baltic Sea and in the Curonian Lagoon are naturally recruited, whereas all European eels that inhabit Lithuanian lakes are introduced from west European countries. The fact that the representa-tives of haplogroup E and the haplotypes of subgroup D1, though absent in inland lakes, were detected in the Baltic Sea, leads to conclusion that the haplotypic spectrum of naturally recruited eels differs from that of introduced eels. Furthermore, the representatives of hap-logroup C were not detected in the Baltic Sea, whereas the haplotypes of this haplogroup were common in the Curonian Lagoon and inland lakes. Such differences in the haplotypic spectrum between the Baltic Sea and the Curonian Lagoon are observed due to a significant percentage of introduced eels inhabitating the Curonian Lagoon. Our results, based on otolith analysis are in agreement with those reported by Shiao et al. 2006 indicating that at least 20% of eels migrate from inland lakes to the Curonian Lagoon. In the Baltic Sea, near Lithuania, introduced European eels account only for 2% of all eels living there (Shiao et al. 2006).
A. anguilla conservation
Challenges for genetic research on European eel ma- nagement were reviewed by Maes and Volckaert (2007). Accurate estimation of the effective population size is one of the most important aims in developing an appropriate conservation strategy for eels (Maes & Volckaert 2007). Our investigation results suggest that during the period of aproximately 10 years no bottleneck in the A. anguilla population probably occurred and that female effective population size was low.
Today, investigations of genetic differentiation of Eu-ropean eel populations based on the current mtDNA D-loop region sequence data are not statistically significant to confirm genetic differentiation between European eels living in the North Sea and Lithuanian territorial waters and the rest of the A. anguilla popu-lation. Nevertheless, limited evidence of genetic dif-ferentiation was found among European eel subpopula-tions based on the distribution patterns of evolutionary close haplotypes. Interestingly, limited evidence of genetic differentiation observed in the Baltic Sea was reported by Daemen et al. 2001. Recent work based on molecular markers has highlighted the possibility of the existence of local population structure within eel populations of Europe and North Africa (Kettle et al. 2008). Non-random distribution of individuals with evolutionary close haplotypes of subgroup D1 detected in the Baltic Sea and in the Curonian Lagoon during this investigation could be interpreted as evidence of natal homing and self-replenishment of local popula-tions recently described by Cano et al. 2008. Thus, we support the assumption that such phenomenon may be more common in marine fish than previously anticipated.
In order to make appropriate conclusions, a more rep-resentative A. anguilla mtDNA D-loop region database should be created. Therefore, combined investigations of the mtDNA D-loop region, other genetic markers and otoliths are urgent. Additional attempts should be made to connect haplotypic information with data on other genetic or ecological markers usefull for the develop-ment of a long-term managedevelop-ment strategy. Finally, the detection of negative changes and reductions in biologi-cal diversity will be impossible unless the amount and distribution of this diversity are systematically studied (Laikre et al. 2008).
a
cknowledgeMentsWe sincerely thank the reviewers Dr Jens Frankowski and Prof. Dr Habil. Isaak Rashal for valuable comments
that helped to improve the manuscript. This research would not have been possible without the financial support from the Ministry of Education and Science of the Republic of Lithuania and by the Mutual Fund of Lithuania, Latvia and Taiwan (Republic of China). Sin-cere gratitude should also be expressed to the Lithuanian Science Council and the Lithuanian State Science and Studies Foundation for Student Research Fellowship Awards and the PhD scholarship, respectively. Special thanks go to Michael Forster (Director of Fluxus Tech-nology Ltd.) for valuable advice using the Network programme.
r
eferencesAljanabi, S. M. and Martinez, I. 1997. Universal and Rapid Salt-extraction of High Quality Genomic DNA for PCR-based Techniques. Nucleic Acids Research 25 (22): 4692–4693.
Aoyama, J. and Tsukamoto, K. 1997. Evolution of the Fresh-water Eels. Naturwissenschaften 84: 17–21.
Åström, M. and Dekker, W. 2007. When will the eel Recover? A Full Life-Cycle Model. ICES Journal of
Marine Science 64: 1491–1498.
Bandelt, H. J., Forster, P. and Röhl, A. 1999. Median-Joining Networks for Inferring Intraspecific Phylogenies.
Mo-lecular Biology and Evolution 16: 37–48.
Bonhommeau, S., Chassot, E. and Rivot, E. 2008. Fluctua-tions in European eel (Anguilla anguilla) Recruitment Resulting from Environmental Changes in the Sargasso Sea. Fisheries Oceanography 17 (1): 32–44.
Cano, J. M., Shikano, T., Kuparinen, A. and Merilä, J. 2008. Genetic Differentiation, Effective Population Size and Gene Flow in Marine Fishes: Implications for Stock Management. Journal of Integrated Fish Science 5: 1–10.
Çiftci, Y. and Okumuş, İ. 2002. Fish Population Genetics and Applications of Molecular Markers to Fisheries and Aquaculture: I- Basic Principles of Fish Population Genetics. Turkish Journal of Fisheries and Aquatic
Sciences 2: 145–155.
Daemen, E., Cross, T., Ollevier, F. and Volckaert, F. A. M. 2001. Analysis of the Genetic Structure of European Eel (Anguilla anguilla) Using Microsatellite DNA and mtDNR Markers. Marine Biology 139: 755–764. Dannewitz, J., Maes, G. E., Johansson, L., Wickström, H.,
Volckaert, F. A. M. and Järvi, T. 2005. Panmixia in the European Eel: a Matter of Time. Proceedings of the
Royal Society B 272: 1129–1137.
Daverat, F., Limburg, K. E., Thibault, I., Shiao, J. C., Dodson, J. J., Caron, F., Tzeng, W. N., Iizuka, Y. and
Wickström, H. 2006. Phenotypic Plasticity of Habitat use by Three Temperate eel Species, Anguilla anguilla,
A. japonica and A. rostrata. Marine Ecology Progress Series 308: 231–241.
Ewens, W. J. 1972. The Sampling Theory of Selectively Neutral Alleles. Theoretical and Popular Biology 3: 87–112. Felsenstein, J. 1985. Confidence Limits on Phylogenies: An
approach using the Bootstrap. Evolution 39: 783–791. Forster, P., Harding, R., Torroni, A. and Bandelt, H. J. 1996.
Origin and Evolution of Native American mtDNA Variation: A Reappraisal. American Journal of Human
Genetics 59: 935–945.
Hendry, A. P. and Day, T. 2005. Population Structure Attri- butable to Reproductive Time: Isolation by Time and Adaptation by Time. Molecular Ecology 14: 901–916.
Huertas, M. and Cerdà, J. 2006. Stocking Density at Early Developmental Stages Affects Growth and Sex Ratio in the European Eel (Anguilla anguilla). Biological
Bulleten 211: 286–296.
Ishikawa, S., Aoyama, J., Tsukamoto, K. and Nishida, M. 2001. Population Structure of the Japanese eel Anguilla
japonica as Examined by Mitochondrial DNA
Sequenc-ing. Fisheries Science 67: 246–253.
Kettle, A. J., Heinrich, D., Barrett, J. H., Benecke, N. and Locker, A. 2008. Past Distributions of the Euro-pean Freshwater eel from Archaeological and Palae-ontological Evidence. Quaternary Science Reviews 27: 1309–1334.
Laikre, L., Larsson, L. C., Palmé, A., Charlier, J., Josefs-son, M. and Rayman, N. 2008. Potentials for Monitoring Gene Level Biodiversity: using Sweden as an Example.
Biodiversity Conservation 17: 893–910.
Lin, Y. J., Ložys, L., Shiao, J. C., Iizuka, Y and Tzeng, W. N. 2007. Growth Differences Between Naturally Recruited and Stocked European Eel Anguilla anguilla from Dif-ferent Habitats in Lithuania. Journal of Fish Biology 71: 1773–1787.
Lintas, C., Hirano, J. and Archer, S. 1998. Genetic Variation of the European Eel (Anguilla anguilla). Molecular
Marine Biology and Biotechnology 7 (4): 263–269.
Maes, G. E. and Volckaert, F. A. M. 2002. Clinal Genetic Variation and Isolation by Distance in the European Eel Anguilla anguilla (L.). Biological Journal of the
Linnean Society 77: 509–521.
Maes, G. E., Volckaert, F. A. M. 2007. Challenges for Ge-netic Research in European Eel Management. ICES
Journal of Marine Science 64: 1463-1471.
Morral, N., Bertranpetit, J., Estivill, X., Nunes, V., Casals, T., Giménez, J., Reis, A., Varon-Mateeva, R., Macek, M. et al. 1994. The origin of the major cystir fibrosis mutation (ΔF508) in European populations.
Nature Genetics 7: 169–175.
Murgia, R., Tola, G., Hirano, J. and Archer, S. N. 1998.
Genetic variation in Mediterranean fish determined from D-loop and cytochrome b mitochondrial DNA sequences. GenBank.
Nei, M. 1987. Molecular Evolutionary Genetics. New York: Columbia Univ. Press.
Okumuş, İ. and Çiftci, Y. 2003. Fish Population Genetics and Molecular Markers: II- Molecular Markers and Their Applications in Fisheries and Aquaculture. Turkish
Journal of Fisheries and Aquatic Sciences 3: 51–79.
Palm, S., Dannewitz, J., Prestegaard, T. and Wickström, H. 2009. Panmixia in European eel revisited: no genetic difference between maturing adults from southern and northern Europe. Heredity 103: 82–89.
Palstra, A. P., Van Ginneken, V. J. T., Murk, A. J. and Van den Thillart, G. E. E. J. M. 2006. Are Dioxin-like Con-taminants Responsible for the Eel (Anguilla anguilla) Drama? Naturwissenschaften 93 (3):145–153. Posada, D. and Crandall, K. A. 2001. Intraspecific Gene
Genealogies: Trees Grafting into Networks. Trends in
Ecology & Evolution 16 (1): 37–45.
Rozas, J., Sánchez-Delbarrio, J. C., Messeguer, X. and Rozas, R. 2003. DnaSP, DNA Polymorphism Analyses by the Coalescent and Other Methods. Bioinformatics 19: 2496–2497.
Rozen, S. and Skaletsky, H. J. 2000. Primer3 on the WWW for General Users and for Biologist Programmers.
Bioinformatics Methods and Protocols: Methods in Molecular Biology: 365–386.
Saillard, J., Forster, P., Lynnerup, N., Bandelt, H. J. and Nųrby, S. 2000. mtDNA Variation among Greenland Eskimos: the Edge of the Beringian expansion.
Ameri-can Journal of Human Genetics 67: 718–726.
Saitou, N. and Nei, M. 1987. The Neighbor-Joining Method: A New Method for Reconstructing Phylogenetic Trees.
Molecular Biology and Evolution 4: 406–425.
Sang, T. K., Chang, H. Y., Chen, C. T. and Hui, C. F. 1994. Population Structure of the Japanese Eel, Anguilla
japonica. Molecular and Biological Evolution 11 (2):
250–260.
Shiao, J. C., Ložys, L., Iizuka, Y. and Tzeng, W. N. 2006. Migratory Patterns and Contribution of Stocking to the Population of European Eel in Lithuania Waters as Indicated by Otolith Sr:Ca Ratios. Journal of Fish
Biology 69: 749–769.
Sruoga, A., Butkauskas, D., Ragauskas, A. and Ložys, L. 2007. Investigation of Genetic Variability in the Euro-pean Eel (Anguilla anguilla (L.)) in Lithuania Using Microsatellite DNA Markers. Acta Zoologica Lituanica 17 (2): 116–123.
Tajima, F. 1996. The Amount of DNA Polymorphism Main-tained in a Finite population when the Neutral Mutation Rate Varies among Sites. Genetics 143: 1457–1465.
Tamura, K., Nei, M. and Kumar, S. 2004. Prospects for In-ferring Very Large Phylogenies by Using the Neighbor-Joining Method. Proceedings of the National Academy
of Sciences (USA) 101: 11030–11035.
Tamura, K., Dudley, J., Nei, M. and Kumar, S. 2007. MEGA4: Molecular Evolutionary Genetics Analysis (MEGA) Software Version 4.0. Molecular Biology
and Evolution 24: 1596–1599.
Trautner, J. 2006. Rapid Identification of European (Anguilla anguilla) and North American Eel
(An-guilla rostrata) by Polymerase Chain Reaction. Inf. Fischereiforsch 53: 49–51.
Tsukamoto, K. and Arai, T. 2001. Facultative Catadromy of the Eel Anguilla japonica Between Freshwater and Seawater Habitats. Marine Ecology Progress
Series 220: 265–276.
Tzeng, W. N., Wang, C. H., Wickström, H. and Reizen-stein, M. 2000. Occurrence of the Semi-Catadro-mous European eel Anguilla anguilla in the Baltic Sea. Marine Biology 137: 93–98.
Van Ginneken, V., Durif, C., Balm, S. P., Boot, R., Ver-stegen, M. W. A., Antonissen, E. and Van den Thil-lart, G. 2007. Silvering of European Eel (Anguilla
anguilla L.): Seasonal Changes of Morphological
and Metabolic Parameters. Animal Biology 57 (1): 63–77.
Wirth, T. and Bernatchez, L. 2001. Genetic Evidence Against Panmixia in the European Eel. Nature 409: 1037–1040.
Wirth, T. and Bernatchez, L. 2003. Decline of North Atlantic Eels: a Fatal Synergy? Proceedings of the
Royal Society B 270: 681–688.
Wysujack, K. 2007. The Precautionary Approach and the Management of the European Eel (Anguilla
anguilla) – Critical Remarks. Inf. Fischereiforsch 54:
26–33.
u
pInIoungurIoA
nguillAAnguillA(l.)
Mtdnr
D-
kilposregionohaplotipųįvairovėD. Butkauskas, A. Ragauskas, A. Sruoga, L. Ložys, W.-N. Tzeng
santrauka
Iki šiol buvo tik du informacijos šaltiniai apie upinių ungu-rių Anguilla anguilla mtDNR D-kilpos regiono haplotipų įvairovę. Mes papildėme prieš dešimt metų sukurtą mtDNR D-kilpos regiono duomenų bazę 45 homologinėmis seko-mis, kurios reprezentuoja Baltijos jūroje, Kuršių mariose ir Dringio bei Siesarčio ežeruose neseniai pagautus upinius ungurius. Iš šių 45 sekų net 36 – iki šiol neidentifikuoti haplotipai. Remiantis A. anguilla DNR sekų duomenimis iš Genų banko, buvo nustatyti šie parametrai: S = 115, η = 132, H = 0.9965 (± 0.002) ir π = 0.02523. Panaudojus 125 upinių ungurių duomenis, pagal mtDNR D-kilpos sekas sukonstruotame NJ filogenetiniame medyje akivaizdaus haplotipų grupavimosi pagal žuvų pagavimo vietoves neaptikta. Genetinės diferenciacijos įrodymai gauti kitu, haplotipų tinklo konstravimo metodu. Šiame darbe apta-riama A. anguilla vidurūšinė evoliucija, populiacinė struk-tūra, rūšies apsaugos aspektai ir NJ filogenetinio medžio bei haplotipų tinklo metodikų tinkamumas A. anguilla vidurūšinės evoliucijos tyrimams.
Received: 30 July 2009 Accepted: 16 December 2009