P-263
THE FOOT-OBSTACLE CLEARANCE IN NEGOTIATING OBSTACLES WITH DIFFERENT HEIGHTS IN THE HIGH-RISK ELDERLY
1Horng-Chaung Hsu,2Hong-Wen Wu, 2Hui-Fen Pan, 3Shu-Ya Chen, 3Hsiu-Chen Lin 1Department of Orthopedic Surgery, China Medical University Hospital, Taichung, TAIWAN
2School of Sports Medicine, China Medical University, Taichung, TAIWAN 3School of Physical Therapy, China Medical University, Taichung, TAIWAN
Summary/conclusions
The elders with high-risk of fall demonstrated less symmetry between lower limbs, inadquate reduction in step width, and wider range of greater toe-obstacle clearance of the lead-cross limb which could lead to increase the risk of tripping. The trailing limb is quantified to perform higher mobility in vertical and horizontal direction in relatively short swing duration.
Introduction
Tripping over obstacles is the most frequently noted cause of falls and fall-related injuries in the elderly [1-2]. Adequate foot lift distance and speed are the key points to avoid inappropriate foot-obstacle contact and tripping. Foot clearance during obstacle negotiating is important in organizing the kinematics of joints of the swing limb. [3-4]
Statement of clinical significance
The quantitative kinematics could serve as a reference in assessing falling risk in the elders. And the inducted symmetry index results provide an intuitive guideline while screening and assessing the effectiveness of intervention for the elderly.
Methods
Twenty community-dwelling elders aged over 55-year-old were randomly picked from list. Based on the Tinetti Gait and Balance Test of the Performance- Oriented Assessment of Mobility Score (POMA) the subjects were divided into two groups, low-risk of fall and high-risk of fall [5]. The elders were asked to perform stepping over the obstacles (height adjusted to 0, 10, 20, 30 percent of leg length) at their self-prefered manner. The VICON Motion Analysis system and the reflective markers were used to estimate the kinematic parameters.
Results
The high-risk falling group revealed significant less step width but greater toe-obstacle clearance of the lead-cross limb. The higher obstacle led to increasing the maximum foot-obstacle clearance and the toe-obstacle distance, but resulted in shorter swing duration of the lead-cross-limb. The symmetry index revealed that most of the foot-obstacle clearance of trail limb were greater than lead limb, but accomplished in less swing time.
Discussion
For the elderly people living independent in the community, especially those high-risk falling, stepping over the higher obstacles is more challenges to the lower limbs. With the symmetry index results, even observe the obstacle negotiating pttern, could screen the falling risk and assessing the effectiveness of intervention for the elderly.
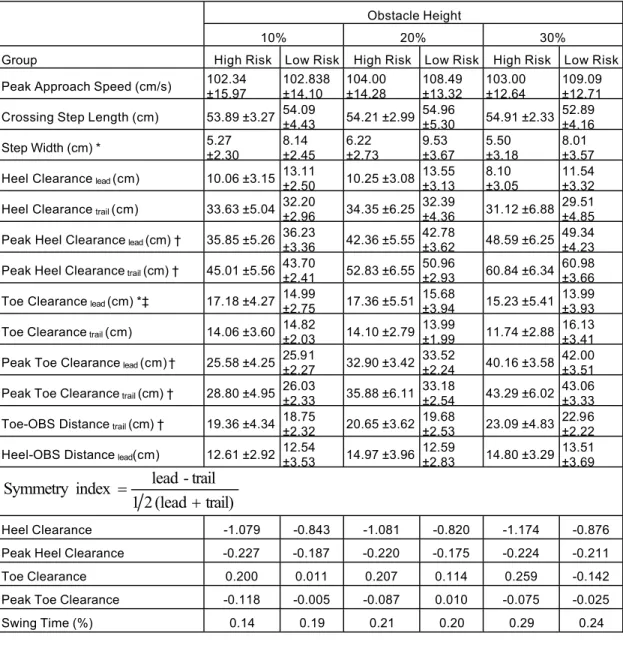
Table 1. Gait temporo-distance measurements for both groups crossing obstacles of different heights. Obstacle Height
10% 20% 30%
Group High Risk Low Risk High Risk Low Risk High Risk Low Risk Peak Approach Speed (cm/s) 102.34
±15.97 102.838 ±14.10 104.00 ±14.28 108.49 ±13.32 103.00 ±12.64 109.09 ±12.71 Crossing Step Length (cm) 53.89 ±3.27 54.09
±4.43 54.21 ±2.99 54.96 ±5.30 54.91 ±2.33 52.89 ±4.16 Step Width (cm) * 5.27 ±2.30 8.14 ±2.45 6.22 ±2.73 9.53 ±3.67 5.50 ±3.18 8.01 ±3.57 Heel Clearance lead(cm) 10.06 ±3.15 13.11
±2.50 10.25 ±3.08 13.55 ±3.13 8.10 ±3.05 11.54 ±3.32 Heel Clearance trail(cm) 33.63 ±5.04 32.20
±2.96 34.35 ±6.25 32.39
±4.36 31.12 ±6.88 29.51 ±4.85 Peak Heel Clearance lead(cm) † 35.85 ±5.26 36.23
±3.36 42.36 ±5.55 42.78
±3.62 48.59 ±6.25 49.34 ±4.23 Peak Heel Clearance trail (cm) † 45.01 ±5.56 43.70
±2.41 52.83 ±6.55 50.96
±2.93 60.84 ±6.34 60.98 ±3.66 Toe Clearance lead(cm) *‡ 17.18 ±4.27 14.99
±2.75 17.36 ±5.51 15.68
±3.94 15.23 ±5.41 13.99 ±3.93 Toe Clearance trail (cm) 14.06 ±3.60 14.82
±2.03 14.10 ±2.79 13.99
±1.99 11.74 ±2.88 16.13 ±3.41 Peak Toe Clearance lead(cm) † 25.58 ±4.25 25.91
±2.27 32.90 ±3.42 33.52
±2.24 40.16 ±3.58 42.00 ±3.51 Peak Toe Clearance trail (cm) † 28.80 ±4.95 26.03
±2.33 35.88 ±6.11 33.18
±2.54 43.29 ±6.02 43.06 ±3.33 Toe-OBS Distance trail(cm) † 19.36 ±4.34 18.75
±2.32 20.65 ±3.62 19.68
±2.53 23.09 ±4.83 22.96 ±2.22 Heel-OBS Distance lead(cm) 12.61 ±2.92 12.54
±3.53 14.97 ±3.96 12.59 ±2.83 14.80 ±3.29 13.51 ±3.69 trail) (lead 2 1 trail -lead index Symmetry + = Heel Clearance -1.079 -0.843 -1.081 -0.820 -1.174 -0.876
Peak Heel Clearance -0.227 -0.187 -0.220 -0.175 -0.224 -0.211
Toe Clearance 0.200 0.011 0.207 0.114 0.259 -0.142
Peak Toe Clearance -0.118 -0.005 -0.087 0.010 -0.075 -0.025
Swing Time (%) 0.14 0.19 0.21 0.20 0.29 0.24
* p- values (< 0.05) are for the High/ Low Groups ANOVA over all obstacle heights. † p- values (< 0.05) are for the OBS height ANOVA over all groups.
‡ p- values (< 0.05) are for the OBS height * Groups two-way ANOVA. References
[1] Overstall PW, Exton-Smith AN, Imms FJ, Johnson AL. Falls in the elderly related to postural imbalance. Br Med J 1977;1:261–4.
[2] Campbell AJ, Borrie MJ, Spears GF, Jackson SL, Brown JS, Fitzgerald JL. Circumstances and consequences of falls experienced by a community population aged 70 years and over during a prospective study. Age Ageing 1990;19:136– 41.
[3] Chen HC, Ashton-Miller JA, Alexander NB, Schultz AB Stepping over obstacles: gait patterns of healthy young and old adults. J. gerontol: Medical Sciences 1991; 46: M196–203
[4] Chou LS, Draganich LF. Increasing obstacle height and decreasing toe-obstacle distance affect the joint moments of the stance limb differently when stepping over an obstacle. Gait and Posture 1998; 8: 186-204.