Title Page
Authors:Wei-Chih Shen, Ph.D.
Department of Computer Science and Information Engineering, Asia University, Taichung, Taiwan
Shwn-Huey Shieh, Ph.D.
Department of Health Services Administration, China Medical University, Taichung, Taiwan
Ming-Hung Tsai, M.D.
Division of Gastroenterology, Department of Medicine, Tungs’ Taichung MetroHarbor Hospital, Taichung, Taiwan
Tzu-Liang Kung, Ph.D.
Department of Computer Science and Information Engineering, Asia University, Taichung, Taiwan
Wen-Hsin Huang, M.D.
Division of Hepatogastroenterology, Department of Internal Medicine, China Medical University Hospital, Taichung, Taiwan
Chun-Fu Ting, M.D.
Division of Hepatogastroenterology, Department of Internal Medicine, China Medical University Hospital, Taichung, Taiwan
Chun-Lung Feng, M.D.
Division of Hepatogastroenterology, Department of Internal Medicine, China Medical University Hospital, Taichung, Taiwan
Corresponding Author:
Chun-Lung Feng, M.D.
2 Yeu-Der Road, Taichung, 40447, Taiwan Tel: 886-4-22052121 ext 2233
Abstract
Purpose: The responses of polyps to light essentially determine the diagnostic capability of an
endoscopy system in differentiating adenomas from hyperplastic polyps. Compared with white light colonoscopy (WLC), narrow-band imaging (NBI) is expected to improve the diagnostic capability. The diagnostic capabilities of WLC and NBI are evaluated and compared based on the polyp responses.
Methods: The following WLC and NBI images were retrospectively reviewed and categorized: 195
images and polyps (89 WLC, 106 NBI) with the best visual quality were categorized in the best image group (BG), and 484 images of 242 polyps (both WLC and NBI) were categorized in the paired image group (PG). For each reflection of light used for WLC or NBI, the polyp responses were objectively expressed as reflection features. The reflection features were then used to establish a classification model for identifying adenomas. The diagnostic capability of reflection feature or classification model was measured by the area under the receiver operating characteristic curve (AUC).
Results: In both image groups, the diverse and heterogeneous features of the polyp responses
enabled accurate identification of adenomas, regardless of the light source used for WLC and NBI. For differential diagnosis of adenomas and hyperplastic polyps, the WLC and NBI did not significantly differ in BG (AUC, .905 and .922, respectively; P = .690) or in PG (AUC, . 782 and . 769, respectively; P = .755).
colorectal polyps and exhibited similar capabilities.
Keywords: White light colonoscopy (WLC), narrow-band imaging (NBI), colorectal polyp,
adenoma, diagnostic capability
Colorectal cancer is generally defined as the progression from preexisting adenomas via an adenoma–carcinoma sequence [1, 2]. Early detection and removal of adenomas provides an opportunity for screening and preventing colorectal cancer and may substantially reduce its mortality and incidence [3, 4]. The use of diagnostic endoscopy has changed from diagnosing clearly visible abnormalities to detecting subtle abnormalities that can be treated at early and curable stage. Thus, endoscopic criteria for identifying adenomas must be sufficiently precise to avoid overestimating hyperplastic polyps and the risk of overtreatment.
The new lighting system used in narrow-band imaging (NBI) endoscopy is expected to improve differential diagnosis of colorectal polyps compared with conventional white light colonoscopy (WLC) [5-8]. Performances of WLC and NBI in terms of differentiating adenomas from hyperplastic polyps have been compared by the evaluation of polyp characteristics, e.g., Kudo pit pattern [8-11], capillary pattern [12], and surface vascular pattern [13]. The comparisons generally agree that WLC has relatively inferior and inconsistent diagnostic accuracy [8-13]. The diagnostic accuracy of NBI is also reportedly equivalent to [10-12] or inferior to [8] optimal chromoendoscopy. However, magnification, an extra expense, affects the performance of NBI in evaluating polyp characteristics. Interpretation of endoscopic findings is highly subjective and varies among endoscopists, especially those with limited experience and skill in NBI [14, 15], who require specialized training to improve their abilities [14].
The polyp responses to light emitted from a lighting device determine the capability of an endoscopy system to identify abnormalities. The formation and storage of endoscopic images may
also affect the assessment of polyp characteristics. Since WLC simulates daylight color temperatures by emitting the entire visible light spectrum, it effectively captures the natural color of mucosae [6, 7]. Light penetration is deep in the red band, superficial in the blue band, and intermediate in the green band [6, 8]. The reflections of red, green, and blue (RGB) lights are assigned to their corresponding color channels of WLC image. In contrast, NBI emits narrowed blue light (NBL) and narrowed green light (NGL) for illumination because short wavelengths are within the hemoglobin absorption band [5, 8]. However, to create a NBI image three reflections are needed to be assigned to its RGB channels. Thus, the NBL reflection is assigned to the green and blue channels, and the NGL reflection to the red channel. In both techniques, polyp responses reflecting mucosal details at various depths are compressed into a flattened plane and represented as synthesized RGB colors. Endoscopic images were also electronically stored in Joint Photographic Experts Group (JPEG) format. During the image compression and decompression processes, the reflections stored in the various channels showed varying severity of distortion [16, 17]. Distortion could obscure or change the mucosal details stored in an endoscopic image.
This study used WLC and NBI as classification models, each including a set of reflection features with the strongest association with adenomas. The reflection features are defined to express the polyp responses in individual reflections of the light source and then objectively measured by a computerized method. Compared with the polyp characteristics defined in the superimposed reflections and subjectively evaluated by the endoscopist, the novel reflection features essentially and objectively describe the polyp responses in terms of the light source used by an endoscopy system.
The light source used to identify adenomas can be measured in terms of the relationship between reflection features and pathology results. Moreover, WLC and NBI were also evaluated for use as classification models for differentiating between adenomas and hyperplastic polyps.
MATERIAL AND METHODS
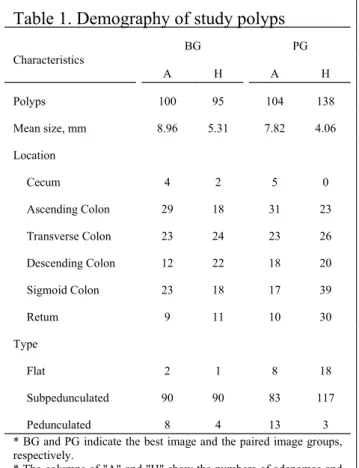
PatientsThis study was approved by the institutional review board at China Medical University Hospital (CMUH; CMUH102-REC2-031), Taichung, Taiwan. All images of the consecutive people who had received a total colonoscopy (EVIS LUCERA system CV-260, Olympus Optical, Tokyo, Japan) from January, 2010 to September, 2012 were retrieved from the PACS system at CMUH. The endoscopic specimens were evaluated by experienced pathologists based on the World Health Organization (WHO) criteria, and the diagnosis was regarded as the gold standard. All images were obtained by several different endoscopists using either WLC or NBI without magnification. All images were individually reviewed with a focus on image quality by a consensus of the attending authors, each of whom had at least 8 years of experience performing colonoscopies. Images with moderate brightness and a thoroughly washed polyp indicating that the mucosa details were not obscured were categorized as the best image group (BG). The BG comprised 89 WLC images (46 hyperplastic polyps, 43 adenomas) and 106 NBI images (49 hyperplastic polyps, 57 adenomas). Of these, 25 polyps, 16 hyperplastic polyps and 9 adenomas, identified by both WLC and NBI were categorized as BG. Both WLC and NBI images of a polyp were assigned to the paired image group
(PG) despite variations in brightness or incomplete washing of the mucus overlying the contained polyp. Thus, the PG comprised 484 WLC and NBI images (242 polyps, 138 hyperplastic polyps and 104 adenomas). Table 1 shows the demographics of the study polyps in both image groups.
Polyp identification
The WLC and NBI images were analyzed with a computer-aided diagnosis (CAD) system developed by the authors (Fig. 1A). The polygon delineating the outline of a polyp was manually specified (Fig. 1B). The shadowed or noisy areas overlying the identified polyp were excluded from the defined polygon. The overexposed areas within the polygon were detected and excluded automatically by the CAD system. Three reflections were then decomposed from the RGB components of each endoscopic image (Fig. 1C).
Definition of reflection features
For each reflection, the intensities within the polygon indicating the polyp responses to the light used were considered as a distribution and shown as a histogram (Figs. 1D-F). Intensities ranged from 0 to 255; a high value indicated a high reflectance or a low absorption. The intensity distribution used to characterize the polyps were described in terms of four reflection features:
The central tendency of the distribution efficiently indicates incident light absorption and is expressed as
Mean=
∑
(x , y)∈polyp
I( x , y)
N (1)
where I(x, y) is the intensity at position (x, y) and N is the size of the polyp. For the measurements of diversity of intensity in proximity to mean, standard deviation (SD) is expressed as
SD=
√
∑
(x , y)∈polyp
(I ( x , y )−Mean)2
N−1 . (2)
Skew is applied to characterize the degree of asymmetry of the mean and is expressed as
Skew= n (n−1)(n−2)(x , y
∑
)∈polyp (I ( x , y )−Mean SD ) 3 . (3)The probability (P) of these intensities is obtained using
P (i)=frequency(i)
N (4)
where frequency(i) indicates the number of pixels in the polyp with intensity i. Finally, entropy is defined to observe the heterogeneity of reflection intensities as
Entropy=−
∑
i=0
255
P (i)∗log
(
P (i))
(5).Statistical methods
The BG and PG were examined separately in all analyses. The responses of adenomas and hyperplastic polyps to the light source were presented in boxplots, and their difference was measured by Student’s t-test. In addition to comparing the means of two paired samples, paired t-test was used to verify the reliability. Diagnostic capability was examined based on the area under the receiver operating characteristic curve (AUC). Significant differences between two capabilities were identified by chi-square test. Binary logistic regression was used to construct the classification model
with the best feature set for identifying adenomas. The K-fold cross-validation method [18] was applied to verify the robustness of the constructed model. The enrolled cases were split randomly into 10 mutually exclusive subsets of similar size; moreover, the identified results of 10 subsets were combined to evaluate the diagnostic capability. In all tests, a P value less than .05 was considered statistically significant. The PASW statistical software was used for all statistical analyses [19].
RESULTS
Diagnostic capability for each light source in WLC
The differential diagnostic capability was examined based on the responses of adenomas and hyperplastic polyps to RGB lights (Fig. 2). The polyp responses in each reflection were expressed in terms of four features for red light (RLMean, RLSD, RLSkew, and RLEntropy), green light (GLMean, GLSD, GLSkew, and GLEntropy), and blue light (BLMean, BLSD, BLSkew, and BLEntropy). The findings showed that in PG, BLMean is significantly lower in adenomas than in hyperplastic polyps (P = .007). Although the absorptions of adenomas and hyperplastic polyps also altered their BLMeans in BG (P = .067) and
GLMeans in PG (P = .054), the difference was marginal. The SD and entropy for adenomas were both
significantly higher than those for hyperplastic polyps (P < .001), irrespective of light source and image group. The BLSkew was significantly lower for hyperplastic polyps than for adenomas in both BG (P = .029) and PG (P = .024).
Figure 3 shows the diagnostic capabilities of the reflection features in BG and PG, indicating that the capabilities of SD and entropy were all statistically significant (P < .001), irrespective of the
light source and image group. The AUCs of SD and entropy ranged from .843 (RLSD) to .907
(GLEntropy) in BG and from .697 (BLSD) to .729 (GLEntropy) in PG. Neither group revealed a significant
difference between any pair of the AUCs of SD and entropy (all P > .227 in BG and all P > .486 in PG). Additionally, each AUC of SD or entropy was significantly higher in BG than in PG (P = .013 for RLSD; and all P < .01 for the all others), irrespective of light source. Moreover, the diagnostic capabilities of BLMean (P = .017) and BLSkew (P = .044) were both statistically significant in PG.
Diagnostic capability for each light source in NBI
Except for the two reflections of NGL and NBL stored in the red and green channels, an additional NBL reflection decomposed from the blue channel was considered a new reflection and designated NBLLD. Similarly, the polyp responses in NGL, NBL, and NBLLD were also expressed in terms of four features and used to examine the differential capability of NBI (Fig. 4). Both BG (P = .034) and PG (P = .018) had significantly lower NBLMean for adenomas than for hyperplastic polyps. The NBLLDMeans for adenomas and hyperplastic polyps significantly differed in PG (P < . 001) but not in BG (P = .081). The image compression obviously altered the duplicate reflections stored in the green and blue channels. Next, the distortion effects were evaluated by applying the paired t-test to compare the average of each polyp’s NBLMean and NBLLDMean. In both image groups, average NBLMean (BG = 99.84, PG = 97.64) significantly differed from average NBLLDMean (BG = 66.89, PG = 68.59, P < .001). However, the NBLMean and NBLLDMean were strongly and positively correlated in both BG (r = .935) and PG (r = 0.892). That is, the image compression significantly
reduced the NBLLD intensities yet preserved the correlations between NBL and NBLLD. Additionally, the SD and entropy for adenomas were both significantly higher than those for hyperplastic polyps (P < .001), irrespective of the light source and image group. Moreover, the NBLskew and NBLLDskew for hyperplastic polyps were significantly lower than those for adenomas, respectively, irrespective image group (P < .05).
Figure 5 shows the diagnostic capabilities of the reflection features in BG and PG. The diagnostic capabilities of SD and entropy were all significant (P < .001), irrespective of the light source and image group. The AUCs of SD and entropy ranged from .884 (NBLLDSD) to .921 (NGLSD) in BG and from .670 (NBLLDSD) to .722 (NBLEntropy) in PG. The difference between any pair of the AUCs of SD and entropy was not significant in BG (P > .370) and PG (P > 0.280). Each AUC of SD or entropy was significantly higher in BG than in PG (all P < .001), irrespective of the light source. Additionally, the diagnostic capabilities of mean and skew were significant in NBL and NBLLD (P = .054 for NBLLDMean, P < .05 for all others), irrespective of image group.
Diagnostic capabilities of WLC and NBI
Either the WLC or NBI was used to construct classification models that included the sets of reflection features with the strongest associations with polyp types. The BG features for the WLC model are RLMean, GLMean, GLSD, and GLentropy whereas those for the NBI model are NGLSkew,
NGLentropy, and NBLLDSkew. Both WLC and NBI showed outstanding discrimination with AUCs of .
respectively (Fig. 6A), which was not significantly different (P = .690). The PG features for the WLC model are RLMean, GLSD, GLentropy, and BLMean, whereas those for the NBI model are NGLMean,
NBLentropy, and NBLLDMean. Comparisons of diagnostic capabilities between WLC and NBI showed
acceptable discrimination with AUCs of .782 (sensitivity = 72.1%, specificity = 71.0%) and .769 (sensitivity = 70.2%, specificity = 73.9%), respectively (Fig. 6B); again, the difference was not significantly different (P = .755). In WLC, the diagnostic capability of BG was significantly better than that of PG (P = .005). Similarly, the diagnostic capability of NBI was significantly better in BG than in PG (P < .001).
DISCUSSION
This study developed and evaluated a novel concept for assessing colorectal polyps. Endoscopy systems use the reflections from light emitted from a lighting device to depict mucosal details at various depths (Figs. 1D-F). The proposed features defined in individual reflections not only revealed how the polyps responded to the used lights, but also indicated the capabilities of WLC and NBI for differential diagnosis of colorectal polyps. Based on the reflection features, WLC or NBI was used as a classification model for differentiating between adenomas and hyperplastic polyps. In contrast, previous works have used endoscopic images to characterize polyps [8-13]. To display the endoscopic images, the reflections depicting the mucosal details at various depths were compressed into a flattened plane and represented with synthesized RGB colors (Figs. 1A and 1C). However, RGB color space is not perceptually uniform [20], indicating that the difference between colors does
not correspond to human perception. Thus, the assessment of polyps was subjective and highly dependent on the experiences of the colonoscopists.
Using the reflection features to express polyp responses in terms of absorption, diversity, skew, and heterogeneity enables accurate discrimination between adenomas and hyperplastic polyps. Technically, the effectiveness of narrowed blue light depends on the wavelength within the hemoglobin absorption band [5]. Here, the NBLMean was significantly lower for adenomas than for hyperplastic polyps, which indicates higher absorption in adenoma. Although the blue light used in WLC was split from the visible light, the absorption of adenomas remained higher than that of hyperplastic polyps. In contrast to the absorption, the diversity and heterogeneity of polyp responses described by SD and entropy provided more discriminatory power. In the current study, the complex pitting and capillary patterns in the polyps indicated a high likelihood of malignancy [8, 12]. Such complex patterns are reflected in the polyp responses from any used lights and are efficiently expressed in terms of SD and entropy features as proposed here.
The differential capability of the light source was mainly affected by the quality of the mucosal surface. The diagnostic capabilities of SD and entropy for all light sources in WLC and NBI compared favorably with those of the mean and skew in BG; however, the advantage was substantially decreased in PG. BG and PG images differed mainly in the image brightness and the clarity of mucosal surface either of which could decrease the diagnostic capability. The measurements of SD and entropy were independent of the central tendency of a distribution, which indicated that they were unaffected by the brightness. However, the overlying mucus had an effect
similar to that of a blurring filter and produced a hazy reflection when the mucosal surface was not thoroughly washed. Figures 2 and 4 indicate that the variations in SD and entropy in the responses of all polyps to each light source were substantially larger in BG than in PG. The reduced variation corresponds to the increased overlap between the distributions of adenomas and hyperplastic polyps and reduces diagnostic capability. Hence, the effective mucus clearance was essential for obtaining a surface that accurately reflected the mucosal details.
The WLC and NBI without magnification for use as classification models demonstrated comparable diagnostic capabilities to those reported in previous studies [8-13]. In BG, diagnostic accuracy had a sensitivity of 86.0% and a specificity of 84.8% for WLC, and a sensitivity of 87.7% and a specificity of 89.8% for NBI. In contrast, previous works consistently found that the accuracy of WLC was inferior to that of NBI [8-13]. When a surface pattern was used [13], WLC had a sensitivity and specificity of 38% and 97%, respectively. Based on Kudo classification, the sensitivity of WLC ranges from 59% to 85.3% whereas the specificity ranges from 44.4% to 85.4% [8-11]. Additionally, the sensitivity and specificity of WLC using the capillary pattern were 71% and 81%, respectively [12]. However, unlike our study, these studies may have underestimated the capability of WLC because of the subjective evaluations of endoscopists. Although this study did not show superior accuracy of NBI compared to previous works, NBI provided a high sensitivity without compromising specificity. Moreover, the assessment of colorectal polyps using NBI depended on the learning curve of physicians [14]. This study used WLC or NBI as classification model that included a set of reflection features with the strongest association with adenomas. The assessment of colorectal
polyps was objective, quantitative, and stable. Besides, the diagnostic capabilities of WLC and NBI were identical in the same image group. Although they were affected by the clarity of the mucosal surface, SD and entropy effectively differentiated adenomas and were the main determinants of the diagnostic capabilities of WLC and NBI. As mentioned in the review by Emura [21], further studies are needed to determine whether NBI should replace WLC. Besides, Adler [22] shows that the adenoma detection rate could not be improved by using NBI. We further show the similar capabilities of WLC and NBI in differentiating adenomas from hyperplastic polyps.
The effects of storing endoscopic images in JPEG compression format are uncertain. Based on human perception, the blue channel in a compressed image is more distorted compared to other channels [16, 17]. In NBI, the reflection from the narrowed blue light is duplicated and stored in the green and blue channels. Figure 4 reveals that distortion significantly alters the duplicated reflection stored in the blue channel, implying a higher distortion of the reflection of blue light in WLC relative to the other reflections. In NBI, a duplicated reflection of the narrowed blue light was assigned to the green channel, which reduced the distortion effect. In WLC, blue light provided more discriminatory power compared to other lights. However, the most important reflection of blue light remained stored in the blue component to receive a higher distortion effect. Whether the diagnostic capability of WLC could be improved by assigning the reflection of blue light to another component requires further study.
Despite it contributions, this study has certain limitations. The endoscopic images were collected and reviewed retrospectively. During the colonoscopy, the endoscopist tends to observe and
assess colorectal polyps in both WLC and NBI modes and then photograph the polyp with the best quality in either mode. Thus, most of the high quality endoscopic images were collected only in one of WLC and NBI. Additionally, we reviewed the WLC and NBI images and evaluated their quality subjectively and by consensus. In the experimental results, the diagnostic capability of endoscopic images was mainly determined by the image quality rather than by the light source. Thus, objectively evaluating image quality becomes a novel issue. The endoscopic images could be used as a classification model that includes a set of reflection features. The reflection features might be used for objective evaluation of reflection quality.
To our knowledge, no studies have defined polyp responses in the reflections from different light sources in WLC and NBI as reflection features. Based on reflection features, the endoscopic image, either WLC or NBI, could be considered as a classification model. For the images of the best quality, both WLC and NBI have excellent and identical diagnostic accuracies (AUC > .9). The role of NBI in screening endoscopy warrants further evaluation.
ACKNOWLEDGEMENTS
The authors would like to thank the National Science Council of the Republic of China, Taiwan (Contract No. NSC 98-2221-E-468-015) and Department of Health, Executive Yuan, Taiwan (Contract No. DOH102-TD-C-111-005) for partially supporting this research. Ted Knoy is appreciated for his editorial assistance.
REFERENCES
1. Vogelstein B, Fearon ER, Hamilton SR, et al. Genetic alterations during colorectal-tumor development. N Engl J Med. 1988 Sep 1;319(9):525-32.
2. Allen JI. Molecular biology of colon polyps and colon cancer. Semin Surg Oncol. 1995 Nov-Dec;11(6):399-405. Review.
3. Kahi CJ, Rex DK, Imperiale TF. Screening, surveillance, and primary prevention for colorectal cancer: a review of the recent literature. Gastroenterology. 2008 Aug;135(2):380-99. Review. 4. Zauber AG, Winawer SJ, O'Brien MJ, et al. Colonoscopic polypectomy and long-term
prevention of colorectal-cancer deaths. N Engl J Med. 2012 Feb 23;366(8):687-96.
5. Gono K, Yamazaki K, Doguchi N, et al. Endoscopic observation of tissue by narrow-band
illumination. Optical Rev. 2003;10:211–215.
6. ASGE TECHNOLOGY COMMITTEE, Song LM, Adler DG, et al. Narrow band imaging and
multiband imaging. Gastrointest Endosc. 2008 Apr;67(4):581-9. Review.
7. Muto M, Horimatsu T, Ezoe Y, et al. Narrow-band imaging of the gastrointestinal tract. J Gastroenterol. 2009;44(1):13-25. Review.
8. Machida H, Sano Y, Hamamoto Y, et al. Narrow-band imaging in the diagnosis of colorectal mucosal lesions: a pilot study. Endoscopy. 2004 Dec;36(12):1094-8.
9. Sikka S, Ringold DA, Jonnalagadda S, et at. Comparison of white light and narrow band high definition images in predicting colon polyp histology, using standard colonoscopes without optical magnification. Endoscopy. 2008 Oct;40(10):818-22.
10. Chiu HM, Chang CY, Chen CC, et al. A prospective comparative study of narrow-band imaging, chromoendoscopy, and conventional colonoscopy in the diagnosis of colorectal neoplasia. Gut. 2007 Mar;56(3):373-9.
11. Su MY, Hsu CM, Ho YP, et al. Comparative study of conventional colonoscopy, chromoendoscopy, and narrow-band imaging systems in differential diagnosis of neoplastic and nonneoplastic colonic polyps. Am J Gastroenterol. 2006 Dec;101(12):2711-6.
12. Togashi K, Osawa H, Koinuma K, et al. A comparison of conventional endoscopy, chromoendoscopy, and the optimal-band imaging system for the differentiation of neoplastic and non-neoplastic colonic polyps. Gastrointest Endosc. 2009 Mar;69(3 Pt 2):734-41.
13. Rastogi A, Keighley J, Singh V, et al. High accuracy of narrow band imaging without magnification for the real-time characterization of polyp histology and its comparison with high-definition white light colonoscopy: a prospective study. Am J Gastroenterol. 2009 Oct;104(10):2422-30.
14. Higashi R, Uraoka T, Kato J, et al. Diagnostic accuracy of narrow-band imaging and pit pattern analysis significantly improved for less-experienced endoscopists after an expanded training program. Gastrointest Endosc. 2010 Jul;72(1):127-35.
15. Rogart JN, Jain D, Siddiqui UD, et al. Narrow-band imaging without high magnification to differentiate polyps during real-time colonoscopy: improvement with experience. Gastrointest Endosc. 2008 Dec;68(6):1136-45.
16. W. Pennebaker and J. Mitchell, JPEG, Still Image Data Compression Standard. New York: Van Nostrand, 1993.
17. G. K. Wallace. The JPEG Still Picture Compression Standard. 1992 Feb.; IEEE Trans. Consumer Electronics, Vol. 38,No 1.
18. Stone, M., 1974. Cross-validation choice and assessment of statistical predictions. J. R. Stat. Soc. B 36, 111–147.
19. PASW Statistics, version 18. Chicago, IL: SPSS Institute, 2010.
20. G. W. Wyszecki and S. W. Stiles, Color Science: Concepts and Methods, Quantitative Data and Formulas. New York: Wiley, 1982.
21. Emura F, Saito Y, Ikematsu H. Narrow-band imaging optical chromocolonoscopy: advantages and limitations. World J Gastroenterol. 2008 Aug 21;14(31):4867-72. Review.
22. Adler A, Aschenbeck J, Yenerim T, et al. Narrow-band versus white-light high definition television endoscopic imaging for screening colonoscopy: a prospective randomized trial. Gastroenterology. 2009 Feb;136(2):410-6.
Table 1. Demography of study polyps Characteristics BG PG A H A H Polyps 100 95 104 138 Mean size, mm 8.96 5.31 7.82 4.06 Location Cecum Ascending Colon Transverse Colon Descending Colon Sigmoid Colon Retum 4 29 23 12 23 9 2 18 24 22 18 11 5 31 23 18 17 10 0 23 26 20 39 30 Type Flat Subpedunculated Pedunculated 2 90 8 1 90 4 8 83 13 18 117 3 * BG and PG indicate the best image and the paired image groups, respectively.
* The columns of "A" and "H" show the numbers of adenomas and hyperplastic polyps, respectively.
FIGURE LEGENDS
Fig. 1. For defining the reflection features, the polyp response was extracted from an endoscopic image. (A) An adenoma was found in NBI. (B) The polyp was manually identified by the polygon in which the overexposed areas were automatically excluded (white arrows). (C) The reflections stored in the red, green, and blue channels of the endoscopic image. In each reflection, the intensity was valued between 0 and 255, where a high intensity denotes a high reflectance or a low absorption. (D) – (F) The polyp response stored in the red, green, and blue channels was regarded as a distribution and used to defined the reflection features.
Fig. 2. Boxplots for comparing the four features between adenomas and hyperplastic polyps in each reflection from the red, green, blue lights used in WLC. In each comparison, the difference between adenomas and hyperplastic polyps was measured by Student’s t-test. (A) BG. (B) PG.
Fig. 3. For WLC, the diagnostic capabilities of reflection features in (A) BG and in (B) PG. * and ** indicate P values less than .05 and .001, respectively.
Fig. 4. Boxplots for comparing the four features between adenomas and hyperplastic polyps in each reflection, including an additional NBLLD, from the NGL and NBL used in NBI. In each comparison, the difference between adenomas and hyperplastic polyps was measured by Student’s t-test. (A) BG. (B) PG.
Fig. 5. For NBI, the diagnostic capabilities of reflection features. (A) BG. (B) PG. * and ** indicate P values less than 0.05 and 0.001, respectively.