行政院國家科學委員會專題研究計畫 成果報告
骨髓血流灌注與骨質密度的相關性─性別,年齡與老化的影
響
計畫類別: 個別型計畫
計畫編號: NSC92-2314-B-002-172-
執行期間: 92 年 08 月 01 日至 93 年 07 月 31 日
執行單位: 國立臺灣大學醫學院放射線科
計畫主持人: 施庭芳
共同主持人: 劉華昌
報告類型: 精簡報告
處理方式: 本計畫可公開查詢
中 華 民 國 93 年 10 月 4 日
Tiffany Ting-Fang Shih, MD
Hwa-Chang Liu, MD, PhD
Chee-Jen Chang, PhD
Shwu-Yuan Wei, BS
Ling-Chun Shen, BS
Pan-Chyr Yang, MD, PhD
Index terms: Bone marrow, MR, 38.121411, 38.121412, 38.12143, 38.12149 Bones, absorptiometry, 38.1295 Osteoporosis, 38.56Vertebral arteries, flow dynamics, 37.12143, 37.12144 Published online before print
10.1148/radiol.2331031509 Radiology 2004; 233:121–128 Abbreviations:
BMD⫽ bone mineral density ROI⫽ region of interest SD⫽ standard deviation
1From the Departments of Medical
Imaging and Radiology (T.T.F.S., S.Y.W., L.C.S.), Orthopedics and Bio-medical Engineering (H.C.L.), and In-ternal Medicine (P.C.Y.), National Tai-wan University Hospital and National Taiwan University College of Medi-cine, 7 Chung-Shan South Road, Tai-pei 100, Taiwan; and Department of Medical Research, National Taiwan University Hospital (C.J.C.). Received September 18, 2003; revision requested December 2, 2003; final revision re-ceived February 20, 2004; accepted March 11. Supported by grant NSC 91– 2314-B-002–395 from the National Sci-ence Council, Taiwan. Address corre-spondence to P.C.Y. (e-mail: pcyang
@ha.mc.ntu.edu.tw).
Authors stated no financial relation-ship to disclose.
Author contributions:
Guarantors of integrity of entire study, T.T.F.S., P.C.Y.; study concepts and design, T.T.F.S., H.C.L., P.C.Y.; litera-ture research, T.T.F.S.; clinical studies, T.T.F.S., H.C.L., S.Y.W.; data acquisi-tion, T.T.F.S., L.C.S., C.J.C., S.Y.W.; data analysis/interpretation, T.T.F.S., C.J.C.; statistical analysis, C.J.C.; manu-script preparation and editing, L.C.S., T.T.F.S., C.J.C.; manuscript revision/ review, T.T.F.S., H.C.L., P.C.Y.; manu-script definition of intellectual content and final version approval, P.C.Y., T.T.F.S.
©RSNA, 2004
Correlation of MR Lumbar
Spine Bone Marrow Perfusion
with Bone Mineral Density in
Female Subjects
1
PURPOSE: To prospectively assess lumbar spine bone marrow perfusion at
dy-namic magnetic resonance (MR) imaging and correlate perfusion with bone mineral density (BMD) in female subjects.
MATERIALS AND METHODS: BMD measurement and dynamic MR imaging of
the lumbar spine were performed in 69 female subjects (mean age⫾ standard deviation, 57 years⫾ 11). Subjects were stratified into premenopausal (n ⫽ 19) and postmenopausal (n⫽ 50) groups, with the latter group including both women who were (n⫽ 13) and women who were not (n ⫽ 37) receiving hormone replacement therapy. BMD (in grams per square centimeter) was measured with dual energy absorptiometry in the lumbar spine. Peak enhancement ratio, measured with time– signal intensity curves calculated from dynamic MR image data, represented bone marrow perfusion. Peak enhancement ratio was compared with age and BMD by using linear regression analysis and Pearson correlation.
RESULTS: A significant positive correlation was found for BMD with peak
enhance-ment ratio of lumbar vertebrae among all subjects (n⫽ 69, r ⫽ 0.63, P ⬍ .001), all postmenopausal women (n⫽ 50, r ⫽ 0.50, P ⬍ .001), and postmenopausal women without hormone replacement therapy (n⫽ 37, r ⫽ 0.61, P ⬍ .001). However, the correlation between BMD and peak enhancement ratio was not significant (P⬎ .05) in premenopausal women (n⫽ 19) or postmenopausal women receiving hormone therapy (n⫽ 13). Both BMD and peak enhancement ratio were inversely correlated with age (P⬍ .001, Pearson correlation). Pearson partial correlation coefficient for peak enhancement ratio and mean in all subjects, with control for inverse correlation with age, was significant (r⫽ 0.63, P ⬍ .001).
CONCLUSION: Significant correlation was found between the peak enhancement
ratio of vertebral bone marrow and BMD in postmenopausal female subjects. This result may suggest a vascular component in the pathogenesis of osteoporosis.
©RSNA, 2004
An association of decreased vascular blood flow with osteoporosis has been described previ-ously (1). In patients with peripheral vascular disease of the lower extremities, mean bone mineral density (BMD) was reported to be significantly lower in the more severely affected limb than in the less severely affected limb (2). In an epidemiologic study of elderly women with osteoporosis, diminished BMD was found to be associated with increased risk of death from stroke (3,4). These reports are highly suggestive of a relation between ischemia and bone metabolism. An association may exist also between vascular defect in the intraosseous micro-environment and osteoporosis. In a histomorphometric study by Demmler et al (5), the numbers of arterial capillaries and sinuses per unit area were found to be reduced in osteopo-rotic bone. Burkhardt et al (6) also showed diminution of bone marrow capillaries in patients with geriatric and primary osteopenia. The involvement of a vascular component in the pathogenesis of osteoporosis, however, may be multidimensional and protracted over time.
There is no direct evidence of a link between BMD and blood flow in bone or bone marrow in humans. Kita et al (7) used an ex vivo hydrogen washout method to measure
Musculoskeletal Imaging
R
bone marrow blood flow in rabbits and found that decreased bone marrow blood flow was related to histologic changes with increased age. Dynamic magnetic resonance (MR) imaging with contrast enhancement has proved useful for eval-uating bone marrow perfusion (8,9). There were strong correlations between MR image data and microsphere blood flow measurements in a dog model (8). MR imaging is commonly used for eval-uating musculoskeletal neoplasms and monitoring their response to chemother-apy (10,11). It also has been useful in the differential diagnosis of benign and ma-lignant compression fractures of the spine (12). In a previous study, we demonstrated the use of dynamic MR imaging for evalu-ation of vertebral bone marrow perfusion and proved that the latter varied signifi-cantly according to differences in age and sex (P⬍ .05). A significant decrease in bone marrow perfusion was found in women older than 50 years, and a less substantial decrease was found in men of the same age (13). In addition, the incidence of osteopo-rosis in women is significantly increased after menopause (14,15). Postmenopausal women also have increased risks for cardio-vascular disease or stroke (16,17). Thus, the purpose of our study was to prospectively assess lumbar spine bone marrow perfu-sion at dynamic MR imaging and to corre-late perfusion with BMD in female sub-jects.
MATERIALS AND METHODS Subjects
All subjects were women referred from the orthopedics and osteoporosis clinic by one investigator (H.C.L.). History of malignancy and previous spinal surgery were excluded through oral questioning by a research nurse. The orthopedic sur-geon then performed a physical exami-nation of the subject at the outpatient clinic to rule out major spinal deformi-ties, such as scoliosis of more than 5° or kyphosis of more than 15°–20°, which were criteria for exclusion. If the subjects fit the criteria, they were invited to par-ticipate in the research project. The study was sponsored by a grant from the Na-tional Science Council, Taiwan, and was approved by the Institutional Review Board of the National Taiwan University Hospital. All subjects were given infor-mation about the procedures for BMD measurement and contrast material– en-hanced MR imaging of the lumbar spine, and signed informed consent was ob-tained prior to their participation.
A total of 79 female subjects (age range, 30 –75 years) were consecutively enrolled during a 4-month period (from July to October 2002). Subjects were excluded if lumbar vertebral body compression was present and associated with low signal intensity on T1-weighted images. Sub-jects with compression fractures depicted as areas of iso- to hyperintense bone mar-row signal on T1-weighted images were not excluded, because they were consid-ered to have fatty regeneration of bone marrow in the collapsed vertebra. Such findings suggested the chronicity of com-pression fracture and might be related to osteoporosis. Subjects with acute fracture identified on the basis of medical history and clinical presentation were excluded from the study. Altogether, 10 subjects were excluded: One had a compression fracture in the L2 vertebra with low sig-nal intensity on T1-weighted turbo spin-echo images and reported back pain of more than 1 month in duration, which indicated subacute vertebral fracture. Two subjects had a history of hyperparathy-roidism, five had technical failure during the rapid injection of the MR contrast agent, and two were excluded because of ambiguous menstrual history (one sub-ject was in the perimenopausal period less than 1 year after the last menstrual cycle, and the other subject had under-gone hysterectomy). A total of 69 sub-jects (mean age ⫾ standard deviation [SD], 57 years⫾ 11) were included in the analysis.
Nineteen of the subjects were pre-menopausal (age range, 32–54 years; mean age, 46 years⫾ 5; age distribution: 32– 40 years [n⫽ 3], 41–45 years [n ⫽ 7], 46 –50 years [n⫽ 5], and 51–54 years [n ⫽ 4]). The remaining 50 subjects were post-menopausal (age range, 46 –75 years; mean age, 62 years⫾ 9; age distribution: 46 –50 years [n⫽ 4], 51–55 years [n ⫽ 12], 56 – 60 years [n⫽ 6], 61–65 years [n ⫽ 9], 66 –70 years [n ⫽ 11], and 71–75 years [n⫽ 8]). Thirteen of the postmenopausal subjects had received hormone replace-ment therapy for more than 6 months; the type and dosage of medication and the exact duration of therapy, however, were not recorded in the medical history. Each subject underwent both BMD and MR bone marrow perfusion measure-ments of the lumbar spine. The two mea-surements for each subject were per-formed within a 2-week interval.
BMD Measurements
BMD was measured with dual energy absorptiometry by one of the authors
(L.C.S.) by using a fan-beam bone densi-tometer (QDR-4500A; Hologic, Waltham, Mass). Instrument quality control of our bone densitometer is performed at least 5 days per week. The precision error of BMD measurements on anteroposterior projections of the lumbar spine was less than 0.01 g/cm2. BMD was measured
from L1 to L4 on anteroposterior projec-tions, and the mean of the values mea-sured at these four levels was considered to represent BMD for anteroposterior projections in each subject. BMD was measured also from L2 to L4 on lateral projections, and the mean of measured values at these three levels was consid-ered to represent BMD for lateral projec-tions in each subject.
MR Measurements of Bone Marrow Perfusion
MR imaging of the spine was per-formed by using a 1.5-T superconducting system (Magnetom Vision Plus, H-SP; Sie-mens Medical Solutions, Erlangen, Ger-many) and a phased-array spinal coil. A routine T1-weighted turbo spin-echo se-quence (repetition time msec/echo time msec, 600/12; turbo factor, 3; section thickness, 4 mm; field of view, 28 cm) was applied in the midsagittal plane from the level of T11 to the sacrum. T1-weighted images of the spine were eval-uated by a musculoskeletal radiologist (T.T.F.S.) for areas of abnormal bone mar-row signal intensity that might indicate compression fracture, neoplasm, or infec-tion, all of which were criteria for exclu-sion from the study. One subject was ex-cluded, as mentioned before, because of an area of abnormal low signal intensity seen on T1-weighted images, a finding indicative of subacute vertebral fracture due to compression.
Dynamic contrast-enhanced MR imag-ing was then performed in the midsec-tion of the vertebral body (secmidsec-tion thick-ness, 10 mm; field of view, 28 cm), from T11 to the sacrum. A slightly oblique an-gle was used for dynamic imaging to avoid flow artifacts from the abdominal aorta. A turbo fast low-angle shot gradi-ent-echo pulse sequence (repetition time msec/echo time msec/prepulse inversion time msec, 8.5/4.0/160; flip angle, 10o;
matrix, 72⫻ 128) was used. The acquisi-tion time was 0.89 second with an 0.11-second delay. A total of 100 dynamic im-ages were obtained within 100 seconds (1 frame per second) in each subject.
An injection of gadopentetate dime-glumine (Magnevist; Schering, Berlin, Germany) containing 0.1 mmol of
gado-122
䡠
Radiology䡠
October 2004 Shih et alR
linium per kilogram of body weight was administered manually at a constant in-jection rate of approximately 2.0 mL/sec, with a total injection time of 5– 8 sec-onds, through a 21-gauge intravenous catheter previously inserted in the right antecubital vein. The contrast medium injection was immediately followed by a 20-mL saline flush administered at the same injection rate. Dynamic imaging was started when the injection of the contrast medium commenced.
Data Analysis
Signal intensity values were measured in operator-defined regions of interest (ROIs). The musculoskeletal radiologist (T.T.F.S., with 14 years of experience) and senior MR technologist (S.Y.W., with 9 years of experience) placed the ROIs to-gether in consensus. The ROIs were placed, with the aid of a cursor and a graphic display device, along the border of high-signal-intensity bone marrow on T1-weighted images and covered the en-tire bone marrow of each vertebra. One vertebral body was covered by one ROI measurement. The ROIs ranged in area from 2.1 to 3.5 cm2(mean, 2.62 cm2⫾
0.46). The ROI was measured separately for each of five lumbar vertebrae (L1 through L5) in each subject. The signal intensity values derived from the ROI
measured in each vertebral body were then plotted against time to obtain a time–signal intensity curve (Fig 1) for each vertebral body. The baseline value for signal intensity (SIbase) on a time–
signal intensity curve was defined as the mean signal intensity from the first three images. The maximum signal intensity (SImax) was defined as the maximum
value of the first rapidly rising part of the time–signal intensity curve. The time to peak contrast enhancement was defined as the time between SIbaseand SImax.
Af-ter the peak, which usually occurred about 40 seconds after the start of injec-tion, the time–signal intensity curve en-tered an equilibrium phase that lasted about 30 seconds. The total 100-second imaging time encompassed both the first rapid rise in the curve and the early equi-librium phase. In our study, the SIbase
and SImaxwere measured only from the
first rapidly rising curve. For the semi-quantitative analysis, the peak enhance-ment ratio was calculated for each ROI as (SImax⫺ SIbase)/SIbase. Because of a
sta-tistically significant correlation observed between peak enhancement ratio and age in our previous study (13), we used the peak enhancement ratio to represent bone marrow perfusion. The peak en-hancement ratio for each vertebra was derived from the time–signal intensity
curve for that vertebra. The mean of the peak enhancement ratios for the five ver-tebrae was used to represent bone mar-row perfusion for each subject.
Statistical Methods
Descriptive statistics, including the mean, median, and SD of continuous vari-ables such as BMD from anteroposterior and lateral projections and peak enhance-ment ratio from dynamic MR imaging, were calculated separately for all subjects and for premenopausal and postmeno-pausal women with and without hormone replacement therapy. Comparisons were made by using the two-sample Wilcoxon rank sum test. Comparisons between age and BMD measured with dual energy ab-sorptiometry and peak enhancement ratio measured with dynamic MR imaging were made by using Pearson correlation analy-sis. Partial correlation coefficients also were derived for peak enhancement ratio and BMD (anteroposterior and lateral pro-jections) with adjustments for age. The correlation between BMD mea-sured with anteroposterior projections and peak enhancement ratio of the lum-bar vertebrae was analyzed. All statistical analyses were performed by one senior statistician (C.J.C.). Regression analysis of the data was performed by using the general linear model and correlation pro-cedures provided in a statistical software package (SAS/STAT, version 8.1; SAS In-stitute, Cary, NC). P values less than .05 were considered to indicate statistically significant differences.
Figure 1. Time–signal intensity curve plotted with data from dynamic contrast-enhanced MR imaging of L3 in a 41-year-old female subject shows signal intensity change during 100 sec-onds of acquisition time. After peak contrast enhancement (SI
max), which occurred about 40 seconds after the start of
con-trast medium injection and imaging (first rapidly rising phase), signal intensity remained relatively stable (equilibrium phase). SI base⫽ mean signal intensity at baseline.
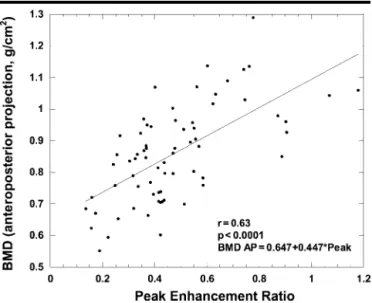
Figure 2. Scatterplot and regression line show positive correlation between mean BMD (anteroposterior projections) and mean peak enhancement ratio in the lumbar spine in all 69 study subjects.
R
RESULTS
Descriptive statistics for BMD measured with anteroposterior and lateral projec-tions and for peak enhancement ratio at dynamic MR imaging in the 69 female subjects are summarized in Tables 1 and 2. In accordance with the definitions es-tablished by a working group of the World Health Organization on the basis of bone mass measurements in post-menopausal Caucasian women, osteopo-rosis is defined as a BMD level more than 2.5 SDs below the mean for young adult women (T score,⫺2.5 or lower), and os-teopenia is defined as a BMD level be-tween 1.0 and 2.5 SDs below the mean for young adult women (T score, higher than⫺2.5 and lower than ⫺1.0). A nor-mal BMD level is no more than 1 SD below the mean for young adult women (T score,⫺1 or higher) (18).
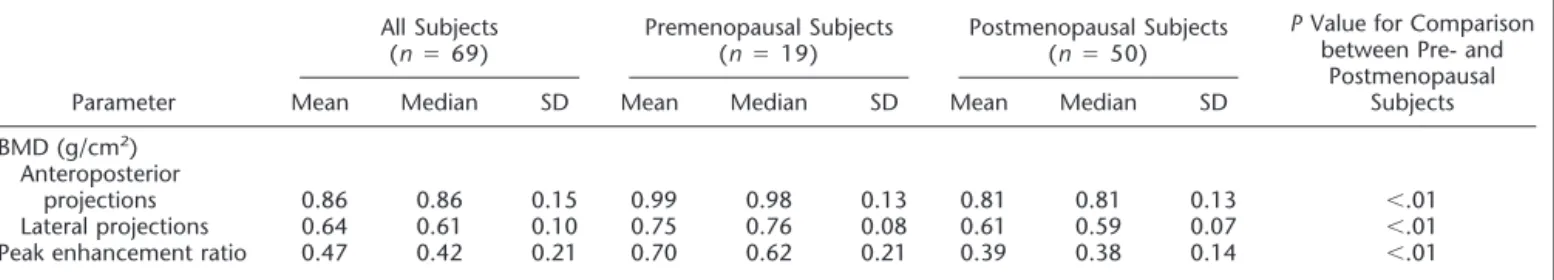
Table 1 shows descriptive statistics for the 69 subjects stratified into premeno-pausal (n⫽ 19) and postmenopausal (n ⫽ 50) groups. Statistically significant differences were found in BMD (both anteroposterior and lateral projections) and in peak en-hancement ratio between premenopausal and postmenopausal women, as follows: BMD for anteroposterior projections was 0.99 g/cm2⫾ 0.13 versus 0.81 g/cm2⫾ 0.13
and for lateral projections was 0.75 g/cm2⫾ 0.08 versus 0.61 g/cm2⫾ 0.07, and
peak enhancement ratio was 0.70⫾ 0.21 versus 0.39⫾ 0.14, for premenopausal and
postmenopausal women, respectively (P⬍ .01 for all three comparisons).
Table 2 shows the same descriptive sta-tistics for the 50 postmenopausal women stratified into two subgroups: those who were (n⫽ 13) and those who were not (n⫽ 37) receiving hormone replacement therapy. The peak enhancement ratio was significantly higher in the group re-ceiving hormone replacement therapy than in the group not receiving such therapy (0.46⫾ 0.16 vs 0.36 ⫾ 0.13; P ⬍ .05), whereas there was no significant dif-ference in BMD (anteroposterior projec-tions, 0.81 g/cm2⫾ 0.08 vs 0.81 g/cm2⫾
0.14, P ⬎ .05; lateral projections, 0.60 g/cm2⫾ 0.07 vs 0.61 g/cm2⫾ 0.08; P ⬎
.05).
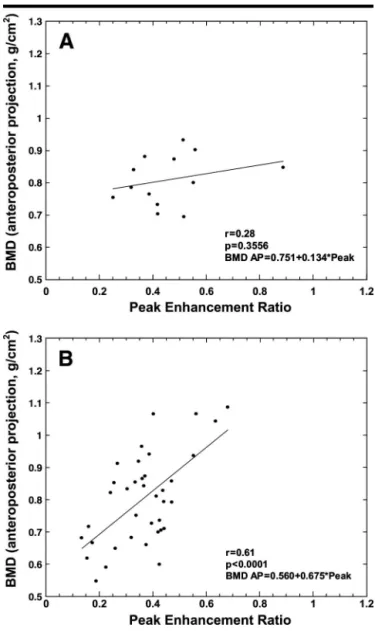
Scatterplots and regression lines for correlation of BMD (anteroposterior pro-jections) with peak enhancement ratio are shown in Figures 2– 4. BMD showed a significant positive correlation with peak enhancement ratio for all subjects (n⫽ 69, r ⫽ 0.63, P ⬍ .001) (Fig 2), for all postmenopausal women (n ⫽ 50, r ⫽ 0.50, P⬍ .001) (Fig 3, B), and for post-menopausal women not receiving hor-mone replacement therapy (n⫽ 37, r ⫽ 0.61, P⬍ .001) (Fig 4, B). The difference in slope between the two lines (Figs 3, B, and 4, B) was not statistically significant. The data for postmenopausal women who were receiving hormone replace-ment therapy, however, did not show a statistically significant correlation
(n⫽ 13, r ⫽ 0.28, P ⫽ .36) (Fig 4, A). The difference in slope between the two lines in Figure 4 (A, postmenopausal women receiving hormone replacement therapy; B, postmenopausal women not receiving hormone replacement therapy) was statistically significant (P ⫽ .026). The data for premenopausal women also showed no statistically significant corre-lation between peak enhancement ratio and BMD (n ⫽ 19, r ⫽ 0.32, P ⫽ .18) (Fig 3, A).
The effect of age on these parameters was assessed by using Pearson correlation analysis (Table 3). The peak enhance-ment ratio at dynamic MR imaging and the BMD for anteroposterior and lateral projections decreased significantly with increasing age (P⬍ .001). Because of the high correlations of both peak enhance-ment ratio and age with BMD, a partial correlation analysis of peak enhance-ment ratio with BMD was performed with age as the controlling variable. The resultant Pearson partial correlation coef-ficient was 0.63 for anteroposterior pro-jections (P⬍ .001) (Table 4). The results of multiple linear regression analysis in-dicated that, with control for the age ef-fect, the BMD for both anteroposterior and lateral projections was positively cor-related with the peak enhancement ratio (P⬍ .001), and, thus, that peak enhance-ment ratio was an important predictor of BMD.
TABLE 1
Summary of Descriptive Statistics for All Subjects and for Pre- and Postmenopausal Groups
Parameter
All Subjects
(n⫽ 69) Premenopausal Subjects(n⫽ 19) Postmenopausal Subjects(n⫽ 50)
P Value for Comparison
between Pre- and Postmenopausal
Subjects
Mean Median SD Mean Median SD Mean Median SD
BMD (g/cm2)
Anteroposterior
projections 0.86 0.86 0.15 0.99 0.98 0.13 0.81 0.81 0.13 ⬍.01
Lateral projections 0.64 0.61 0.10 0.75 0.76 0.08 0.61 0.59 0.07 ⬍.01
Peak enhancement ratio 0.47 0.42 0.21 0.70 0.62 0.21 0.39 0.38 0.14 ⬍.01
TABLE 2
Summary of Descriptive Statistics for Postmenopausal Subjects
Parameter
Subjects Receiving Hormone Replacement Therapy (n⫽ 13)
Subjects Not Receiving Hormone Replacement Therapy (n⫽ 37)
P Value
Mean Median SD Mean Median SD
BMD (g/cm2)
Anteroposterior projections 0.81 0.80 0.08 0.81 0.81 0.14 .85
Lateral projections 0.60 0.58 0.07 0.61 0.60 0.08 .94
Peak enhancement ratio 0.46 0.41 0.16 0.36 0.37 0.13 .04
124
䡠
Radiology䡠
October 2004 Shih et alR
DISCUSSION
The pathogenesis of osteoporosis is com-plex and multifactorial. The underlying mechanism is still not fully understood but may include genetic background, hormonal status, nutrition, and other factors. BMD is known to be correlated with age and sex. BMD in the spine de-creases by about 20% in Caucasian women between 40 and 70 years of age, with a continued but slower decrease thereafter (14,15,19). Values reported for BMD in the lumbar spine in Chinese women are similar to those reported for the Caucasian population (20). It has been hypothesized that osteoporosis is caused by disturbances of blood
circula-tion in bone; reduced arterial blood sup-ply or reduction of extravascular fluid pressure may provoke an increase in osteoclastic activity and, thus, osteopo-rosis (21). Histomorphometric studies also showed that skeletal blood flow was independently correlated with the cor-rected apposition rate, an index of the work rate of osteoblasts, in each multicel-lular unit of bone. Thus, skeletal blood flow may be associated with bone turn-over, and low vascularization is consid-ered a sign of diminished vitality in bone (22,23). Both atherosclerosis and osteo-porosis are common in the elderly. Many previous studies have shown an associa-tion between atherosclerotic cardiovas-cular disease (hence, vascardiovas-cular compro-mise) and the severity of osteoporosis.
This association was most evident in postmenopausal women, who had in-creased risks for cardiovascular disease or stroke (16,17), as well as for osteoporosis (14,15). Boukhris and Becker (24), in a population study, demonstrated a posi-tive correlation between the prevalence of osteoporosis and aortic calcification. Jensen et al (25) proposed that vascular compromise due to arterial calcification might lead to bone loss. Subsequent stud-ies showed that women with aortic calci-fication had significantly lower bone density compared with those without such calcification (26,27) and that coro-nary calcium scores in postmenopausal women were significantly higher in those with osteoporosis than in the control group (28). In a study by Kiel et al (29)
Figure 3. Scatterplots and regression lines for comparison of mean BMD (anteroposterior projections) with mean peak enhance-ment ratio in the lumbar spine show, A, no correlation in pre-menopausal subjects, and, B, strong correlation in postpre-menopausal subjects.
Figure 4. Scatterplots and regression lines for comparison of mean BMD (anteroposterior projections) with mean peak enhancement ratio in the lumbar spine in postmenopausal subjects show, A, no correlation in the group receiving hormone replacement therapy, and, B, strong positive correlation in the group not receiving such therapy.
R
that covered a 25-year period, women with the greatest magnitude of bone loss also demonstrated the most severe pro-gression of abdominal aortic calcifica-tion. Vogt et al (30) also reported that a lower ankle-brachial pulse index was as-sociated with increased bone loss in the hip and calcaneus. The parameters used to represent vascular compromise in those studies, however, reflect the sever-ity of atherosclerosis or blood flow change only in large and medium-sized vessels and not in the small arterioles that nourish the bone; these parameters, therefore, provide only indirect evidence of a vascular component in the patho-genesis of osteoporosis. In this study, we evaluated bone marrow perfusion and BMD in the lumbar spine in female sub-jects. We demonstrated a significant cor-relation between MR bone marrow perfu-sion (presented as peak enhancement ratio) and BMD in female subjects. Both the peak enhancement ratio and BMD were inversely correlated with age (P⬍ .001), and a significant positive correla-tion was found between BMD and the peak enhancement ratio in the lumbar spine (P⬍ .001).
Time–signal intensity curves derived from dynamic contrast-enhanced MR images were used to represent perfusion in bone and bone marrow lesions (8 – 13,31). The semiquantitative assessment of time–signal intensity curves can be performed by using parameters such as slope or maximum value of enhance-ment. Mainly tissue vascularization and perfusion determine the first-pass (wash-in phase of) time–signal intensity curves. After the first pass, capillary permeability and interstitial space components that contribute to the characteristics of the curve yield a further rise, a plateau, or a downslope, which represent a further in-crease in contrast medium influx, a state of equilibrium, or an early washout phase, respectively. Rise or decline in the second part of the curve, however, varied within a very small range. The first-pass part of the time–signal intensity curve (from SIbase to SImax) was considered to
indicate the influx of contrast medium from the arterial capillaries into the ex-tracellular space of the vertebral body. In this study, we calculated the peak en-hancement ratio from this part of the time–signal intensity curve. As men-tioned earlier, there was a high correla-tion between the dynamic MR data and the microsphere blood-flow measure-ment (8). Hawighorst et al (31) used the relative signal intensity enhancement ra-tio to present the time–signal intensity curve of the spine. The relative signal intensity enhancement also was used to normalize the signal intensity–time data, for differentiating between benign and malignant breast lesions (32) and verte-bral lesions (12). Chen et al (13) demon-strated that the peak enhancement per-centage of vertebral bone marrow, but not the enhancement slope, decreased significantly with increasing age. In the present study, we also used the peak en-hancement ratio to represent bone mar-row perfusion. In evaluating the blood perfusion of bone marrow within the ver-tebral body, we included the small vessels and sinusoidal capillaries, myeloid and other cells, marrow fat, and trabeculae but did not include the cancellous corti-cal bone. We use the general term “bone marrow perfusion” to represent blood perfusion in the bone marrow cavity, not in cortical bone. In the vertebral bone marrow, contrast enhancement is influ-enced by macrovascular (paired segmen-tal arteries and intravertebral small arte-rioles) and microvascular (arterial and sinusoidal capillaries) factors and by the concentration of contrast agent in the extravascular extracellular compartment. When the circulation to the vertebral bodies is impaired, the volume of blood flow to the bone marrow may be de-creased, in which case the concentration of contrast material in the bone marrow also will be decreased. The peak enhance-ment ratio should be regarded as the out-come of a complex process that includes blood inflow and outflow, vascular per-meability, and the equilibrium of con-trast agent between the intravascular and
interstitial spaces but does not include factors related to intracellular-extracellu-lar interaction or to bone metabolism at the cellular level.
A positive correlation was found be-tween peak enhancement ratio and BMD of the lumbar spine in female subjects (r⫽ 0.63, P ⬍ .001), a finding that indi-cates a possible connection between de-creased bone marrow perfusion and os-teoporosis. Other common causes also may exist for osteoporosis and decreased blood perfusion, such as atrophy or de-generation of tissue that occur with ag-ing. Our data also showed an inverse cor-relation of peak enhancement ratio and BMD with age (P⬍ .001). After statistical adjustment for age (Pearson partial corre-lation with control for the age variable), the peak enhancement ratio retained its correlation with BMD (r ⫽ 0.63, P ⬍ .001). These findings indicate that the peak enhancement ratio has an impor-tant influence on BMD. Since the bone acts as a closed chamber, we presume that the blood perfusion in the intraosse-ous environment of the vertebra plays an important role in bone trabeculation. Be-cause our study involved data collected over a cross-sectional period, however, our results support a hypothesis of corre-lation but not of causation between low MR bone marrow perfusion and low BMD. Further studies performed with fol-low-up of women over a longer time (longitudinal series) may provide results that support a hypothesis of causation.
The correlation between peak en-hancement ratio and BMD is influenced by menopausal status; a significant corre-lation was observed in our study in post-menopausal subjects (r⫽ 0.50, P ⬍ .001) but not in premenopausal subjects (r⫽ 0.32, P⬎ .05). In previous studies (14– 17,28), an association was found between osteoporosis and atherosclerosis in postmenopausal women, in whom these conditions are prevalent, but not in premenopausal women. BMD measure-ments in premenopausal women in our
TABLE 3
Pearson Correlation Coefficients for Comparison of Peak Enhancement Ratio and BMD with Age for All Subjects
Correlation Parameter
Peak Enhancement Ratio
BMD
Anteroposterior Projections Lateral Projections
Coefficient ⫺0.62 ⫺0.57 ⫺0.58
P value ⬍.001 ⬍.001 ⬍.001
TABLE 4
Pearson Partial Correlation
Coefficients for Comparison of BMD with Peak Enhancement Ratio for All Subjects, with Control for Age
Correlation Parameter BMD Anteroposterior Projections Lateral Projections Coefficient 0.63 0.71 P value ⬍.001 ⬍.001
126
䡠
Radiology䡠
October 2004 Shih et alR
study revealed osteopenia, as defined in accordance with World Health Organiza-tion criteria (a T score between⫺1.0 and ⫺2.5), in only three subjects. The re-maining 16 subjects had normal BMD. The small number of premenopausal women in our study population might have contributed to the lack of a correla-tion.
Results in the 13 postmenopausal sub-jects who were receiving hormone re-placement therapy did not indicate a cor-relation between BMD and bone marrow perfusion (r⫽ 0.28, P ⬎ .05). Although bone marrow perfusion was higher in the group receiving hormone replacement therapy than in postmenopausal women not receiving such therapy (0.46⫾ 0.16 vs 0.36⫾ 0.13, P ⬍ .05), there was no difference in BMD between the two sub-groups. We postulate that the effect of hormone replacement therapy on the vascular system may precede any effect on BMD. Small sample size and inade-quate history of hormone replacement therapy, however, limit our ability to generalize on the basis of these study re-sults. Further investigation is needed to determine the effect of hormone replace-ment therapy on bone marrow perfusion and BMD.
Other systemic diseases commonly seen in elderly women, such as diabetes mel-litus and hypertension, may contribute to the severity of vascular disease. Pa-tients with diabetes mellitus often also have either microvascular disease (eg, ret-inopathy, nephropathy) or macrovascu-lar disease (eg, peripheral vascumacrovascu-lar or ce-rebrovascular disease) (33). The results of research concerning an association be-tween diabetes and osteoporosis, how-ever, are controversial. Young patients with type I diabetes had low BMD, whereas older patients with type II diabe-tes had normal or increased BMD. Factors other than vasculopathy, such as hyper-glycemia, may also influence BMD in di-abetic patients. In this study, we focused on the effect of bone marrow perfusion on BMD, not the possible influences of systemic disease such as diabetes or of cardiac output on blood perfusion in ver-tebrae. Cigarette smoking has been shown to play an important role in vas-culopathy and osteoporosis and to be positively correlated with stroke mortal-ity for both sexes, with the predominant effect in women (34). A statistically sig-nificant association was found between current smoking and the rate of bone loss in elderly women (35). Browner et al (3,4), however, reported that the associa-tion of BMD with stroke was not
con-founded by smoking. In Taiwan, the prevalence of cigarette smoking in July 2001–June 2002 among adult women was about 7.8% and was much lower among women older than 50 years, ac-cording to the annual statistical informa-tion compiled by the Department of Health. Thus, we did not investigate smoking as a factor in the correlation between bone marrow perfusion and BMD.
The influence of marrow fat content on BMD measurement was another limi-tation of this study. An increase in the number of fat cells in marrow is accom-panied by a corresponding reduction in the numbers of arterial capillaries and si-nuses per unit area (5). The influence of vertebral fat on the accuracy of quantita-tive CT attenuation measurements was mentioned previously (36,37). A change of 50% in the bone marrow fat content will change the BMD of an average-sized vertebra by 5%– 6% at dual energy ab-sorptiomety (38). Although both tech-niques are influenced by marrow fat con-tent, the BMD measurements with both techniques are highly correlated with the chemically determined bone mineral mass (39). BMD in our study was mea-sured with dual energy absorptiometry in anteroposterior and lateral projections. Although quantitative CT may provide more accurate BMD measurement in the highly trabeculated bone in the centrum of the vertebra, quantitative CT results in general are similar to those from dual energy absorptiometry in the lateral pro-jection. In our study, MR data from both projections showed correlations with ap-proximately the same level of statistical significance. We chose the anteroposte-rior projection data for linear regression analysis of BMD with MR peak enhance-ment ratio because they best matched the World Health Organization criteria.
In conclusion, we calculated the peak enhancement ratio at dynamic MR imag-ing of the lumbar spine as a measure of vertebral bone marrow perfusion in fe-male subjects. Both BMD and bone mar-row perfusion were inversely correlated with age, and a significant positive corre-lation was found between BMD and bone marrow perfusion in postmenopausal women. These results may suggest a vas-cular component in the pathogenesis of osteoporosis.
Acknowledgments: The authors thank their colleagues at the MR Imaging Division and Departments of Medical Imaging and Radiol-ogy, National Taiwan University Hospital, as well as the engineers at Siemens Medical Solu-tions, for their technical support and
assis-tance with the research on which this article is based.
References
1. Laroche M. Arteriosclerosis and osteopo-rosis (editorial). Presse Med 1996; 25:52– 54. [French]
2. Laroche M, Pouilles JM, Ribot C, et al. Comparison of the bone mineral content of the lower limbs in men with ischaemic atherosclerotic disease. Clin Rheumatol 1994; 13:611– 614.
3. Browner WS, Seeley DG, Vogt TM, Cum-mings SR. Non-trauma mortality in el-derly women with low bone mineral den-sity. Lancet 1991; 338:355–358. 4. Browner WS, Pressman AR, Nevitt MC,
Cauley JA, Cummings SR. Association be-tween low bone density and stroke in el-derly women: the study of osteoporotic fractures. Stroke 1993; 24:940 –946. 5. Demmler K, Otte P, Bartl R, et al.
Osteope-nia, marrow atrophy and capillary circu-lation: comparative studies of the human iliac crest and 1st lumbar vertebra. Z Or-thop 1983; 121:223–227. [German] 6. Burkhardt R, Kettner G, Bo¨hm W, et al.
Changes in trabecular bone, hematopoie-sis and bone marrow vessels in aplastic anemia, primary osteoporosis, and old age: a comparative histomorphometric study. Bone 1987; 8:157–164.
7. Kita K, Kawai K, Hirohata K. Changes in bone marrow blood flow with aging. J Or-thop Res 1987; 5:569 –575.
8. Cova M, Kang YS, Tsukamoto H, et al. Bone marrow perfusion evaluated with gadolinium-enhanced dynamic fast MR imaging in a dog model. Radiology 1991; 179:535–539.
9. Bluemke DA, Petri M, Zerhouni EA. Fem-oral head perfusion and composition: MR imaging and spectroscopic evaluation of patients with systemic lupus erythemato-sus and at risk for avascular necrosis. Ra-diology 1995; 197:433– 438.
10. Verstraete KL, De Deene Y, Roels H, et al. Benign and malignant musculoskeletal lesion: dynamic contrast-enhanced MR imaging—parametric “first-pass” images depict tissue vascularization and perfu-sion. Radiology 1994; 192:835– 843. 11. Van Der Woude HJ, Bloem JL, Verstraete
KL, et al. Osteosarcoma and Ewing’s sar-coma after neoadjuvant chemotherapy: value of dynamic MR imaging in detect-ing viable tumor before surgery. AJR Am J Roentgenol 1995; 165:593–598. 12. Chen WT, Shih TT, Chen RC, et al. The
blood perfusion of vertebral lesions eval-uated with gadolinium-enhanced dy-namic MRI: in comparison with compres-sion fracture and metastasis. J Magn Reson Imaging 2002; 15:308 –314. 13. Chen WT, Shih TT, Chen RC, et al.
Ver-tebral bone marrow perfusion evaluated with dynamic contrast-enhanced MR im-aging: significance of aging and sex. Ra-diology 2001; 220:213–218.
14. Riggs BL, Melton LJ 3rd. Involutional os-teoporosis. N Engl J Med 1986; 314:1676 – 1686.
15. Mazess RB, Barden HS, Ettinger M, et al. Spine and femur density using dual-pho-ton absorptiometry in US white women. Bone Miner 1987; 2:211–219.
16. Kannel WB, Hjortland MC, McNamara PM, Gordon T. Menopause and risk of
R
cardiovascular disease: the Framingham study. Ann Intern Med 1976; 85:447– 452.
17. Colditz GA, Willett WC, Stampfer MJ, Rosner B, Speizer FE, Hennekens CH. Menopause and the risk of coronary heart disease in women. N Engl J Med 1987; 316:1105–1110.
18. Kanis JA, Melton LJ, Christiansen C, Johnston CC, Khaltaev N. The diagnosis of osteoporosis. J Bone Miner Res 1994; 9:1137–1141.
19. Riggs BL, Wahner HW, Seeman E, et al. Changes in bone mineral density of the proximal femur and spine with aging. J Clin Invest 1982; 70:716 –723. 20. Tsai KS, Huang KM, Chieng PU, Su CT.
Bone mineral density of normal Chinese women in Taiwan. Calcif Tissue Int 1991; 45:161–166.
21. Fricke M, Krokowski E. Osteoporosis: due to reduced blood circulation of bone (au-thor’s transl). Z Orthop Ihre Grenzgeb 1975; 113:1043–1050.
22. Reeve J, Arlot M, Wootton R, et al. Skele-tal blood flow, iliac histomorphometry, and strontium kinetics in osteoporosis: a relationship between blood flow and cor-rected apposition rate. J Clin Endocrinol Metab 1988; 66:1124 –1131.
23. Burkhardt R, Bartl R, Frisch B, et al. The structural relationship of bone forming and endothelial cells of the bone marrow. In: Arlet J, Ficat RP, Hungerford DS, eds. Bone circulation. Baltimore, Md: Wil-liams & Wilkins, 1984; 2–14.
24. Boukhris R, Becker KL. Calcification of
the aorta and osteoporosis. JAMA 1972; 219:1307–1311.
25. Jensen GF, Boesen J, Transbøl I. Spinal osteoporosis: a local vascular disease? (ab-str). Calcif Tissue Int 1986; 39:A62. 26. Frye MA, Melton JL 3rd, Bryant SC, et al.
Osteoporosis and calcification of the aorta. Bone Miner 1992; 19:185–194. 27. Banks LM, Lees B, MacSweeney JE,
Stevenson JC. Effect of degenerative spi-nal and aortic calcification on bone den-sity measurements in post-menopausal women: links between osteoporosis and cardiovascular disease? Eur J Clin Invest 1994; 24:813– 817.
28. Barengolts EI, Berman M, Kukreja SC, Kouznetsova T, Lin C, Chomka EV. Osteoporosis and coronary atheroscle-rosis in asymptomatic postmenopausal women. Calcif Tissue Int 1998; 62:209 – 213.
29. Kiel DP, Kauppila LI, Cupples LA, Han-nan MT, O’Donnell CJ, Wilson PW. Bone loss and the progression of abdominal aortic calcification over a 25 year period: the Framingham Heart Study. Calcif Tis-sue Int 2001; 68:271–276.
30. Vogt MT, Cauley JA, Kuller LH, Nevitt MC. Bone mineral density and blood flow to the lower extremities: the study of os-teoporotic fractures. J Bone Miner Res 1997; 12:283–289.
31. Hawighorst H, Libicher M, Knopp MV, et al. Evaluation of angiogenesis and perfu-sion of bone marrow leperfu-sions: role of semi-quantitative and semi-quantitative dynamic MRI. J Magn Reson Imaging 1999; 10: 286 –294.
32. Kuhl CK, Mielcareck P, Klaschik S, et al. Dynamic breast MR imaging: are sig-nal intensity time course data useful for differential diagnosis of enhancing le-sions? Radiology 1999; 211:101–110. 33. Powers AC. Diabetes mellitus. In: Wilson
JD, Braunwald E, Isselbacher KJ, et al, eds. Harrison’s principles of internal medi-cine. 15th ed. New York, NY: McGraw-Hill Medical Publishing, 2001; 2119 – 2120.
34. Khaw KT, Barrett-Connor E, Suarez L, Criqui MH. Predictors of stroke-associ-ated mortality in the elderly. Stroke 1984; 15:244 –248.
35. Kado DM, Browner WS, Blackwell T, Gore R, Cummings SR. Rate of bone loss is as-sociated with mortality in older women: a prospective study. J Bone Miner Res 2000; 15:1974 –1980.
36. Laval-Jeantet AM, Roger B, Bouysse S, Ber-got C, Mazess RB. Influence of vertebral fat content on quantitative CT density. Radiology 1986; 159:463– 466.
37. Glu¨er CC, Genant HK. Impact of marrow fat on accuracy of quantitative CT. J Comput Assist Tomogr 1989; 13:1023– 1035.
38. Hangartner TN, Johnston CC. Influence of fat on bone measurements with dual-energy absorptiometry. Bone Miner 1990; 9:71– 81.
39. Kuiper JW, van Kuijk C, Grashuis JL, Ed-erveen AG, Schu¨tte HE. Accuracy and the influence of marrow fat on quantitative CT and dual-energy x-ray absorptiometry measurements of the femoral neck in vitro. Osteoporos Int 1996; 6:25–30.
128