The Effect of
Gender and Age on Nutritional
Status of Hemodialysis
Patients
Wu HC
1,Lin WC
2, Wu PY
3, Yang SH
1,41.2.3
School of Nutrition and Health Sciences, Taipei Medical University
4Nutrition research center, Taipei Medical University Hospital
Abstract
Objective: This study purpose is to find out the effect of gender and age on nutritional status of
hemodialysis patients.
Subject and Methods: 107 chronic hemodialysis(CHD) subjects were recruited from Wanfang
Hospital and Taipei Medical University Hospital in Sep. 2010. All subjects had hemodialysis
treatment at least 3 months. Subjects were divided into tertile groups by age, less than 50 years,
51-70 years and above 70 years. The data of demographic, anthropometric and laboratory were
collected. Serum albumin, creatinine, and GNRI (geriatric nutritional risk index) score were used
as nutrition marker. All subjects wrote 3-day dietary records, and analyzed their dietary energy
and protein intake.
Results: Comparing to male hemodialysis patients, the female patients had similar level of all
nutrition markers (p>0.05, table 1). Subjects who were more than 70 years had significantly
lower BMI (body mass index), GNRI score, serum albumin and creatinine than those fifty and
less (p < 0.05, table 2). Therefore, elder subjects may have poorer nutritional status than
younger subjects. Ageing caused lower serum albumin level and maybe one of the malnutrition
risk factors of hemodialysis patients.
Conclusion: Malnutrition in CHD patients is no significantly different in gender, but age,
especially older than 70 years old.
Introduction
The prevalence of malnutrition is high in dialysis
patients, and malnutrition increases the morbidity and
mortality.
Elder hemodialysis patients have less dietary intake.
Poor dietary intake is one of the major cause of malnutrition
among dialysis patients.
Female subjects eat less dietary energy and protein
than male which may contribute to higher malnutrition
risk.
Results
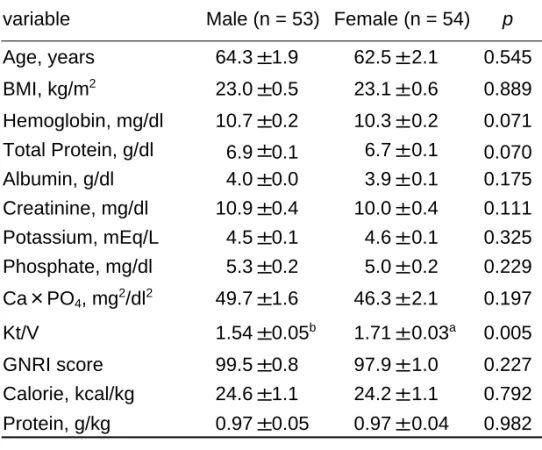
The female patients had similar
level of all nutrition markers
(p>0.05, table 1).
comparing to male hemodialysis
patients,
No significantly different
between different gender in the
age and dietary intake.
Table 1.Comparison of age, anthropometric and laboratory data between male and female.
variable Male (n = 53) Female (n = 54) p
Age, years 64.3 ±1.9 62.5 ±2.1 0.545 BMI, kg/m2 23.0 ±0.5 23.1 ±0.6 0.889 Hemoglobin, mg/dl 10.7 ±0.2 10.3 ±0.2 0.071 Total Protein, g/dl 6.9 ±0.1 6.7 ±0.1 0.070 Albumin, g/dl 4.0 ±0.0 3.9 ±0.1 0.175 Creatinine, mg/dl 10.9 ±0.4 10.0 ±0.4 0.111 Potassium, mEq/L 4.5 ±0.1 4.6 ±0.1 0.325 Phosphate, mg/dl 5.3 ±0.2 5.0 ±0.2 0.229 Ca×PO4 , mg2/dl2 49.7 ±1.6 46.3 ±2.1 0.197 Kt/V 1.54 ±0.05b 1.71 ±0.03a 0.005 GNRI score 99.5 ±0.8 97.9 ±1.0 0.227 Calorie, kcal/kg 24.6 ±1.1 24.2 ±1.1 0.792 Protein, g/kg 0.97 ±0.05 0.97 ±0.04 0.982 Variable are expressed as mean ± SE. Age; BMI, body mass index; Hemoglobin; Total Protein; Albumin; BUN, blood urea nitrogen; Creatinine; Cholesterol; Triglyceride; Potassium; Calcium; Phosphate; Ca×PO4 , calcium phosphate product;
Kt/V; GNRI, geriatric nutritional risk index; Calorie; Protein. Values with different superscripts are significantly different at
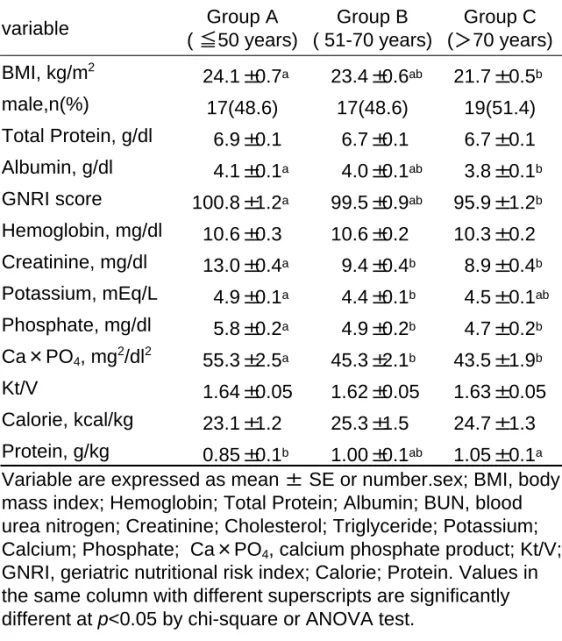
Results
Subjects who were more than 70 years had
significantly lower BMI (body mass index),
GNRI score, serum albumin and creatinine
than those fifty and less (p < 0.05, table 2).
Therefore, elder subjects may have poorer
nutritional status than younger subjects.
Previous studies showed that elder people loss their
body weight more than 0.68kg per year, and most of
lost body weight is muscle mass.
Ageing caused lower serum albumin level and
maybe one of the malnutrition risk factors of
hemodialysis patients.
However, we did not find elder subjects had
significantly decreased dietary energy and
protein intake.
Inadequate dietary energy and protein intake were
not major contributors of malnutrition in these
patients.
Table 2. Comparison of anthropometric and laboratory data between different age.
variable Group A ( ≦50 years) Group B ( 51-70 years) Group C (>70 years) BMI, kg/m2 24.1 ±0.7a 23.4 ±0.6ab 21.7 ±0.5b male,n(%) 17(48.6) 17(48.6) 19(51.4) Total Protein, g/dl 6.9 ±0.1 6.7 ±0.1 6.7 ±0.1 Albumin, g/dl 4.1 ±0.1a 4.0 ±0.1ab 3.8 ±0.1b GNRI score 100.8 ±1.2a 99.5 ±0.9ab 95.9 ±1.2b Hemoglobin, mg/dl 10.6 ±0.3 10.6 ±0.2 10.3 ±0.2 Creatinine, mg/dl 13.0 ±0.4a 9.4 ±0.4b 8.9 ±0.4b Potassium, mEq/L 4.9 ±0.1a 4.4 ±0.1b 4.5 ±0.1ab Phosphate, mg/dl 5.8 ±0.2a 4.9 ±0.2b 4.7 ±0.2b Ca×PO4 , mg2/dl2 55.3 ±2.5a 45.3 ±2.1b 43.5 ±1.9b Kt/V 1.64 ±0.05 1.62 ±0.05 1.63 ±0.05 Calorie, kcal/kg 23.1 ±1.2 25.3 ±1.5 24.7 ±1.3 Protein, g/kg 0.85 ±0.1b 1.00 ±0.1ab 1.05 ±0.1a
Variable are expressed as mean ± SE or number.sex; BMI, body mass index; Hemoglobin; Total Protein; Albumin; BUN, blood urea nitrogen; Creatinine; Cholesterol; Triglyceride; Potassium; Calcium; Phosphate; Ca×PO4 , calcium phosphate product; Kt/V;
GNRI, geriatric nutritional risk index; Calorie; Protein. Values in the same column with different superscripts are significantly different at p<0.05 by chi-square or ANOVA test.