Effects of dietary protein on renal function and lipid
metabolism in five-sixths nephrectomized rats
Shu-Tzu Chen
1, Sheng-Jeng Peng
2and Jiun-Rong Chen
1*
1Department of Nutrition and Health Sciences, Taipei Medical University, Taipei 110, Taiwan 2Division of Nephrology, Cathay General Hospital, Taipei 110, Taiwan
(Received 28 May 2002 – Revised 28 October 2002 – Accepted 8 November 2002)
The objective of the present experiment was to examine the effect of substituting different quantities of soyabean protein for casein on renal function and lipid metabolism in rats with chronic renal failure induced by a five-sixths nephrectomy. Experimental animals were subjected to a nephrectomy and fed either casein or soyabean protein (200 or 100 g/kg diet). The diets were isoenergetic with identical fat, Na, K and P contents. Rats ingesting 200 g casein/kg diet showed a significantly (P, 0·05) accelerated course of chronic renal failure, while the soyabean-protein groups showed retarded progression of the experimentally induced renal disease and hypercholesterolaemic effects. Rats in the low-soyabean-protein diet (100 g/ kg) also demonstrated increased serum albumin and decreased serum triacylglycerol, total cholesterol concentrations and blood urea-N; however, the low-casein diet significantly (P, 0·05) increased serum triacylglycerol. Results of the present study show that the replace-ment of casein by soyabean protein was related to the rate of progression of renal failure and improvement in lipid profiles in serum of five-sixths nephrectomized rats.
Soyabean protein: Nephrectomy: Chronic renal failure: Progression: Plasma lipid
Soyabean-protein intake has a profound effect on renal function. Evidence supports the notion that high-animal-protein ingestion accelerates the progression of chronic renal failure (CRF), because it induces glomerular hyperfil-tration by causing increases in renal blood flow and inevi-table glomerular sclerosis, and it is associated with increased urinary protein excretion (Brenner et al. 1982). On the other hand, administration of an equal quantity of soyabean protein does not alter any of these variables (Kenner et al. 1985; Williams et al. 1987; Kontessis et al. 1995, 1990). Abnormal lipid metabolism is also a common symptom in patients with renal disease (Appel, 1991). A meta-analysis of the effects of soyabean-protein intake showed significant decreases in serum cholesterol and tri-acylglycerol compared with effects of animal-protein intake (Anderson et al. 1995, 1999).
However, in those trials it was difficult to know if a normal-soyabean-protein diet could retard the progression of CRF, and the benefits of soyabean protein intake for lowering lipid levels in CRF remain uncertain. The pur-poses of the present study were to investigate the effect of different quantities of soyabean protein and casein on renal function and lipid metabolism in rats with CRF
induced by a five-sixths nephrectomy and to determine whether changes in the dietary protein source were related to the rate of progression of renal failure and to lipid pro-files in serum.
Materials and methods Animals and diets
Fifty-two male Sprague – Dawley rats weighing 200 – 250 g were used in the present study. Animals were housed in individual cages with free access to tap water and received the same diet (standard diet) for 1 week. One week later, forty rats underwent a five-sixths nephrectomy, consisting of the surgical excision of approximately two-thirds of the left kidney, while the entire right kidney was removed. Twelve rats underwent a sham operation, consisting of a laparotomy and manipulation of the kidneys, but without destruction of renal tissue. After this, experimental animals (with the five-sixths nephrectomy) were assigned randomly to four groups (A – D) and were fed either casein (ICN Bio-chemicals, Aurora, OH, USA) or soyabean-protein isolate (Protein Technologies International, St Louis, MO, USA), at 200 or 100 g/kg diet: group A received 200 g casein/kg;
* Corresponding author: Dr Jiun-Rong Chen, fax +886 2 2737 3112, email [email protected] Abbreviation:CRF, chronic renal failure.
group B 100 g casein/kg; group C 200 g soyabean-protein isolate/kg; group D 100 g soyabean-protein isolate/kg. Con-trol animals were assigned to two groups fed either 200 g casein/kg (group E) or 200 g soyabean-protein isolate/kg diet (group F). The diets were isoenergetic and contained equal amounts of fat, mineral, and vitamin supplements (AIN-76; ICN Biochemicals). The compositions of the diets are shown in Table 1. Food powder (30 g) was pre-pared for each animal daily, and the amount ingested was determined by weighing the remaining food.
Data collection
Animals were weighed each week. At 2-week intervals, overnight fasting tail-vein blood and 3 d of 24 h urine were collected. All samples were analysed using a Hitachi 7170S Autoanalyser (Tokyo, Japan). Plasma samples were analysed for albumin, total cholesterol, triacylglycerol, creatinine and urea N; urine was analysed for creatinine, urea-N and protein. Total cholesterol and triacylglycerol were determined after enzymatic reaction with peroxidases (Allain et al. 1974; Spayd et al. 1978). Albumin was deter-mined by the Bromocresol Green method (Doumas et al. 1971), and creatinine by the Jaffe´ reaction method (Fabiny & Ertingshausen, 1971; Soldin et al. 1978). Urea-N was determined after enzymatic reaction with urease and gluta-mate dehydrogenase (Kaltwasser & Schlegel, 1966). Urine protein was determined by the Lowry method (Lowry et al. 1951). The creatinine clearance rate was calculated by the following equation: (urine creatinine concentration (mg/l) £ urine output (ml))/(plasma creatinine concen-tration (mg/l) £ 1440 (min)).
Blood pressure was measured at the beginning and after 12 weeks of the study by the tail-cuff method using a pro-grammed electro-sphygmomanometer (Model 179; IITC Life Science, Woodland Hills, CA, USA). Rats were kept in a dark, warm ð25 ^ 28CÞ and quiet environment during measurements. Rats were placed in an animal restrainer several minutes before beginning the test, and were given plenty of time to acclimatize to the device. At least five readings were recorded, the maximum and minimum values were discarded, and average systolic blood pressure value was calculated from the remaining three values. Rats
were killed 24 weeks later. During the study period, if animals developed renal failure severe enough to threaten survival, we bled the tail-vein blood of moribund animals and then killed them.
Statistical analysis
One-way ANOVA was used to test the significance of differences between control and experimental animals. Two-way ANOVA and Fisher’s least significant difference test were used to test the significance of differences in the quantity and quality of protein between experimental animals. Results are expressed as mean values with their standard errors. A P value of , 0·05 was taken as the level of statistical significance. Animals requiring pre-mature killing were excluded from those comparisons.
Results
Food intake, weight gain and serum albumin Daily food intake of the experimental groups and control groups did not differ. Animals in group A gained signifi-cantly (P, 0·05) less weight and had a lower feed effi-ciency compared with those of the other groups (Table 2). The weight gain and feed efficiency did not significantly differ among the other experimental groups (groups B, C and D) or the control groups (groups E and F). Serum albumin concentrations of animals in group A were significantly (P, 0·05) lower than those of animals in group B and D and the control groups (Fig. 1). Animals in group C had lower concentrations of serum albumin than did animals in group D and the control groups 20 weeks after the nephrectomy, and there were no significant differences in serum albumin concentrations among groups B and D and the control groups.
Renal function
Plasma creatinine and blood urea-N values were mark-edly elevated in the experimental groups after the nephrectomy and were significantly (P, 0·05) higher than those of the control groups. Blood urea-N in animals in group A was significantly (P, 0·05) higher than that of
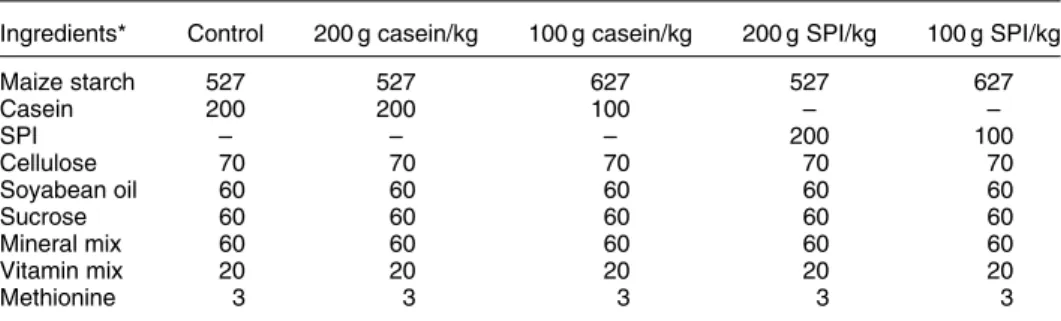
Table 1. Compositions of different protein diets (g/kg)
Ingredients* Control 200 g casein/kg 100 g casein/kg 200 g SPI/kg 100 g SPI/kg
Maize starch 527 527 627 527 627 Casein 200 200 100 – – SPI – – – 200 100 Cellulose 70 70 70 70 70 Soyabean oil 60 60 60 60 60 Sucrose 60 60 60 60 60 Mineral mix 60 60 60 60 60 Vitamin mix 20 20 20 20 20 Methionine 3 3 3 3 3
SPI, soyabean-protein isolate.
* Casein (high-nitrogen), sucrose (food-grade), soyabean oil, mineral mixture (AIN-76 mineral mixture), cellulose (non-nutritive bulk), and vitamin mixture (AIN-76 vitamin mixture) were obtained from ICN Biochemicals (Aurora, OH, USA). Maize starch was purchased from Samyang Genex Corp. (Seoul, Korea). Methionine was obtained from Wako Pure Chemical (Osaka, Japan). SPI was obtained from Protein Technologies International (St Louis, MO, USA).
the other experimental animals throughout the experimen-tal period. There was no significant difference in blood urea-N among groups B, C and D, except for those values between 2 and 12 weeks (P, 0·05, Fig. 2). The urea-N excretion of animals ingesting the 200 g protein/kg diets (groups A, C and E) was significantly (P, 0·05) higher than that of animals ingesting the 100 g protein/kg diets (groups B, D and F), but did not differ between experimental groups with the same quan-tity level of protein (Table 3). Proteinuria was signifi-cantly (P, 0·05) greater in group A than in groups B and D; there were no significant differences among groups B, C and D.
The initial and final serum creatinine levels did not differ among the experimental groups (Table 3). The average slopes of the reciprocal of plasma creatinine v. time by linear regression analysis were found to be: group A2 0·036 (SEM 0·008); group B2 0·020 (SEM 0·002); group C2 0·030 (SEM0·005); group D2 0·021 (SEM0·002).
The slope was significantly steeper in group A than in groups B and D (P, 0·05), and there were no significant differences between groups A and C or among groups B, C and D (Fig. 3). The creatinine clearance rate of group A was significantly (P, 0·05) less than that in the other experi-mental groups, and there were no differences among groups B, C and D.
Plasma lipid profiles and blood pressure
Plasma total cholesterol of animals in group D 8 weeks after the nephrectomy was significantly (P, 0·05) lower than that in group A; plasma total cholesterol of animals in groups B and D differed significantly (P, 0·05) from that of group A 24 weeks after the nephrectomy. Among groups B, C and D, there were no significant differences in total cholesterol (Fig. 4). The plasma triacylglycerol concentration of group B was significantly (P, 0·05) higher than those of the other experimental animals, and Table 2. Food intake, body weight and feeding efficiency of five-sixths nephrectomized animals and sham-operated animals fed differing
protein diets after 24 weeks* (Mean values with their standard errors)
Five-sixths nephrectomy Sham operation
Group. . .† A (n 8) B (n 10) C (n 6) D (n 10) E (n 6) F (n 6)
Mean SEM Mean SEM Mean SEM Mean SEM Mean SEM Mean SEM
Daily food intake (g/d) 25·2 1·7 25·6 0·7 24·8 1·3 26·6 0·8 24·8 2·0 25·6 2·8
Weight gain (g/rat)‡ 392·7a 10·8 501·5b 9·0 455·3b 10·0 514·3b 11·0 439·4b 5·6 445·2b 8·6
Feed efficiency (%)§ 8·5b 0·6 11·1a 0·3 10·3a 0·3 10·3a 0·3 10·5a 0·3 10·6a 0·4
a,bMean values within a row with unlike superscript letters were significantly different (P, 0·05).
* For details of diets and procedures, see Table 1 and pp. 491 – 492.
† A, five-sixths nephrectomized group with 200 g casein/kg; B, five-sixths nephrectomized group with 100 g casein/kg; C, five-sixths nephrectomized group with 200 g soyabean-protein isolate/kg; D, five-sixths nephrectomized group with 100 g soyabean-protein isolate/kg; E, sham operation with 200 g casein/kg; F, sham operation with 200 g soyabean-protein isolate/kg.
‡ Body weight in the 24th week.
§ Feed efficiency (%) = (total weight/food intake) £ 100.
Plasma albumin (g/l) 46 42 38 34 0 4 8 12 16 20 24 * ** * ** * * * * * * * * * * * * * * * * * * * * † † † † † † † Time (weeks)
Fig. 1. Effect of dietary protein on plasma albumin in five-sixths nephrectomized rats. -A-, Group A (five-sixths nephrectomized group with 200 g casein/kg); -B-, group B (five-sixths nephrecto-mized group with 100 g casein/kg); -K-, group C (five-sixths nephrectomized group with 200 g soyabean-protein isolate/kg); -O-, group D (five-sixths nephrectomized group with 100 g soyabean-pro-tein isolate/kg); -W-, group E (sham operation with 200 g casein/kg); -X-, group F (sham operation with 200 g soyabean-protein isola-te/kg. For details of diets and procedures, see Table 1 and pp. 491 – 492. Values are means for six to ten rats per group. Mean values were significantly different from those of group A: *P, 0·05. Mean values were significantly different from those of group C: †P, 0·05.
Blood urea-N (mmol/l)
12 8 4 0 0 4 8 12 16 20 24 * * * ** * * * * * * * * * * * * † † † † † Time (weeks)
Fig. 2. Effect of dietary protein on blood urea-nitrogen in five-sixths nephrectomized rats. -A-, Group A (five-sixths nephrectomized group with 200 g casein/kg); -B-, group B (five-sixths nephrecto-mized group with 100 g casein/kg); -K-, group C (five-sixths nephrec-tomized group with 200 g soyabean-protein isolate/kg); -O-, group D (five-sixths nephrectomized group with 100 g soyabean-protein isolate/kg); -W-, group E (sham operation with 200 g casein/kg); -X-, group F (sham operation with 200 g soyabean-protein isolate/kg. For details of diets and procedures, see Table 1 and pp. 491 – 492. Values are means for six to ten rats per group. Mean values were significantly different from those of group A: *P, 0·05. Mean values were significantly different from those of group C: †P, 0·05.
the greatest concentration occurred between 10 and 16 weeks after the nephrectomy. The plasma triacylglycerol concentration in group C was significantly (P, 0·05) lower than that of group B, and the concentration in group D was also significantly (P, 0·05) lower than that in group B 8 weeks after the nephrectomy. There were no significant differences among groups A, C and D (Fig. 5).
Systolic blood pressure of rats did not significantly differ among each group. After 12 weeks, systolic blood pressure was greater in the experimental groups than in the
control groups; the systolic blood pressure of group A was significantly (P, 0·05) greater than those of the other experimental groups, and there were no significant differences among groups B, C and D (Table 3).
Discussion
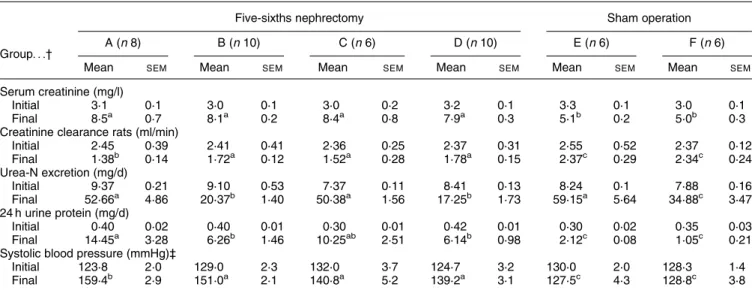
The results of the present study show that rats with CRF, induced by a five-sixths nephrectomy ingesting, 100 g Table 3. Biochemical results and blood pressure of five-sixths nephrectomized animals and sham-operated animals fed different protein diets
after 24 weeks*
(Mean values with their standard errors)
Five-sixths nephrectomy Sham operation
Group. . .† A (n 8) B (n 10) C (n 6) D (n 10) E (n 6) F (n 6)
Mean SEM Mean SEM Mean SEM Mean SEM Mean SEM Mean SEM
Serum creatinine (mg/l)
Initial 3·1 0·1 3·0 0·1 3·0 0·2 3·2 0·1 3·3 0·1 3·0 0·1
Final 8·5a 0·7 8·1a 0·2 8·4a 0·8 7·9a 0·3 5·1b 0·2 5·0b 0·3
Creatinine clearance rats (ml/min)
Initial 2·45 0·39 2·41 0·41 2·36 0·25 2·37 0·31 2·55 0·52 2·37 0·12 Final 1·38b 0·14 1·72a 0·12 1·52a 0·28 1·78a 0·15 2·37c 0·29 2·34c 0·24 Urea-N excretion (mg/d) Initial 9·37 0·21 9·10 0·53 7·37 0·11 8·41 0·13 8·24 0·1 7·88 0·16 Final 52·66a 4·86 20·37b 1·40 50·38a 1·56 17·25b 1·73 59·15a 5·64 34·88c 3·47 24 h urine protein (mg/d) Initial 0·40 0·02 0·40 0·01 0·30 0·01 0·42 0·01 0·30 0·02 0·35 0·03 Final 14·45a 3·28 6·26b 1·46 10·25ab 2·51 6·14b 0·98 2·12c 0·08 1·05c 0·21
Systolic blood pressure (mmHg)‡
Initial 123·8 2·0 129·0 2·3 132·0 3·7 124·7 3·2 130·0 2·0 128·3 1·4
Final 159·4b 2·9 151·0a 2·1 140·8a 5·2 139·2a 3·1 127·5c 4·3 128·8c 3·8
a,b,cMean values within a row with unlike superscript letters were significantly different (P, 0·05).
* For details of diets and procedures, see Table 1 and pp. 491 – 492.
† A, five-sixths nephrectomized group with 200 g casein/kg; B, five-sixths nephrectomized group with 100 g casein/kg; C, five-sixths nephrectomized group with 200 g soyabean-protein isolate/kg; D, five-sixths nephrectomized group with 100 g soyabean-protein isolate/kg; E, sham operation with 200 g casein/kg; F, sham operation with 200 g soyabean-protein isolate/kg.
‡ Blood pressure after 12 weeks.
1.5 1.4 1.3 1.2 1.1 1.0 0.9 0 4 8 12 16 20 24 1/Creatinine Time (weeks)
Fig. 3. Effect of dietary protein on renal function (linear regression of reciprocal of creatinine v. time) in five-sixths nephrectomized rats. -A-, Group A (five-sixths nephrectomized group with 200 g casein/kg); R2 0·901; -B-, group B (five-sixths nephrectomized group with 100 g casein/kg); R2
0·945; -K-, group C (five-sixths nephrectomized group with 200 g soyabean-protein isolate/kg); R2 0·933; -O-, group D (five-sixths nephrectomized group with 100 g soyabean-protein isolate/kg); R20·924. For details of diets and
pro-cedures, see Table 1 and pp. 491 – 492. Values are means for six to ten rats per group.
3.2 3.0 2.6 2.4 2.2 2.0 1.8 1.6 0 4 8 12 16 20 24 Plasma c holesterol (mmol/l) Time (weeks) * * * * * * *
Fig. 4. Effect of dietary protein on plasma cholesterol in five-sixths nephrectomized rats. -A-, Group A (five-sixths nephrectomized group with 200 g casein/kg); -B-, group B (five-sixths nephrecto-mized group with 100 g casein/kg); -K-, group C (five-sixths nephrectomized group with 200 g soyabean-protein isolate/kg); -O-, group D (five-sixths nephrectomized group with 100 g soyabean-protein isolate/kg); -W-, group E (sham operation with 200 g casein/ kg); -X-, group F (sham operation with 200 g soyabean-protein iso-late/kg. For details of diets and procedures, see Table 1 and pp. 491 – 492. Values are means for six to ten rats per group. Mean values were significantly different from those of group A: *P, 0·05.
casein or 100 g soyabean protein/kg diet both reduced the rate of decrease in renal function compared with that of rats fed 200 g casein/kg diet, as established by plotting the reciprocal of plasma creatinine v. time and by the creatinine clearance rate. This is consistent with findings of previous studies in which dietary protein restriction retarded the progression of renal dysfunction in experimental animals (Kenner et al. 1985; Williams et al. 1987; Ihle et al. 1989) and human sub-jects (Soroka et al. 1998).
Animals in the experimental groups ingesting soyabean protein had an improved lipid metabolism compared with those ingesting animal protein. The mechanisms of the hypocholesterolaemic effects of soyabean protein are still under investigation. Some researchers have suggested that soyabean protein contains a different amino acid composition (Huff et al. 1980; Vahouny et al. 1985), a special protein fraction (Lovati et al. 1992; Sugano & Koba, 1993), or other biologically active constituents such as isoflavones, or a combination of factors that lead to altered lipoprotein metabolism. These studies have indi-cated that when soyabean protein is fed to human subjects, cholesterol absorption and bile acid reabsorption are impaired (Huang et al. 1993; Gerhardt & Gallo, 1998), and changes in endocrine status occur involving thyroid hormone, insulin and glucagon (Forsythe, 1990, 1995; Sanchez & Hubbard, 1991; Barth & Pfeuffer, 1998), which are associated with increased clearance of choles-terol and which affect cholescholes-terol metabolism. Soyabean isoflavones, whose structures are similar to those of oestro-gens interact with oestrogen receptors and may decrease serum cholesterol concentrations by similar mechanisms (Anderson et al. 1995). However, the increase in choles-terol levels may also be due to casein being used as the protein component of the diets. Casein was found to be more hypercholesterolaemic than soyabean protein (Sirtori
et al. 1977; Carroll, 1978), and the degree of hypercho-lesterolaemia was increased by adding casein or a casein amino acid mixture to the diet (Terpstra et al. 1981; Kurowska & Carroll, 1990).
In the present study, diets of both the 100 g protein/kg groups contained a higher level (627 g/kg) of maize starch than those of the 200 g protein/kg groups (527 g/ kg). We found that the 100 g soyabean protein/kg group did not differ significantly from the 200 g protein/kg groups in serum triacylglycerol concentration, but the group consuming the 100 g casein/kg diet had significantly (P, 0·05) increased serum triacylglycerol. Soyabean protein may affect triacylglycerol metabolism by suppres-sion of fatty acid synthesis and stimulation of lipolysis. Iritarni et al. (1986, 1996) reported that soyabean protein suppresses hepatic lipogenic enzyme expression, and enzymes for the synthesis of triacylglycerol were markedly lower in rats fed a soyabean-protein diet compared with those fed casein.
Although there were no significant differences found in renal function between the 200 g soyabean protein and 200 g casein protein/kg groups by the slopes of the recipro-cal of plasma creatinine v. time, rats ingesting 200 g soya-bean protein/kg had lower proteinuria, blood urea-N, systolic blood pressure and lipid profiles than those ingest-ing the 200 g casein/kg diet. The creatinine clearance rate in the 200 g soyabean protein/kg group was significantly (P, 0·05) higher than that in the 200 g casein/kg group. Both creatinine clearance rate and the slopes did not differ significantly among the 200 g soyabean protein, 100 g casein and 100 g soyabean protein/kg diets. These results indicate that an unrestricted soyabean-protein diet still had some advantages over an animal-protein diet in terms of renal failure. The results of our present study are consistent with a previous observation that animals fed soyabean protein had much slower progression of renal failure than animals fed casein (Williams et al. 1987). Kontessis et al. (1995) suggested that substituting soyabean protein for animal protein would be effective in reversing the progression of diabetis mellitus-induced nephropathy in human subjects. The mechanism under-lying how a soyabean-protein diet retards the slow pro-gressive effect of CRF has not been fully established. Studies have indicated that soyabean protein does not alter postprandial renal blood flow or glomerular filtration rates, whereas animal protein significantly increases these indices (Kontessis et al. 1990; Pecis et al. 1994). Animals ingesting soyabean protein were noted to have less protei-nuria, less renal hypertrophy, less histological damage to the kidneys and improved survival rates (Williams et al. 1987). Possible ameliorating effects of soyabean protein might induce an alteration in glomerular haemodynamics similar to the effect of protein restriction. Soyabean protein contains small amounts of the amino acids glutamine, pro-line, glycine, alanine and trytophan that are predominately metabolized by the kidney, where they exert vasodilatory effects (Woods, 1993) and can reduce the extent of protei-nuria (Kaysen & Kopple, 1983). Furthermore, soyabean protein contains an angiotensin-converting enzyme inhibitor peptide (Kinoshita et al. 1993) and isoflavones, which have anti-inflammatory potential and therefore
1.6 1.2 0.8 0.4 0.0 0 4 8 12 16 20 24
Plasma triacylglycerol (mmol/l)
† † † † † † † * * * * Time (weeks) ‡ ‡ ‡ ‡ ‡
Fig. 5. Effect of dietary protein on plasma triacylglycerol in five-sixths nephrectomized rats. -A-, Group A (five-five-sixths nephrecto-mized group with 200 g casein/kg); -B-, group B (five-sixths nephrectomized group with 100 g casein/kg); -K-, group C (five-sixths nephrectomized group with 200 g soyabean-protein isolate/ kg); -O-, group D (five-sixths nephrectomized group with 100 g soyabean-protein isolate/kg); -W-, group E (sham operation with 200 g casein/kg); -X-, group F (sham operation with 200 g soyabean-protein isolate/kg. For details of diets and procedures, see Table 1 and pp. 491 – 492. Values are means for six to ten rats per group. Mean values were significantly different from those of group A: *P, 0·05. Mean values were significantly different from those of group C: †P, 0·05. Mean values were significantly different from those of group D: ‡P, 0·05.
may also be contributing factors. Therefore, the benefit of a soyabean-protein diet against the progression of CRF may be due to a consequence of components absent from soya-bean protein, but present in casein.
The results of the present study also showed that a 200 g soyabean protein/kg diet increased serum albumin and weight gain, and decreased blood urea-N when compared with the 200 g casein/kg diet. There is impressive evidence that a soyabean-protein diet may be quite effective in ame-liorating uraemic symptoms and preventing some of the complications of CRF. Previous studies have shown that soyabean protein has a lower nutritive value compared with casein (Drouliscos & Bowland, 1969). However, soyabean protein is now recognized as a complete protein, using the protein digestibility-corrected amino acid score that has been adopted as an alternative method for evaluat-ing protein quality (Food and Drug Administration, 1991; Young, 1991). In the present study, animals ingesting soya-bean protein tended to have increased weight gain, greater feed efficiency and higher serum albumin than those ingesting casein. It is possible that diets supplemented with methionine and/or soyabean protein are relatively low in S-amino acids that may provide an advantage in ameliorating acidosis (Chan, 1974; Remer & Manz, 1994). An increase in serum albumin was also associated with isoflavones, in particular genistein, which has favour-able effects by attenuating the inflammatory cascade (Atluru & Atluru, 1991; Anderson et al. 1995). The hypoalbuminaemia of CRF patients is often related to inflammation (Stenvinkel et al. 2000).
In conclusion, the present study indicated that animals fed 200 g casein/kg diet had significantly (P, 0·05) accelerated progression of CRF and increased serum total cholesterol. The low-soyabean-protein diet (100 g/kg) produced no increase in serum triacylglycerol compared with 100 g casein/kg diet, and rats consuming the low-soyabean diet gained significantly (P, 0·05) more weight and had higher serum albumin concentrations, and lower total cholesterol and blood urea-N than did those consuming 200 g casein/kg diet. We also found that unrestricted soyabean protein (200 g/ kg) can reduce the progression of CRF and hypercholesterol-aemia when compared with casein. These findings provide evidence for the hypothesis that changes in types of dietary protein source are related to the rate of progression of CRF and changes in lipid profiles in serum. All of these features may be helpful during the predialysis phase of treatment for CRF. Further clinical studies are needed to clarify the effects responsible in human subjects for changes in renal function and lipid metabolism that we observed in five-sixths nephrectomized rats.
References
Allain CC, Poon LS, Chan CS, Richmond W & Fu PC (1974) Enzymatic determination of total serum cholesterol. Clinical Chemistry 20, 470 – 475.
Appel GB (1991) Nephrology Forum: lipid abnormalities in renal disease. Kidney International 39, 169 – 183.
Anderson JW, Johnstone BM & Cook-Newell ME (1995)
Meta-analysis of effects of soy protein on serum lipids in humans. New England Journal of Medicine 333, 276 – 282. Anderson JW, Smith BM & Washnock CS (1999) Cardiovascular
and renal benefits of dry bean and soybean intake. American Journal of Clinical Nutrition 70, 464 – 474.
Atluru S & Atluru D (1991) Evidence that genistein, a protein-tyrosine kinase inhibitor, inhibits CD 28 monoclonal-antibody-stimulated human T cell proliferation. Transplant 51, 448 – 450.
Barth CA & Pfeuffer M (1988) Dietary protein and atherogenesis. Klinische Wochenschrift 66, 135 – 143.
Brenner M, Meyer TW & Hostetter TH (1982) Dietary protein intake and the progressive nature of kidney disease. New England Journal of Medicine 307, 652 – 659.
Chan JCM (1974) The influence of dietary intake on endogenous acid production. Nutrition and Metabolism 16, 1 – 9.
Carroll KK (1978) Dietary protein in relation to plasma choles-terol levels and atherosclerosis. Nutrition Reviews 36, 1 – 5. Doumas BT, Warson WA & Biggs HG (1971) Albumin standards
and the measurement of serum albumin with bromcresol green. Clinica Chimica Acta 31, 87 – 96.
Drouliscos NJ & Bowland JP (1969) Biological evaluation of rapeseed meal, soyabean meal and casein fed to the wealing and the mature rat. British Journal of Nutrition 23, 113 – 123. Fabiny DL & Ertingshausen G (1971) Automated
reaction-rate method for determination of serum creatinine with the CentrifiChem. Clinical Chemistry 17, 696 – 700.
Food and Drug Administration (1991) Department of Health claims for food. Federal Register 56, 60537 – 60566.
Forsythe WA (1990) Dietary protein, cholesterol and thyroxine: a proposed mechanism. Journal of Nutrition 36, 101 – 104. Forsythe WA (1995) Soy protein, thyroid regulation and
choles-terol metabolism. Journal of Nutrition 125, 619 – 623. Huang YS, Koba K, Horrobin DF & Sugano M (1993)
Inter-relationship between dietary protein, cholesterol and n-6 poly-unsaturated fatty acid metabolism. Progress in Lipid Research 32, 123 – 137.
Huff MW & Carroll KK (1980) Effects of dietary protein on turn-over, oxidation, and absorption of cholesterol, and on steroid excretion in rabbits. Lipid Research 21, 546 – 558.
Iritani N, Hosomi H, Fukuda H, Tada K & Ikeda H (1996) Soybean protein suppresses hepatic lipogenic enzyme gene expression in Wistar fatty rats. Journal of Nutrition 126, 380 – 388.
Iritani N, Nagashima K, Fukuda H, Katsurada A & Tanaka T (1986) Effects of dietary protein on lipogenic enzymes in rat liver. Journal of Nutrition 116, 190 – 197.
Ihle BU, Becker GJ, Whitworth JA, Charlwood RA & Kincaid-Smith PS (1989) The effect of protein restriction on the progression of renal insufficiency. New England Journal of Medicine 321, 1773 – 1777.
Kaltwasser H & Schlegel HG (1966) NADH-dependent coupled enzyme assay for urease and other ammonia-producing systems. Analytical Biochemistry 16, 132 – 138.
Kaysen GA & Kopple J (1983) Dietary tryptophan supplement prevents proteinuria in the seven-eighths nephrectomized rat. Kidney International 23, 473 – 479.
Kenner GH, Evan AP, Blomgren P, Aronoff GR & Luft FC (1985) Effect of protein intake on renal function and structure in partially nephrectomised rats. Kidney International 27, 739 – 750. Kinoshita E, Yamakoshi J & Kikuchi M (1993) ACE inhibitor in
soy sauce. Journal of Biochemistry 57, 1107 – 1110.
Kontessis PS, Bossinakou I, Sarika L, Aliopoulou E, Papantonou A, Trevisan R, Roussi D, Stipsanelli K & Grigorakis S (1995) Renal metabolic and hormonal responses to protein of different origin in normotensive nonproteinuric type I diabetic patients. Diabetes Care 18, 1233 – 1240.
Kontessis P, Jones S, Trevisan R, Nosadini R, Fioretto P, Borsato M, Sacerdoti D & Di Viberti GC (1990) Renal meta-bolic and hormonal responses to ingestion of animal and vegetable protein. Kidney International 38, 136 – 144. Kurowaka EM & Carroll KK (1990) Essential amino acids in
relation to hypercholesterolemia induced in rabbits by dietary casein. Journal of Nutrition 120, 831 – 836.
Lovati MR, Manzoni C, Corsini A, Frattini R, Fumagalli R & Sirtori CR (1992) Low density lipoprotein receptor activity is modulated by soybean globulins in cell culture. Journal of Nutrition 122, 1971 – 1978.
Lowry DH, Rosebrough NL, Farr A & Randall RJ (1951) Protein measurement with the Folin phenol reagent. Journal of Biologi-cal Chemistry 193, 265 – 275.
Pecis M, Azevedo M & Gross JL (1994) Chicken and fish diet reduces glomerular hyperfiltration in IDDM patient. Diabetes Care 17, 665 – 672.
Remer T & Manz F (1994) Estimation of the renal net acid excretion by adults consuming diets containing variable amounts of protein. American Journal of Clinical Nutrition 59, 1356 – 1361.
Sanchez A & Hubbard RW (1991) Plasma amino acids and the insulin/glucagon ratio as an explanation for the dietary protein modulation of atherosclerosis. Medical Hypotheses 35, 324 – 329.
Sirtori CR, Adrad E, Conti F, Mantero O & Gatt E (1977) Soybean protein diet in the treatment of Type II hyperlipopro-teinemia. Lancet 1, 275 – 277.
Soldin SJ, Henderson L & Hill JG (1978) The effect of bilirubin and ketones on reaction rate methods for the measurement of creatinine. Clinical Biochemistry 11, 82 – 86.
Soroka N, Silverberg DS, Greemland M, Birk Y, Blum M, Peer G
& Ianina A (1998) Comparison of a vegetable-based (soya) and an animal-based low-protein diet in predialysis chronic renal failure patients. Nephron 79, 173 – 180.
Spayd RW, Bruschi B, Burdick BA, Dappen GM, Eikenberry JN, Esders TW, Figueras J, Goodhue CT, LaRossa DD, Nelson RW, Rand RN & Wu TW (1978) Multilayer film elements for clinical analysis: application to representative chemical determination. Clinical Chemistry 24, 1343 – 1350.
Stenvinkel P, Heimburger O, Lindholm B, Kaysen GA & Bergstrom J (2000) Are there two types of malnutrition in chronic renal failure? Evidence for relationships between mal-nutrition, inflammation and atherosclerosis (MIA syndrome). Nephrology Dialysis Transplantation 15, 953 – 960.
Sugano M & Koba K (1993) Dietary protein and lipid meta-bolism: a multifunctional effect. Annals of the New York Academy of Sciences 676, 215 – 222.
Terpstra AHM, Harkes L & van der Veen FH (1981) The effect of different proportions of casein in semipurified diets on the con-centration of serum cholesterol and lipoprotein composition in rabbits. Lipid 16, 114 – 119.
Vahouny GV, Adamson I & Chalcarz W (1985) Effects of casein and soy protein on hepatic and serum lipid and lipoprotein lipid distribution in the rat. Atherosclerosis 56, 127 – 137.
Williams AJ, Baker F & Walls J (1987) Effect of varying quantity and quality of dietary protein intake in experimental renal dis-ease in rat. Nephron 46, 83 – 90.
Woods LL (1993) Mechanisms of renal hemodynamic regulation in response to protein feeding. Kidney International 44, 659 – 675.
Young VR (1991) Soy protein in relation to human protein and amino acid nutrition. Journal of the American Dietetic Association 91, 828 – 835.