Chiao Da Management Review 的1.32No. 1, 2012 pp.29-59
第二次服務失誤和補救的效果
The
Effects
of Second Service Failure and Recovery on
Satisfaction
and Repurchase Intention
徐蕙萍 1 Stacy Huey-Pyng Shyu
國立高雄第一科技大學企業管理研究所
Graduate Institute ofBusiness Management, National Kaohsiung First University of Science and Technology
摘要:過去有許多文獻探討補償對單次服務失誤的影響,惟僅有接少數的研 究著重二次服務失誤結果和其補救 。 許多服務的提供是持續性的,客戶因而 可能經歷多重服務失誤。 本文昌在探究第一次和第二次的服務失誤與補償對 滿意度和再度購買意願的影響 。 本研究方法條採用單因子完全隨機設計,透過餐處服務情境設計,進行 三個不同的補償策略測試:不予補償 , 50% 的折扣補償,的 0% 的折扣補償, 共計有 288位受試者參與研究 。 研究結果發現,第一次和第二次的服務失誤 中,提供補償對滿意度和再度購買意願有顯著影響 。 不過,第一次服務失誤 後,高度的補償和中度的補償相比,再購買之意願只稍略有增加 。 顧客經歷 第二次服務的失誤後 , 顯著地降低滿意度和再息顧的意願'本文最後討論管 理意涵與未來研究方向 。 關鍵詞:補償策略;服務補救;顧客滿意度;優息券
[ Corresponding author: Graduate Institute of Business Management National Kaohsiung First University ofScience and Technology County, Kaohsiung, Taiw仰,E-mail: stacyshyu@gmail com; stacy@nkfust.edu.tw
30 The Effects ofSecond Service Fai/ure and Recovery on Sati抽ctionand Repurchase lntention
Abstract: Many studies have examined the effects of compensation in single service recovery, but few works have examined the consequences of second failure and recovery. Many services are provided on an ongoing base. Customers are likely to experience multiple service failures. This study examines the effects of first and second service failure and compensation on satisfaction and purchase mtentlOn.
This work used a single-factor completely randomized design. Three levels of compensation were employed: no compensation, 50% discount, and 150%
discount. A total of288 subjects participated in the study, which utilizes scenarios in a restaurant setting. Findings indicate that compensation level has a significant influence on satisfaction and repatronage intention for the frrst and second failure. However, compared with a moderate level of compensation, a high level of compensation increased repurchase intentions only marginally for the first failure A high level of compensation increased both satisfaction and repurchase intention only marginally for the second failure. Customers who experience second service failure and recovery reported a significantly lower satisfaction and revisit intention than those at the first time. Managerial implications and directions for future research also are discussed.
Keywords: Compensation strategy; Service recovery; Satisfaction, Coupon
1. Introduction
Despite management's persistent efforts to deliver exceptional service, zero defection is an unrealistic goal in the service delivery (Goodwin and Ross, 1992;
Sundaram
,
Jurowski and Webster,
1997; Webster and Sundaram,
1998). Several studies found that the ability to recover from a service failure favorably affects customers' evaluation ofthe service and the organization (Smith and Bolton, 1998;Tax
,
Brown and Chandrashekaran, 1998). Yet, according to a study by Hart(1988), more than 50% of customers felt more negative about the organization after they had complained about a service failure. Service recovery is very
Chiao Da Managemenl Reνiew Vol. 32 No. 1,2012 31
important because service failures may hurt customer relationship, and failure to detect and resolve those service failures would hurt that relationship even more (Halstead, Morash, and Ozment 1996; Dixon, Freeman and Toman, 2010).
Research has found that when the service provider's reaction to service failure was positive, customers were more satisfied than customers who experienced no service failure at al1 (Kel1ey, H。由nanand Davis, 1993). ln fact
Ma油am (2001) found that some customers would rate a finn higher after a service failure recovery than before a service failure. One reason this phenomenon may occur is that customers are given the oppo此unityto voice their dissatisfaction and receive a favorable outcomes as a result of their actions (Kel1ey Hoffman and Davis, 1993). Likewise, Smith and Bolton (1998) reported that ability to recovery from a service failure favorably affects customers' evaluation of the service and the organization. Zemke and Bel1 (1990) indicated that effective service recovery leads to enhanced perceptions of the quality of products and services, and enhanced perceptions ofthe finn's competence
Compensation is the most common fonn of recovery for service failure (Walster, Berscheid, and Walster, 1973). The effects of compensation level in a single failure were studied by several researchers (e.g., Grewal, Roggeveen and Tsiros, 2008; Smith and Bolton, 1998; Smith, Bolton, and Wagner, 1999; Mattila, 2001; Smith and Bolton 2002; Hoffman, Kel1ey, and Chung, 2003). For ex剖npl巴,
Grewal, Roggeveen and Tsiros (2008) found that compensation improve repurchase intentions for a stable failure (which happens 企equently),but not for an unstable failure for which customers do not consider compensation is necessary. Furthennore, when a company is not considered responsible, compensation does not affect repurchase intentions, regardless of the stability of the failure. Although studies like this were very infonnative, they focused only on a single failure and recovery effort. Many service relationships are on an ongoing base. Customers wil1 likely experience multiple failures. Some longitudinal studies have examined customer satisfaction and intention (e.g., Mittal, Kumar and Tsiros, 1999; Oliver, 1980). However, they did not explore within-subject perception changes fol1owing multiple failures. While Maxham and Netemeyer (2002) conducted a longitudinal study of
32 Theξffects 01 Second Service F ai/ure and Recovery on
Sati.吶ctionand Repurchase Intention
failure and recovery efforts, they didn't examine the effect of compensation levels on satisfaction and repurchase intentions.
The purpose of this research is to test the effectiveness of the recovery eftì。此s on customer's satisfaction level and repurchase intent in the context of multiple service failures. Specifically, the study aims to answer the following questions:
l.In the first and second service failure, how do compensations influence satisfactions and repurchase intentions?
2.How significant, if any, satisfactions and repurchase intentions change after the second service failure/recovery, as compared with those in first service failure/recovery?
2.
Theoretical Background2.
1. Equity Theory,
Prospect Theory and Attribution Theory Recent evidence in services literature suggests that customers involved in service failure and recovery form their perceptions of justice on several factors:the perceived fairness of the service recovery outcome (distributive justice), the perceived faimess of the procedures (procedural justice) and the perccived faimess of the manner in which th巴ywere treated (interactional justice). However, only two components of the equity concept are relevant for the study of service recovery: distributive justice and interactional justice (McCollough, Berry and Yadav, 2000; Goodwin and Ross, 1989, 1992). This study focuses on dis出butive justice. Smith and Bolton (1998) empirically verified that compensation influence distributive justice. From a service recovery perspective, distributive justice reflects the perceived faimess of the tangible outcome of the service recovery. Equity theory suggests that parties involved in an exchange feel equitably treated and thus satisfied if their amount of input to the exchange is somewhat in balance with their output of the exchange. The distributive justice have been emphasized to be critical determinants impacting consumers' evaluations of service recoveηr and satisfaction (e.g. Goodwin and Ross, 1989, 1992; McCollough, Berry and
Chiao Da Management Reνlew的1.32 No. 1,2012 33
Yadav, 2000; Smith, Bolton and Wagner, 1999; T;郎,Brownand Chandrashekaran, 1998)
Prospect theory also offers important insight in service failure and service
recovery research. The theory suggests that dissatisfaction with the service has a greater impact on customer satisfaction and repurchase intention than satisfaction
with the service (Maxham and Netemeyer, 2002). 8ased on prospect theory, consider a customer who su旺ered a service failure before (perceived loss), the restaurant store manager resolved the mistake by explanation, apology profusely and offer compensation interaction (a free meal) at the first time. Suppose that the customer is not satisfied and the same service failure happened for the second
time. Because loss 100m larger than gain, it is likely that customers wiU request a higher level of compensation to restore to satisfactory level. Even if the customer was satisfied with the first recovery, the second failure would remind the customer the first failure. The multiplying effect ofthe two failures would make it much more difficult to win the customer back
Attribution theory would also offer insight into understanding consumer
responses to service failures. Attributions refer to what people perceive to be the
causes behind observed behaviors or events. For negative events, people engage
in spontaneous causal thinking. Most causes can be c1assified on three dimensions locus (the person who is responsible), control (whether the responsible party has
contro1 over the cause), and stability (whether the cause is likely to recur)
Attributions influence both affective and behavioral responses (Bitner, 1990;
Grewal, Roggeveen and Tsiros, 2008). Bitner (1990) found that when
compensation is offered, offering no explanation would appear as an admission of guiIt. Bitner (1990) also found that when customers perceive that tbe firm has control over the cause, they are more dissatisfied than when they believe tbe firm has no control; when customers perceive the cause of the failure is stable, they also are more dissatisfied tban when they believe the failure is rare. Grewal,
Roggeveen and Tsiros, (2008) found that compensation results in higher repurchase intentions when the failure is attributed to a stable cause but has no effect wben the failure is attributed to an unstable cause.
34 The Effects o.fSecond Service Fai/ure and Recoν'ery on Sati吶ctionand Repurchase lntention
2.2. Compensation Strategy and Service Recovery
Researchers defmed compensation as
“
firm provide something extra in atonement" (Du峙, Miller and Bexley, 2006, p.1I4) and can mitigate customers' negative viewpoint to the firm (Wat and Shaffer, 2005). Compensation is regarded as a way for achieving an equitable exchange relationship (Alexander, 2002) Compensation offers some tangible value to verify that the service provider is willing to address poor service delivery and to take responsible for that (Bitner,1990).
The most common forms of compensation are refunds and replacements Hoffman and his colleagues (1995) used critical incident technique to study the restaurant industry and found that replacements and refunds plays very important role in compensation. Other research such as Tax, Brown and Chandrashekaran,
(1998), and Hoffman, Kelley and Chung, (2003) all found that a cash refund could improve customer retention. Other forms of compensation, such as a price discount can also be used in service recovery to improve repurchase intentions,
positive word ofmouth, and satisfaction (Boshoff, 1997; Wirtz and Mattila, 2004). According to Hoffman, Kelley and Chung (2003), all types of compensation - a total replacement of service; a correction (e.g. re-cooked food); or substitution (e.g. providing similar product to replace original) 一 can improve customer satisfaction
3.
Hypothesis3.1.
The Effects of Compensation on Satisfaction and RepurchaseIntention
Critical incident studies of service failures and recovery encounters found that compensation was an effective recovery s仕ategy (Bitner, Booms and Mary,
1990; HOffman, Kelley 祖d Chung, 2003; Kelley, Ho的1anand Davis, 1993). In general, these studies suggest that compensating customers after a service failure leads to more favorable consumer responses, either by dissipating their anger and dissatisfaction or by enhancing their overall experience (Bitner, Boom and Mary,
Chiao Da Management Review 均 1.32 No. 1,2012 35
1990). Tax, Brown, and Chandrashekaran (1998) use content analysis of qualitative evaluations of service complaint experiences to show that compensation is the most impo口ant recovery dimension associated with customers' perceptions of distributive justice. Therefore, higher leve1s of compensation should result in higher distributive justice evaluations, which lead to higher level of customer satisfaction.
Previous research indicates that high service recovery remuneration improves satisfaction with service (Grewal, Roggeveen, and Tsiros, 2008). As compensation increases, so should evaluations of the recovery effort and levels of satisfaction. Additional compensation, where the value is easily discerned
,
would be likely to positively impact the psychological accounting mechanism and, in turn, positively offset any negative imbalance as explained by equity theory. For the second failure, progressively increased compensation would enhance perceptions of distributive justice too.Estelami and DeMaeyer (2002) noted that extant research suggests 也atsuch generosity should positively impact “customer delight" with the exchange and subsequently impact attitude, word of mouth, and repurchase intentions Examples of generosity would inc\ude accepting return merchandise on items not carried by a service provider, accepting cash payments that may be a few cents short, and compensating customers for service failures. Therefore, additional compensation might increase attention, trust, and loyalty among the patrons of the service provider.
Equity may explain how consumers respond to service recoveries (e.g.,
Alexander, 2002; Goodwin and Ross 1992; Smith, Bolton and Wagner, 1999),
such that the effectiveness of recovery efforts may be a function of equity in the exchange (Oliver and Swan, 1989). Service failure and recovery create an exchange in which the consumer experiences a loss due to the service failure and the firm attempts to make up for it in the form of a recovery (Smith, Bolton and Wagner, 1999). In general, to retain customers, companies must ensure that the recovery effort provides a benefit that the consumer believes equitably makes up for his or her loss (Adams, 1965; Deutsch, 1985). In the case of core service failures (e.g., cancellation of a flight), the firm must fix the problem quickly
36 The Effects ofSecond Service Fai/ure and Recoν'ery on 泌的:factionand Repurchase lntenl
(Parasuraman, Beηy and Zeithaml, 1991), but simply fixing the problem (e.g., booking the customer on the next flight) may not be enough. Consumers also may expect to be compensated for the harm done (e.g., 3 hr spent waiting) to preserve the equity oftheir relationship with the company. Equity theory suggest that when service failure occur, customer perceive a loss due to the service failure and compensation is one ofthe effective way to restore equity (Walster, Berscheid and
Wals肘, 1973).
Moreover, social exchange theory highlights the role of distributive justice as it relates to the allocation of costs and benefits in achieving equitable exchange relationships (Adams, 1965; Deutsch 1975, 1985). In terms of service recovery,
distributive justice perceptions involve the allocation of compensation (in the form of discounts, free merchandis巴, refun血, coupons, and so forth) by the organization in response to the inequity caused by a service failure. Walster, Berscheid, and Walster (1973) have shown that compensation is a strategy for restoring equity to an exchange relationship when one party has been harmed by the other. Therefore, higher levels of compensation should result in higher distributive justice evaluations
1n the second failure/recovery, it's likely that the more money (high distributive justice) the firm offers to customers, the more they will be satisfied Therefore, regardless the first or second service failure, the higher levels of compensation will result in the higher level of satisfaction and repurchase intension. Consequently, we proposed this hypothesis
Hl: (a) For the first failures
,
the higher level of the additional service recovery remuneration will lead to the higher levels of (1) satisfaction with the additional recovery 吃ffort, (2)satisfaction with the service,
(3) overall sati,司向ctionand (4) repurchase intention. (b) For the second failures,
the higher level of the additional servicerecovery remuneration will lead ω the higher levels of (1)
sati;吶ctionwith the additional recovery e
fJ
ort,
(2) satisfaction withChiao Da Managemenl Review Vol. 32 No. 1, 2012
3.2.
Effect of the Prior Experience on Customer Satisfaction and Repurchase Intention37
Prospect theory suggests that losses are weighed more heavily than gains (Kahneman and Tversky, 1979; Oliver, 1997). Choong (2001) also used the theory to emphasize that the customer's value function is steeper for losses than for gains And similarly, asymmetric disconfirmation proposes that negative performances impact satisfaction and purchase intentions more than positive performances do
(Mitt祉,Ross, and Baldasare, 1998), In addition, Mittal, Ross and Baldasare (1998)
found that each additional unit of positive performance has diminishing value. Consequently, despite of the additional compensation of the recovery efforts, customers reportmg 訊問 failures may still rate the firm lower. When a second failure occurs to customer, they tend to focus more on the negative consequences associated with the failure, because these negative perceptions are more memorable and embed to complainants' recol1ection. Thus, complainants may become desensitized and underweight to satisfactory recovery efforts, thereby mitigating their positive effects. Prospect theory also suggests that dissatisfaction with the service has a greater impact on customer satisfaction and repurchase intention than satisfaction with the service (Maxham and Netemeyer, 2002)
Moreover, attribution theory also hints diminishing ratings following multiple failures. That is, when multiple failures occur, complainants will Iikely reevaluate their attributions. Stability attributions should play a very important role in customers' judgments elicited after the second service failure. Customers who attribute outcomes to stable and permanent causes are more confident that the same outcome wilI recur than customers who attribute outcomes to unstable causes (Weiner, 1986). Consequently, a customer's inference about whether the cause of the service failure is stable or unstable over time should influence his/her re-patronage intentions (Folkes, 1984; 1988). ln a field study, Folkes, Koletsky and Graham (1987) show that customers' stability attributions influence their propensity to re-patronize an airline. Thus, when a service failure is attributed to a stable (i.e., recurring) cause, customers will have lower cumulative satisfaction and be less likely to re-patronize the organization. For example
,
consider a38 The ξfJects ofSecond Service Fai/ure and Recoνeryon Satisfaction and Repurchase Intention
situation in which bank customers complains about overcharges on their statements. Given that the bank successfully resolves the complaint, attribution theory suggests that complainants may believe that the failure was unique or due to a circumstance beyond the bank's control (i.e., an unstable attribution) (Folkes, 1988). In such cases
,
customers may feel more positive about the firm than before the failure, triggering a recovery paradox. If another failure occurs, though, complainants may discount the circumstantial at的bution and instead believe that the firm consistent1y makes rnistakes (i.e., a stable attribution). Given that, as Weiner (2000, p. 384) has argued, "one cannot logically make unstable attributions for repeated events," customers wi11likely infer that multiple failures are due to problems inherent to the firm. In such cases, even consistent1y satisfactory recoveries may have a tempered impact following multiple failuresTherefore, it is likely that customers who experience two failures wi11
attribute that failure to be stable. Hence, the following hypothesis was proposed.
H2: Regardless of additional recovery 吃Uorts, customers who encounter
two failures will rate their satisfaction with (1) the recovery effort
,
(2)service, β~ overall satisfaction and (4) repurchase intention lower
than their rating ~β'er the fist service recovery.
4.
MethodsAn experiment was conducted to examine the effects of compensation on the effects of satisfaction toward the recovery, toward the service, overall satisfaction, and rep叫chaseintension.
4.
1. Design and ProceduresThis study examines three strategies managers may employ to improve perceived service recovery satisfaction after a service failure, namely giving non compensation, 50% discount compensation and 100% discount plus additional 50% discount coupon compensation.
Chiao Da Management Reνiew Vol. 32 No. 1. 2012 39
one for the frrst failure and the other one for the second failure. ln the version of no compensation, the first scenario is.a customer and hislher friend went out for dinner in the weekend. The customer ordered a medium-cooked steak. After a while, the waiter brought an overcooked steak. The customer noticed the wrong meal and complained to the waiter. The waiter apologized to the customer and called the manager to solve the problem. The customer had to wait three more minutes to see the manager and once again he/she had to explain the problem to the manager. The low recovery in this situation is that the manager says soπY to the customer and he replaced the meal with a good one. ln the second scenario, respondents firstly are requested to think about the previous scenario and then read the second scenario. The second scenario is similar to the first scenario in
scope of service failure and recovery except it happened fo山 months later after the first service failure which was mentioned in the first scenario. We use four months as the duration between two failures because it's not too short which customer can have prejudice with service provider; and it's also not too long so that customer can still remember it. For other two compensation levels, the first and second scenarios are similar to first and second scenarios of the no compensation version in the scope of service failure. They are different in the recovery efforts in which 50% discount and 150% discount for the meals were offered respectively.
This research used a single-factor completely randomized design with three leve1s: No compensation, 50% discount, or 150% discount. Three versions of the instrument were randomly distributed to respondents. Each version contained two
service failure and recovery scenarios. Each of the two scenarios was the same in regards to the recovery attempt (no compensation, 50% discount, or 150% discount). First, participants were asked to read carefully the first scenario and then provide responses to the scale items followed. Then, they were asked to read the second scenario wruch related to the first scenario and answer the question followed. Finally, participants were requested to provide general demographic information.
The between-group sample keeps demand artifacts to a minimum (Shimp, Hya哎, and Snyder, 1991). Although the three scenarios were di缸erent, the
40 The Ejjècls ofSecond Service Failure and Recoνeryon Sali.吶clionand Repurchase Inlenlion
questions in the questionnaire were kept exactly the same to facilitate analysis
4.2.
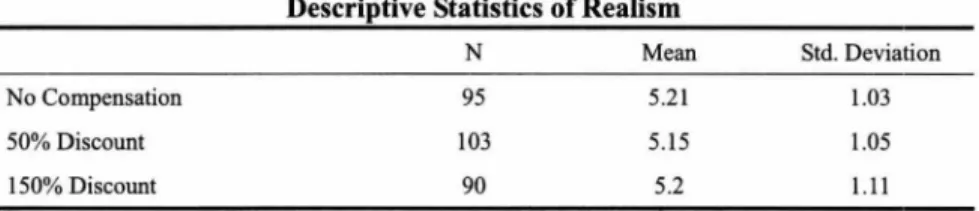
Measures and SubjectsTo assess the realism of the service failure and recovery scenarios, participants were asked to respond to the following items (7-points Likert-type scale).“1 think that a similar problem would occur to someone in reallife (very unlikely to very likely)" and “1 think the situations given in the scenario are: (very unrealistic to very realistic)" (Goodwin and Ross, 1992; Sundaram et al., 1997). The mean score of realistic of scenario for the fir哎, second, and thiJd version of survey is 5.21; 5.15 and 5.2 respectively.
Modified Likert-type scales were adapted 企om prior research to measure four dependent variables: service satisfaction, recovery satisfaction, overall satisfaction, and revisit intention. Service satisfaction, a four-item, seven-point scale, was adapted from Maxham (2001), and Maxham and Netemeyer (2002)
Items used including:
“
1 am satisfied with the service received at this resta叮ant." (1 =very dissatisfied to 7=very satisfied);“In my opinion, the service provided by this restaurant was satisfactory." (l=strongly disagree to 7= strongly agree);“How satisfied are you with the quality of the service provided during this visit to the restaurant?" (1 =very dissatisfied to 7=ve可 satisfied);and “1 am satisfied with the overall dining experience during this visit to the restaurant." (I=strongly disagree to 7= strongly agree)Recovery satisfaction was measured using a three-item seven-point scale adapted from Maxham and Netemeyer (2002). ltems included:“In my opinion, the restaurant provided a satisfactory resolution to the problem on this particular occasion." (1 =very dissatisfied to 7= very satisfied).
“
1 am satisfied with the restaurant's handling of this particular problem." (1 =very dissatisfied to 7= very satisfied).“
1 am satisfied with this particular restaurant experience." (1 =very dissatisfied to 7= very satisfied)Overall satisfaction was measured using a three-item scale adapted from Oliver and Swan (1989) and Maxham and Netemeyer (2002). Items used included:
“1 am satisfied with my overall experience with the restaurant." (1 =very dissatisfied to 7= very satisfied);
“
As a whole, 1 am happy with this restaurant."Chiuo Da MlIJ1l1gemelll Review比/.32 N(). /.20/2 41
(1 =very dissatisfied to 7= very satisfied)
“
Overall, 1 am pleased with the service experience with this restaurant." (1 =very dissatisfied to 7= very satisfied)Revisit intention was measured using a three-item scale adapted 企om
Maxham and Netemeyer (2002) and Blodgett et al. (1997). Items include:
“
Iwould repurchase at this restaurant in the future." (1 =strongly disagree to
7=strongly agree);“There is likelihood that 1 would repurchase at this restaurant
in the future." (I=strongly disagree to 7=strongly agree);“1 will not repurchase at
this restaurant in the near future." (I=strongly disagree to 7=strongly agree)
AII the items were translated into Mandarin and then back translated to
ensure the accuracy of the translation. The questionnaires were administered to senior-Ievel undergraduate students and full time and part time MBA students at a
large university in southem Taiwan. Students who are willing to distribute the
surveys by collecting the data from their friends were rewarded 7-Eleven gift vouchers worth from NT$ 100 to NT$500. Respondentss were randomly assigned to one of the 伽eegroups. A total of355 questionnaires were distributed and 288
usable questionnaires were retumed, representing a response rate of 81 %. It was
felt that the use of students is appropriate since 94.1 % participants familiar with
the restaurant industry mentioned in the scenario (62.8% participants went to
restaurant one to three times per month; and 31.3% reported that they went to
restaurant more than three times per month). Furthermore, students as consumers are commonly selected to be the subjects of studies in prior research. For example,
in Gruber, Szmigin, and Voss (2009) study, students are chosen as respondents
when investigating employee's handling approaches encountered with customers' complaints
5. Results
5.1.
ReliabilityResearcher have suggested manipulation checks to make sure that research
participants perceive the scenarios realistically (realism of scenario), to ensure
42 The Ejj全cts01 Second Service F ai/ure and Recovery on Sati抽ctionand Repurchase Jntention
within experimental 甘eatm凹的, and to check if the manipulation of a factor does not affect other variables than those intended for alteration (discriminant validity)
(Blodge哎, Hill and Tax, 1997; Sundaram, Jurowski and Webster, 1997). To
evaluate the perceived realism of scenarios, participants were asked to respond to two items:
“
1 think the situations given in the scenario are: (l-very unrealistic to 7-very realistic) and“
1 think that a similar problem would occur to someone in reallife (l-very unlikely to 7-very likely)'\F or realism of scenarios, means range from 5.15 to 5.21, indicating that respondents found that it was easy to imagine themselves as participants in the scenarios, and those scenarios were very realistic.Table 1
Descriptive Statistics of Realism
N Mean Std. Deviation
No Compensation 95 5.21 1.03
50% Discount 103 5.15 1.05
150% Discount 90 5.2 l.ll
Reliability of the measurements was estimated using Cronbach's coefficient alpha. The Cronbach alpha levels of each of the scales proved satisfaction with service (Alpha = .94), satisfaction with recovery (Alpha=.92), overal1 satisfaction (Alpha=.94), and repurchase intentions (Alpha=.94). The scales were deemed to be adequate measures of the constructs being investigated, as the majority of alpha's are greater than .9, which well exceeds the minimum recommended of .7
(Nunnal1y 1978).
5.2. ßasic Data Analysis
Table 2 shows the respondents characteristics. Table 3 shows the means and standard deviations of measurement items, inc1uding satisfaction with service, satisfaction with recovery, overall satisfaction, and repurchase intention for the three scenarios. Figure 1 shows the means of these measures. One-way ANOVA was used to analyze the result.
Chiao Da Management Review 均l.32 No. 1.2012 43
Table 2
Respondent Characteristics
Variable Category Numberof Percentage
Respondent Age Under 20 。 4% 21-25 209 72.6% Over 26 78 27.0% Sex Male 166 57.6% Female 122 42.4% Education High school 0.4% College 206 71.7% Graduate school 80 27.9%
RestauBraenht avplaotr ronage
None 。 。%
(AveraMge oTntIhm) es/Per 1-3 181 62.8%
4-7 90 31.3%
Over 8 17 5.9%
Table 3
Sample Size
,
Mean and Standard Deviation of VariablesFirst Service Recovery Second Service Recove立
N Mean Std Deviation Mean Std Deviation Satisfaction with Service
N50o %coDmIspceonusnat tIon 95 4.11 。 99 3.01 1.03
103 4.90 1.31 3.54 0.99
150% Discount 90 5.43 1.04 3.85 1.10
Total 288 4.80 1.25 3.46 1.09
Satisfaction with Recovery
N50o%coDmIspceonusnat tIon 95 4.15 1.02 3.16 1.03
103 5.54 1.06 4 1.00
150% Discount 90 5.97 0.87 4.46 1.08
Total 288 5.22 1.25 3.87 1.16
Overall Satisfaction
N50o %coDmISpCeonmsat tlon 95 4.07 0.94 2.89 0.86
103 5.17 1.18 3.62 1.00
150% Discount 90 5.58 1.05 3.81 1.03
Total 288 4.94 1.23 3.44 1.04
R
N50eo %pcuorDmcIhspacesone usInant hteonn tlon 95 4.3 1.05 2.68 1.00
103 5.27 1.30 3.42 1.09
150% Discount 90 5.52 1.12 3.68 1.15
44 The Ellecls ofSecond Service Fai/ure and Recovery on Sali抽clionand Repurchase lnlenlion Figure 1
Satisfaction with Service
,
Satisfaction with Recovery,
OveraU Satisfaction and Repurchase Intention after the First and the Second Failure/RecoverySatisfaction with Service 6 日0 5.50 5.00 4.50
-.
-NoRec 4.00 -"SO%Rec 3.50 -'-lS0%Rec 3.00 2.50 lsttime 2ndtimeSatisfaction with Recove 吋
6.00 5.50 5.00 4.50 -.回-NoRec 4.00
-.
-50%Rec 3.50 ﹒喧,-150:{,Rec 3.00 2.50 lsttime 2ndtimeChiao Da Management Reνle~ν 的/.32 No. 1.2012 45
Overall Satisfaction
6.00 5.50 5.00 4.50
\
、
『﹒-NoRec 4.00-h
、 國﹒,...50%Rec 3.50 l 、 ﹒喧-150%Rec 3.00 2.50 lsttime 2ndtime Repurchase Intention 6.00 5.50 5.00 代\又去已
-+-No Rec 、 司、‘-
.
- 50%Rec 3.50 i 、 可包 -一 150%Rec 3.00 2.50 lsttime Znd timeFor the no compensation group at the first service failure, the mean scores of
the satisfaction with service; satisfaction with recovery; overall satisfaction and
repurchase intention are all slightly above 4 on a seven-point scale, which indicate
that participants have a neutral or positive feeling and emotion toward the service
46 The EJJec/s 01 Second Service F ai/ure and Recovery on
Sati抽ctionand Repurchase Intention
the mean scores of four variables decrease sharply. The satisfaction with service and satisfaction with recovery are below the middle of 3.5. The overall satisfaction and repurchase intention are even both below 3. For the no compensation group, 企om the first failure to the second failur巴, the repurchase intention fall down most quickly, from 4.30 to 2.68, as compared with other dependent variables, indicating that customers will probably not come back.
Score for the group of 50% discount at the first and second service failures for four items are all higher than the result reported by the group of no compensation. In detail, for the first failure, the mean scores are all above 5 for satisfaction with recovery, overall satisfaction and repurchase intention (5.54; 5.17 and 5.27 respectively). Only satisfaction with service is below 5 (4.90) but still higher than no compensation group which is 4.11. The results indicate that customers are quite satisfied with this recovery and they are likely to come back next time. However, after the second service failure, the mean scores drop significantLy to around 3.5 for satisfaction with service, overall satisfaction and repurchase intention. Only the satisfaction with recovery is higher (4.00). Customers feel a little bit unsatisfied with the service provider after the second service failure. Their probability of coming back for the service would be higher than the respondents in the no compensation group.
Mean scores for the 150% discount group are highest among three groups tested. Respondents at the first failure and recovery reported considerably satisfied with the service (5.43) and with service recovery (5.97). The scores of overall satisfaction and repurchase intention (5.58 and 5.52 respectively) are also higher than two other types of compensation in the item measured. As similar to two previous groups, participants in this group also repo此 a sharp fall at the second service failure and recovery in a11 four items measured. Among the four variables, repurchase intention (3.68) has the lowest score and the highest score is satisfaction with recovery item (4.46). It seems that respondents were satisfied with the recovery, yet they did not intend to come back
Chiao Da Management Review 均1.32No. 1,2012 47
5.3. Test of Research Hypotheses
5.3.1. Effect of Compensation on Customer Satisfaction and Repurchase Intention
The first hypothesis indicates satisfaction with servic巴,recovery satisfaction, overall satisfaction, and revisit intention varies with the level of compensation. It is expected that a 150% discount of service recovery has greater effect on
satisfaction with service, recovery satisfaction, overall satisfaction, and revisit intention than a 50% discount of service recovery; and 50% discount recovery is more effect than no compensation.
First Service Failure/recovery
The means for satisfaction with service were 5.43, 4.90 and 4.11 in the 150% discount, 50% discount and no compensation situation respectiveIy. The direction ofthe means indicates that the higher the compensation level, the higher the levels of satisfaction with service. Levene's Test showed that p = 0.069, indicating that the data meet the homogeneity of variance assumption. Results from ANOVA
analysis show a significant difference in the means [ F(2, 287) = 32.614, p = 0.000]. Post-hoc comparisons using the Tukey HSD test indicated that the mean
score for group with no compensation (group 1) (M = 4.11, SD = 0.98) was
significantly different from group 50% discount (group 2) (M = 4.90, SD = l.31) and group 150% (group 3) (M= 5.43, SD = 1.04). Group 2 was also significant
different from group 3. Therefore, hypothesis l(a) is supported
The means for 150% discount, 50% discount and no compensation situations of the satisfaction with recovery were 5.97, 5.54 and 4.15 respectively. Results
show a significant difference between these means [ F(2,287) = 86.407, p 0.000] . Post-hoc reveals the significant difference occur between the satisfaction with no compensation and 50% discount, and between 50% discount and 150% discount. Therefore, hypothesis 1 (b) is supported
The means for 150% discount, 50% discount and no compensation situations of the overall satisfaction were 5.58, 5.17 and 4.07 respectiveIy. There is
significant difference between these means [ F(2,287) = 49.958, p = 0.000] Post-hoc test result show the significant difference occur between the group ofthe
48 The Effects 01 Second Service F ai/ure and Recovery on Sati.吶ctionand Repurchase Jntention
no compensation and the group with 50% discount, and between the group with 50% discount and the group with 150% discount. Therefore
,
hypothesis I(c) is supportedThe means for repurchase intention were 5.52, 5.25 and 4.30 for the 150% discount, 50% discount and no compensation group respectively. Test of homogeneity of variance ass山nption shows significance level (0.081 > 0.05).
Result show a significant difference in the means [ F(2,287)
=
28.475, P=
0.000]. Post- hoc test indicated that the mean score for group no compensation (M = 4.30, SD=1.05) was significant different from group 50% discount (M= 5.25, SD=1.30)and group 150% (group 3) (M= 5.泣 ,SD = 1.12). However, there is no significant difference between the 50% discount group and 150% discount group. Substantially increased compensation did not increase the revisit intention significantly.
Second Service Failure/recovery
For the second service failure/recovery, satisfaction with service was significantly different [F(2,287) = 15.999,p = 0.000]. The means for satisfaction
with service were 3.85; 3.54 and 3.01 for 150% discount, 50% discount and no compensation group respectively. Post-hoc test indicated that the mean score for group no compensation (M = 3.01, SD = 1.03) was significant different 企om group 50% discount ( M
=
3.54, SD=
1.00) and group 150% (M=
3. 肘 , SD=1.08). However, the difference between the 50% discount group and the 150% discount group is not significant. These results indicate that moderate compensation is effective in enhancing satisfaction with service, but increased compensation beyond that does not improve satisfaction with the service.
The means for satisfaction with recovery at the second service/failure were 4.46, 4.00 and 3.16 for the 150% discount, the 50% discount and no compensation situation respectively. As the first service failure/recovery, here we also frnd a significant difference between means [ F(2,287) = 37.382, P = 0.000]. Post-hoc test indicated that the mean scores of each group are significant different as compared with each other. Means score indicate that the higher levels of recovery compensation, the higher level of satisfaction with recovery.
Chiao Da Managemenl Reνlew 均 1.32 No. 1,2012 49
50% discount and no compensation si仙ationsof the overall satisfaction were 3.81,
3.62 and 2.89 respectively. The mean score of overall satisfaction also
demonstrated significant difference [F (2,287) = 23.779, P = 0.000). Post-hoc test indicated that the mean score for the no compensation group ( M = 2.89, SD =
0.86) was significant different from 50% discount group (M = 3.62, SD = 1.00)
and group 150% (M= 3.81, SD = 1.03). Once again, we cannot find signi日 cant
difference between the 50% discount group and the 150% discount group
The means ofrevisit intention was 3.68 for the 150% discount recovery, 3.42 for the 50% discount recovery
,
and 2.68 for the no compensation recovery.Thereis a significant difference between means [ F(2,287) = 21.848, p = 0.000]
Post-hoc test indicated that the mean score for the no compensation group ( M =
2.68, SD = 1.00) was significant di能rent from the 50% discount group ( M =
3.42, SD = 1.09) and the 150% group ( M = 3.68, SD = 1.15). However, there is
no significant difference between the 50% discount group and the 150% discount
group
Hl(a) predicted that for the first failure, the higher level of additional compensation of recovery is, the higher level of customer satisfaction with service,
satisfaction with recovery, overall satisfaction, and repurchase intention will be
In general, Hl(a) is supported except for the repurchase intention between group
50% discount and group 150% discount. However, only partial support is found for HJ(b). For the second failure, significant differences in satisfaction with
compensation exist among the three levels of compensation. However, we cannot
find the significant difference between group 50% discount and group 150%
discount for satisfaction with service, overall satisfaction and repurchase intention. 1n other word, respondents recelvmg higher level of compensation are more
satisfied with the compensation, yet this higher satisfaction did not tum into
higher satisfaction with service, overall satÎsfaction and repurchase intention. 5.3.2. The Difference in Customer Satisfaction and Repurchase Intention
Between First and Second Failure/Recovery
No compensation
50 The Effects ofSecond Service Fai/ure and Recovery on
Satisfaction and Repurchase Intention
with recovery, overall satisfaction, and revisit intention after the second fail叮e/recovery di宜er from those at the first failure/recovery. Paired-samples t-test was perfonned to test the effect of the same compensation on satisfaction with service, recovery satisfaction, overall satisfaction, and revisit intention. For participants who received no compensation, their satisfaction with service demonstrated significant difference between the first and the second service failure/recovery [ t(94) = 11.738, p = .000]. The means for satisfaction with service were 4.11 and 3.00 for first and second service failure/ recovery which shows that the seconds mean score is lower than the first mean score. Eta square statistic (0.594) indicates the large difference between the first and the second service failure/recovery. There was a statistically significant decrease in satisfaction with recovery scores from the first time of failure/recovery (M = 4.15, SD = 1.01) to the second failure/recovery (M= 3.16, SD = 1.03), [t(94) = 10.日 , p = .000]. The value of Eta square is 0.55 indicating that there is a large difference in these mean scores. The means for overall satisfaction at the first and second service/failure were 4.07 and 2.89, respectively. A significant difference exists with t(94) = 12.90, and p-value =.000. Eta square is 0.639 indicating a large difference in these mean scores. As for revisit intention, the mean score were 4.30 and 2.67 for the frrst and the second service failure/recovery respectively. Revisit intention showed significant difference [ t(94) = 17.68, p = 0.000]. Eta square = 0.769, indicating the significant difference between frrst and second service/recovery
50% discount group
Satisfaction with service demons甘ated significant di缸erence between the first and the second service failure/recovery [ t(102) = 13.01, P = .000]. The means for satisfaction with service were 4.90 and 3.54 for first and second service failure/ recovery. Eta square = 0.624, indicating large difference exists between the first and the second service failure/recovery.
We also find a statistically significant difference in satisfaction with recovery scores between the frrst time of failure/recovery (M = 5.54, SD = 1.06) and the second time of failure/recovery (M=3.54, SD=0.98), [t(102) = 19.12, P = .000] Eta square = 0.782, indicating that there is a large difference in the mean scores.
Chiao Da Managemenl Review Vol. 32 No. 1, 2012 51
The score means for overall satisfaction at the first time and second time of service/failure were 5.16 and 3.62, respectively. Statistical test showed significant
difference exists [1(102) = 15.30,p = .000). Eta square = 0.697, indicating a large difference in these mean scores
Revisit intention showed a significant di宜erence [ 1(102) = 15.93, p = .000] with score mean 5.27 for the first and 3.42 for the second service failure/recovery. Eta square = 0.713, indicating large difference in means.
150% discount group
Participants who received an 150% discount in service recovery following a service failure showed significant difference in satisfaction with service between the first and the second service failure/recovery [ 1(89) = 14.紗,p = .000], with means 5.43 and 3.85 respectively. Eta square statistic (0.714) indicates large difference in means exist.
The means for satisfaction with recovery at the first and second service/failure were 5.97 and 4.46, respectively. Significant difference exists [ 1(89) = 15.23, p = .000]. Eta square = 0.723 indicates large difference in mean scores.
As for overall satisfaction, the means score at the first and the second time service/failure were 5.58 and 3 叭, respectively. Significant difference between two means exists [1(89) = 15.08, p =.000]. Eta square = 0.719, indicating a large difference in these mean scores.
For revisit intention, the mean score were 5.52 for first time of service
failure/recovery and 3.68 for the second time. Revisit intention demonstrated significant difference [ 1(89) = 14.36, P = 0.000]. Eta square = 0.699, indicating large difference between the two mean existed.
The result of Paired-samples 1.test showed that there is a significant
di叮叮ence in the mean scores of satisfaction with service, recovery satisfaction, overall satisfaction, and revisit intention between the frrst and the second service failurel recovery, regardless of the level of compensation. After the second service failure/recovery, participants always rate the restaurant lower than the first failure/recovery. Therefore, hypothesis 2 is supported.
52 The ξ汐ectsofSecond Service Fai/ure and Recoν'eryon
Satisfaction and Repurchase Intention
6.
Discussions and Managerial Implications6.
1. DiscussionsThe purpose of this study was to examine the effect of various levels of compensation in service recovery attempts in multiple service failures. Hl hypothesized that in the both first and second service failure/recovery, a higher level of compensation would lead to higher satisfaction with service, higher satisfaction with recovery
,
higher overall satisfaction,
and higher intention to repurchase. One way ANOVA was used to test this hypothesis. The predicted impacts of levels of compensations on satisfaction and repurchase intention was supported for the first failure/recovery, except repurchase intention between 50% and 150% compensation. For the second failure/recovery, significant differences exist between no compensation and 50% compensation. However, there was no signi日cantdifference in satisfaction with service, overall satisfaction and revisit intention between 50% discount and 150% discount of compensationHypothesis 2 predicted that satisfaction and revisit intention after the second service failure/recovery were always lower then those after the first service failure/recovery, regardless of level of compensation. The hypothesis was supported for all ofthe dependent variables
Grewal, Roggeveen and Tsiros (2008) argued that post-failure compensation mak.e consumer view repurchase as less risky, since they expect the company will compensate them again if a failure were to occur again. Their empirical results confirmed their argurnent. Similarly, this research found that compensation increases the repurchase intention, as compared with no compensation. However,
after the second failure, consumers' repurchase intention dropped significantly,
regardless compensation level. This result showed that consumers come to a service company for the service provided. If the company fails to provide the service twice, consumers will Iikely attribute th巴 problemsas inherent to the firm. This attribution would Iikely to drive them away, despite the compensation. This result is similar to the findings by Dixon, Freeman and Toman (2010) and Maxham nd Netemeyer (2002). Dixon, Freeman and Toman (2010) pointed out
Ch;ao Da Managemenl Rev;ew 的1.32 No.人 2012 53
that company creates loyal customers by helping them solve their problems quickly and easily, not by
“
delight" their customers. Maxham and Netemeyer(2002) found that satisfactory recoveries can produce a
“
recovery paradox" after one failure, but do not trigger such paradoxical results after two failuresThis study has limitations which point to the directions for future studies First and foremost, the use of written scenarios in the study may limit the
emotional involvement of research participants. The respondent's negative
feelings as indicated by the survey instruments may be substantially weaker than
when they experience actual service failure (Hess, Ganesan and K.Iein, 2003;
Mattila, 2001; Smith and 80lton, 2002; Sundaram, Jurowski and Webster, 1997). Future studies may conduct field experiments to further verify tbe results of this
study
Second, the study findings are from a single industry setting (restaurant); lt has been argued that service recovery evaluation is context specific (Hoffman and
Kelley, 2000; Mattila, 2001). A more complete understanding of the e仔ect of service recovery attempt would necessitate the examinations of various categories ofservice
Third, tbere are many di仟erent types of service failures that occur in the restaurant indust旬, and di缸erent service recovery strategies can be used.
Consumers' reactions can vary greatly across different kinds of service problems and service recoveries. This study included only one type of service failure and three levels of service recoveries. Therefore, the way that participants of this
study updated cumulative satisfaction may not be applied to other type of service failures and recovery situations.
Forth, in the experiment, service recovery was manipulated at three level of compensation. The results showed that 50% compensation is significantly
di仔erent 仕om 150% in terms of satisfaction for the first service failure/recovery At what level did the saturation begin? Exactly how much a firm should compensate a particular failure still awaits further studies
Finally, this study did not examine the commitment of consumer toward the
service. When commitment to a brand is low, consumers are expected to process
54 The EJJec/s ofSecond Service Fai/ure and Recoνeryon Sa/i吶ctionand Repurchase Intention
the other hand, is more Iikely to counter argue the negativity (Ahluwalia,
Burnkrant and Unnava, 2000). Thus, commitment may moderate the effect of service failure/recovery on satisfaction and repurchase intention. This moderation effects await further studies.
6.2.
Managerial ImplicationsSince failures are a common occurrence in service setting, this study has important implications for practitioners. First, regardless customer experience the first service failure or the second service failure, managers are advised to give customer compensation instead of no compensation. This is reasonable because based on equity theory, offering compensation tip the balance towards satisfaction.
Second
,
manager should not offer too much compensation for customer. Many service providers think that the more they offer compensation to customer,
the more they satisfied customer. This study shows that this is not the case. Service providers are advised to offer a moderate compensation (e.g. 50% discount) instead ofvery high compensation (e.g. 150% discount) in both first and second service failure because it cost much less while maintaining about the same level of satisfaction and revisit intentionThird, a customer who encounters a second failure is very likely to leave the company for a competitor, regardless the level of compensation. Firm should "red flagged" a customer who has experienced a past problem in the database.
Employees can be trained to take additional care to ensure that the particular customer does not encounter a second failure. Not all service industries maintain formal databases of customers; for example, most restaurants do not (Magnini et
al., 2007). However, the good news is that many other services businesses, such as hotels, airlines, auto maintenance, do use customer databases, and these databases provide the oppo叮叮叮ty to track and monitor the customer service failure history.
Acknowledgments
The author gratefully acknowledges the editor and anonymous reviewers for their constructive comments and suggestions that were instrurnental in improving
Chiao Da Management Reνzew 的 1.32No. 1, 2012 55
this paper. The authors also would like to thank the National Science Council of Taiwan for financially supporting this study under Contracts No 99-2410-H-327-023. Ngo Duc Hau is appreciated for his data collection
7.
References
Adams, J. S. (1965),“Inequity in Social Exchange" In L. Berkowitz, Ed., 1965, Adavances in Experimental Social Psychology , 2, pp. 267-299. New York,
NY: Academic Press
Ahluwa叫lia,R., Bur丘rnkran凶lt,R. E. and Unna盯va,H. R. (ο2000),
tωo Negative PU曲I由blicit句y: The Mo叫de叮raω叫ting Role of Commitme叩nt," Journσlof M必b衍r成ket叫tin嗯'gResearch, 37(2), 203-214
Alexander, E. C. (ο2002) ,
Jou仰Jr‘'nalofB卸usin的ne仰.ssEthics, 36(3), 223-237
Bitner, M. 1. (1990), “Evaluating Service Encounters: The E叮叮ts of Physical Surroundings and Employee Responses," Journal of Marketing, 54(2), 69-82
Bitner, M. J., Booms, B. H. and Mar句y, S. T. (肛1990) ,
Diagnosing Favorable and Unfavorable In昀叫cαid由ents," Journal of Marketing, 54(1),71-84
Bosho缸~ C. (1997), “An Experimental Study of Service Recovery Options,"
lnternational‘fournal of Service lndustry Management, 8(2), 110-130
Blodge仗, J. G且,Hill, D. J., and Tax, S. S. (1 997η) ,
P
昕roωce吋d叮a訓1 , and Interactional Justice on Post Complaint Behavior," Journal
of Retailing, 73(2), 185-210
Choong, P. (2001), “Preventing or Fixing a Problem? A Marketing Manager's Dilemma Revisited," Journal of Services Marketing, 的 (2),99-108.
Deutsch, M. (1975) ,“Equ旬, Equal旬,and Need: What Determines Which Value Will Be Used as the Basis ofDistributive Justice?" Journal ofSociallssues,
31(3),137-150.
Deutsch, M. (1985), Distributive Justice: A Socio-Psychological Perspective, New Haven, CT: Yale University Press.
56 The Ejjècts ofSecond Service F,ω/ure and Recoνeryon Sati吶ctionand Repurchase Intention
Dixon, M., Freeman, K. and Toman, N. (2010),“Stop Tηing to Delight Your
Customers," Harvard Business Review, 88(7/8), 116-122
Du峙, 1. A. M., Miller, 1. M., and Bexl句, J. B., (2006),“Banking Customers' Varied Reactions to Service Recovery Strategies," lnternational Journal
01
Bank Marketing, 24 (2), 112-132.Estelami, H., and DeMaeyer, P. (2002),
Ove叮r-Ge叩neros剖1t吼y仇," Journω叫αalol8品er川vi扣ceRe臼'seωar,陀. eh ,4(3), 205-217 Fo lk:es丸,
v.
S. (I984),Approach," Journal olConsumer Reseαr陀'ch, 10(4),398-409.
Folk肘,
v.
S. (1988),“Recent Attribution Research in Consurner Behavior: A Review and New Directions," Journal01
Consumer Research, 14(3), 548-565Folk:es, V. S., Koletsky, S. and Graham, 1. L. (1987),“A Field Study of Causal Inferences and Consurner Reaction: The View from the Airpo肘,"Journal
01
Consumer Research, 13 (4), 534-539
Goodwin, C. and Ross, 1. (I989),“Salient Dimensions of Perceived Faimess in Resolution of Service Complaints," Journal
01
Consumer Sati.是faction/ Dissati.再向ctionand Complaining Behavior, 2, 87-92Goodwin, C. and Ross, 1. (1992),“Consurner Responses to Service Failures:
Inf1uence of Procedural and Interactional Faimess Perceptions," Journal
01
Business Research, 25(2), 149-164Grewal, D., Roggeveen, A. L. and Tsiros, M. (2008), “The Effect of Compensation on Repurchase Intentions in Service Recovery," Journal
01
Retailing, 84(4),424-434.Gruber, T., Szmigin, 1. and Voss, R. (2009),“Handling Customer Complaints Effectively: A Comparison of the Value Maps of Female and Male Complainants," Managing Service Quali紗, 19(6), 636-656
Halstead, D., Morash, E. A. and Ozme帥, 1. (1996),
Service Failure and Sub.均jective Complaints: An Investigation of Domino andHalo E 缸位ects ,"Journal
01
Bu削4的si的ne臼'ss. Research, 36(2), 10 下115.Hart, C. (1988),“The Power of Unconditional Service Guarantees," Harvard Business Review, 88(4),54-62.
Chiao Da Managemenl Re叫做ν的1.32No. 1,2012 57
Hess, R. L. Jr, Ganesan, S. and Klein, N. M. (2003), “Service Failure and Recovery: The lmpact of Relationship Factors on Customer Satisfaction,"
Journal ofthe Academy ofMarketing 8,ι ience, 31(2),127-145
Hoffman, K. D. and Kelley, S. W. (2000),“Perceived Justice Needs and Recov巴ry Evaluation: A Contingency Approach," European Journal of Marketing,
34(3/4),418-432
Hoffman, K, D., Kelley, S, W. and Chung, 8, C. (2003),“A CIT lnvestigation of Servicescape Failures and Associated Recovery Strategies," Journal of Services Marketi嗯, 17(4), 322-340
Hoffman, K. D., Kelley, S. W. and Rotalsky, H. M. (1995),“Tracking Service Failures and Employee Recovery E仔orts,"Journal of Services Marketing, 9(2),49-61
Kahneman, D. and Tversky, A. (1979), “Prospect Theory: An Analysis of Decision Under Risk," Eωconometr附.
Kelley, S. w., Ho缸man, K. D. and Davis, M. A. (1993),“A Typology of Retail Failures and Recoveries" Journal of Retaili嗯,69(4),429-452
Magnini, V. P, Ford, 1.日, Markowski, E. P and Honeycutt, E.D. (2007),‘The Service Recovery Paradox: Justifiable Theory or Smoldering Myth勻,
Journal ofServices Marketing, 21 (3), 2 日 -225 Mattila, A. S. (ο20ω01以),
S
缸et仙ting,"Journal 0.可fS,品er川Vlκce,臼'sM,α'ark缸etμin嗯'g, 的 (7),583-596
Maxham, J. G. III (2001), “Service Recovery's Inftuence on Consumer Satisfaction, Positive Word of Mouth and Purcbase lntentions," Journal of Business Research, 54( 1), 11-24
Ma油 am, J.G. III, and Netemeyer, R. G. (2002), “A Longitudinal Study of
Complaining Customers' Evaluations of Multiple Service Failures and
Recovery Efforts," Journal of Marketing, 66(4), 57-71
McCollough, M. A., Be汀y, L. L, and Yadav, M. S. (2000), “An Empirical Investigation of Customer Satisfaction after Service Failure and Recovery, " Journal of Serνice Research, 3(2), 12 卜 137
Mitt祉, v., Kumar, P. and Tsiros, M. (1999),“Attribute Performance, Satisfacti凹, and 8ebavioral lntentions over Time: A Consumption System Approach,"
58 The Effects of Second Serνice Fai/ure and Recovery on Satisfaction and Repurchase Intention Journal of Marketing, 63(2),88-101
Mittal, v., Ross, W. T. J. and Baldasare, P. M. (1998),“The Asymmetric Impact on Negative and Positive Attribute-Level Perforrnance on Overall Satisfaction and Repurchase Intentions," Journal of Marketi嗯, 62(1), 33-47
Nunnally, J. C. (1978), Psychometric Theory, 2nd 低, New York, NY: McGraw-Hill.
Oliver, R. L. (1980),“A Cognitive Model of the Antecedents and Consequences of Satisfaction Decisions," Journal of Marketing Research, 17(4), 460-469 Oliver, R. L. (1997), Satisfaction: A Behaνioral Perspective on the Consumeη
New York, NY: McGraw-Hill.
Oliver, R. L. and Swan, J. E, (1989),
Equity and Satisfaction in Transactions: A Field Survey Approach," Journal
ofMa昕rk缸et叫tin啥1咚g, 5臼3(ω2勾), 21-35
Parasuraman, A., Be訂y, L. L. and Zeithaml, V. A. (1991), “Understanding Customer Expectations of Service, " Sloan Management Review, 39, 39-48. Shimp, Terence, A., Hyatt, E. M. and Snyder, D.J. (1991), “A Critical-Appraisal
of Demand Artifacts in Consumer Research," Journal of Consumer Research, 18(3),273-283.
Smith, A. K. and Bolton, R. N. (1998),“An Experimental Investigation of Customer Reactions to Service Failure and Recovery Encounters: Paradox or Peril?" Journal of Services Resea陀h,1(1),65-81
Smith, A. K. and Bolton, R. N. (2002),'‘The Effect of Customers' Emotional
Responses to Service Failures on Their Recovery E在ort Evaluations and Satisfaction Judgments," Journal of the Academy of Marketing Science, 30(1),5-23
Smith, A. K., Bolton, R. N. and Wagner, J. (1999),“A Model of Customer Satisfaction with Service Encounters Involving Failur巴 and Recovery," Journal of Marketing Research, 36(3), 356-372
Sundaram, D. S., J凹owski,C. and Webster, C. (1997),“Service Failure Recovery Efforts in Restaurant Dining: The Role of Criticality of Service Consumption," Hospitali砂 R臼earchJournal, 20(3), 137-149
Chiao Da Management Review 均l.32 No. 1,2012 59
Tax, S. S., Brown, S. W. and Chandrashekaran, M. (1998),
of Service Complaint Experiences: Implications for Relationship Marketing," Journa! of Marketing, 62(2), 60-76
Walster, E., Berscheid, E. and Wals闕,G. W. (1973),“New Directions in Equity Research," Journa! of Personality and Socia! Psychology, 25(2), 151-176. Wat, D. and Shaffer, M. A. (2005)
“
Development and Test of a Social ExchangeModel of OCB. The Mediating Role of Trust in Supervisor and Empowerment," Personnel Review, 34(4),406-422
Webster, C, and Sundaram, D. S. (1998), “Service Consumption Criticality in Failure Recovery," Journal ofBusiness Research, 41(2),153-159.
Weiner, B. (1986), An Attributional Theory ofMotivation and Emotion, New York,
NY: Springer-Ver1ag
Weiner, B. (2000),“Attributional Thoughts about Consumer Behavior," Journal ofConsumer Research, 27(3), 382-387
Wi巾,J. and Mattila A.S. (2004),“Consumer Responses to Compensation, Speed of Recovery and Apology After a Service Failure," lnternational Journal of Service lndustry Manageme例,的 (2), 150-166.
Zernke, R. and Bell, C. (1990), “Service Recovery: Doing Right the Second Time," Training, 27(6), 42-48