Significant thermal property and hydrogen bonding strength increase in
poly(vinylphenol-co-vinylpyrrolidone) copolymer
Shiao-Wei Kuo, Feng-Chih Chang*
Institute of Applied Chemistry, National Chiao Tung University, 1001 Ta Hsuen Road, Hsin Chu 30050, Taiwan, ROC Received 13 November 2002; received in revised form 18 February 2003; accepted 20 February 2003
Abstract
A series of poly(vinylphenol-co-vinylpyrrolidone) (PVPh-co-PVP) copolymers were prepared by free radical copolymerization of acetoxystyrene with vinylpyrrolidone (PAS-co-PVP), followed by selective removal of the acetyl protective group. These copolymers were investigated by solid state nuclear magnetic resonance (NMR) and thermal gravimetric analyzer (TGA) to compare with previous results on differential scanning calorimetry (DSC) and Fourier-Transform infrared spectroscopy (FTIR) analyses. The spin-lattice relaxation time in the rotating frame ðT1rðHÞÞ of the PVPh-co-PVP is greater than the corresponding PVPh/PVP blend, indicating that the polymer mobility is more
restricted and high rigid character of the former. At the same time, the thermal decomposition temperature of homopolymer, copolymer and polymer blend is the order of PVPh-co-PVP copolymer . PVPh/PVP blend . pure PVP homopolymer . PAS-co-PVP copolymer and this order is consistent with previous studies on DSC, FTIR and NMR analyses. In order to understand the mechanism of significant glass transition temperature increase of the PVPh-co-PVP copolymer, the degree of hydrolysis was controlled by varying time of reaction of the PAS-co-PVP copolymer.
q2003 Elsevier Science Ltd. All rights reserved. Keywords: Hydrogen bonding; Copolymer; Solid state NMR
1. Introduction
The role of hydrogen bonding in promoting inter-molecular cohesion and higher glass transition temperature of polymer is a subject of longstanding interest. In general, the glass transition temperature depends upon the physical and chemical nature of the polymer molecules such as structure, molar mass, branching, crosslinking and specific interaction. In our previous study[1], we have found that the glass transition temperatures of poly(vinylphenol) (PVPh)/ poly(vinylpyrrolidone) (PVP) blends are significantly higher than the values predicted by the Fox rule, revealing that this blend system involves strong specific interaction. Further-more, the glass transition temperatures of poly-(vinylphenol-co-vinylpyrrolidone) (PVPh-co-PVP) copolymers are substantially higher than their corresponding PVPh/PVP blends at the same mole fractions of PVPh and PVP due to the composition heterogeneity in hydrogen bonded polymer[2].
In addition, the absorption difference between the free and the hydrogen bonded carbonyl of the PVPh-co-PVP copolymer (30 cm21) is greater than the corresponding PVPh/PVP blend (20 cm21), which is consistent with the observed glass transition temperature behavior.
In addition to the infrared spectroscopy, the solid state NMR spectroscopy also provides a powerful tool to clarify the specific interaction, molecular mobility and the scale of miscibility of polymer involving the hydrogen bond formation[3 – 9]. The13C chemical shift and line shape in cross polarization and magic angle spinning (CP/MAS) spectra can identify chemical environments of carbon in the blend and copolymer since the chemical shift and the line shape are highly sensitive to the local electron density. If a specific interaction affects the local electron density, a change in chemical shift can be observed. Furthermore, the spin-lattice relaxation time in the rotating frame ðT1rðHÞÞ is sensitive to the mobility of polymer chains and domain size is also estimated through the spin-diffusion process.
In this study, the thermal property and specific interaction in poly(vinylphenol-co- vinylpyrrolidone) copo-lymer is investigated by using solid state NMR and thermal
0032-3861/03/$ - see front matter q 2003 Elsevier Science Ltd. All rights reserved. doi:10.1016/S0032-3861(03)00218-0
www.elsevier.com/locate/polymer
* Corresponding author. Tel.: þ886-3-5727077; fax: þ886-3-5723764. E-mail address: [email protected] (F.C. Chang).
gravimetric analysis (TGA) to compare with previous DSC and FTIR results. In order to understand the mechanism of such significant glass transition temperature increase of PVPh-co-PVP copolymer, the degree of hydrolysis was controlled by varying the time of reaction of the PAS-co-PVP copolymer and these copolymers were characterized by using DSC and FTIR analyses. Good correlation between these two methods was observed.
2. Experimental 2.1. Materials
Tetrahydrofuran, N,N-dimethylformamide, benzene, cyclohexane, dioxane, vinylpyrrolidone, acetoxystyrene, and azobisisobutyronitrile (AIBN) were purchased from Aldrich Chemical Co. Inc. The poly(vinylphenol) (PVPh) with a Mw¼ 9000 – 10; 000 were purchased from Poly-science Inc. of USA. The poly(vinylpyrrolidone) (PVP) used in polymer blend is from Aldrich with a Mw¼ 10; 000: 2.2. Blend preparation and preparation of
poly(vinylphenol-co-vinylpyrrolidone) copolymers
Blends of PVPh/PVP with different compositions were prepared by solution blending. N,N-dimethylformamide solution containing 5 wt% polymer mixture was stirred for 6 – 8 h, and the solution was allowed to evaporate slowly at 50 8C for 1 day. The film of the blend was then dried at 80 8C for 2 days to ensure total elimination of solvent. The poly(vinylphenol-co-vinylpyrrolidone) (PVPh-co-PVP) copolymers were prepared by free radical copolymerization of acetoxystyrene with vinylpyrrolidone (PAS-co-PVP), following by selective removal of the acetyl protective group and the detail synthesized procedures are described elsewhere[2].
2.3. Preparation of poly(vinylphenol-co-acetoxystyrene-co-vinylpyrrolidone) copolymers
The degree of hydrolysis was controlled by varying time of hydrolysis reaction of the PAS-co-PVP copolymer and the copolymer was characterized by using DSC and FTIR analyses. The detail characterizations of PAS-co-PVP and PVPh-co-PVP copolymers have been widely discussed in our previous study [2]. The chemical structure of the poly(vinylphenol-co-acetoxystyrene-co-vinylpyrrolidone) copolymer is illustrated inScheme 1.
2.4. Characterizations
Thermal analysis was carried out by a DSC from Du-Pont (DSC-9000). The instrument was calibrated with indium standards. All samples were heated from 30 to 220 8C at the scan rate of 20 8C/min for the first scan and
were maintained at 220 8C for 3 min. The sample was quickly cooled to 0 8C from the melt for the first scan and then scanned between 0 and 300 8C at 20 8C/min. The glass transition temperature is at the midpoint of the specific heat increment. Infrared spectra of polymer blend films were determined by using the conventional NaCl disk method at room temperature. The film used in this study was sufficiently thin to obey the Beer – Lambert law. FTIR measurement was recorded on a Nicolet Avatar 320 FT-IR spectrophotometer and 32 scans were collected with a spectral resolution 1 cm21. High resolution solid state13C NMR experiments were carried out at room temperature using a Bruker DSX-400 Spectrometer operating at resonance frequencies of 399.53 and 100.47 MHz for 1H and 13C, respectively. The 13C CP/MAS spectra were measured with a 3.9 ms 908 pulse, with 3 s pulse delay time, 30 ms acquisition time and 2048 scans. All NMR spectra were taken at 300 K using broad band proton decoupling and a normal cross-polarization pulse sequence. A magic angle sample spinning (MAS) rate of 5.4 kHz was used to avoid absorption overlapping. The proton spin-lattice relaxation time in the rotating frame ðT1rðHÞÞ was determined indirectly via carbon observation using a 908-t-spin lock pulse sequence prior to cross polarization. The data acquisition was performed via1H decoupling and delay time ðtÞ ranging from 0.1 to 12 ms with a contact time of 1.0 ms. The TGA was conducted on a TA 2950 (Du Pont) Thermogravimetric Analyzer under a flowing nitrogen atmosphere at a heating rate of 20 8C/min from 30 to 800 8C. The temperature at which an abrupt decrease in sample weight occurred was designated as the decompo-sition temperature, Td:
3. Results and Discussion 3.1. Solid state NMR analyses
In our previous study, [2] we have found that the observed glass transition temperature is in the order of PVPh-co-PVP (195 8C) copolymer . PVPh/PVP blend
Scheme 1. Chemical structure of PVPh-co-PAS-co-PVP copolymer and their atom schemes.
(175 8C) . pure PVP homopolymer (150 8C) . PAS-co-PVP copolymer (115 8C). We have reported that this result can be properly explained by using FTIR analyses. Beside the FTIR, evidence on association inter-action in polymer blend and copolymer can also be determined by using solid state NMR as demonstrated by the changes in chemical shift or line shape. Moreover, the molecular mobility and domain size of a polymer blend or a copolymer can be estimated by solid state NMR from its proton spin-lattice relaxation times in the rotating frame ðT1rðHÞÞ: The 13C CP/MAS spectra of pure PAS, pure PVP and their PAS-co-PVP copolymers are shown in Fig. 1. The pure PAS has eight resonance peaks and the carbonyl-substituted carbon (C-8) is at 169.4 ppm. Six peaks can be observed for the pure PVP and the resonance peak at 176.5 ppm comes from the carbonyl carbon (C-14). Both C(10)H and C(11)H2 are
attached to the nitrogen atom, similar chemical shift are observed due to the similar chemical environment. The resonance line at 38 ppm for C(9)H2 and at 33 ppm for
C(13)H2 are seen as one broad peak instead of two due
to overlapping. All other peak assignments indicated in Fig. 1 are shown in Scheme 1. Table 1 lists the resonance peak positions for the pure PAS, pure PVP and theirs PAS-co-PVP copolymers.
Chemical shifts in solid state NMR, wavenumbers in
FTIR of the carbonyl carbon of the PAS and PVP, and Tg behavior are shown inFig. 2. The NMR chemical shift of the carbonyl group of PVP in the PAS-co-PVP copolymer decreases with increasing mole fraction of the PAS. On the contrary, the wavenumber of the carbonyl group of PVP in FTIR increases with increasing mole fraction of PAS
Fig. 1.13C CPMAS spectra recorded at room temperature for pure PAS,
pure PVP and various PAS-co-PVP copolymers.
Table 1
Chemical shifts of the13C CP/MAS/DD spectra of PAS, PVP and their copolymers (ppm) Copolymer PAS C-1 C-2 C-3 C-4 C-5 C-6 C-7 C-8 PAS36 42.4 21.2 42.4 122.0 128.9 142.7 150.0 170.5 PAS55 41.4 21.4 41.4 122.5 128.5 143.3 149.8 169.7 PAS91 39.8 21.2 39.8 122.3 127.1 143.3 149.8 169.6 PAS97 40.2 21.2 40.2 122.0 127.7 143.1 149.8 169.2 Pure PAS 40.2 21.1 44.5 121.8 127.7 142.7 149.8 169.4 PVP C-9 C-10 C-11 C-12 C-13 C-14 Pure PVP 38.0 43.9 43.9 19.2 32.4 176.6 PAS36 36.1 42.4 42.4 18.9 32.1 175.7 PAS55 35.8 41.4 41.4 18.6 31.9 175.3 PAS91 – 41.4 41.4 – – 175.3 PAS97 – – – – – –
Fig. 2. Tgbehavior, chemical shift in solid state NMR and wavenumber in FTIR of the carbonyl group of PAS and PVP for pure PAS, pure PVP and various PAS-co-PVP copolymers at room temperature.
content. In generally, the higher wavenumber in FTIR indicates relative weaker interaction between polymer segments. However, the chemical shift in solid state NMR is much more complicated and depends not only on the interaction but also on conformation, chain packing, etc. [10 – 12]. However, by taking into account the interaction factor in solid state NMR, the high field chemical shift (lower chemical shift) of the carbonyl group of PVP indicates that weaker interaction between PAS and PVP segments than the self dipole – dipole interaction of the PVP. Therefore, both solid state NMR and FTIR show the same trend over the entire compositions. Furthermore, the resultant Tg decrease can also be explained by the reduction of dipole – dipole self-interaction of PVP mol-ecules with increasing PAS mole fraction in PAS-co-PVP copolymer based on the solid state NMR and FTIR analyses. Now, we turn our attention to the chemical shift of carbonyl group of PAS in the PAS-co-PVP copolymer in solid state NMR. It decreases to 169.2 ppm (0.2 ppm high field shift) with 3 mol% of PVP, then increases to 170.5 ppm (1.1 ppm down field shift) with 64 mol% of PVP with increasing mole fraction of PVP. In addition, the infrared spectra analysis shows almost the same trend, the self dipole – dipole interaction decreases at lower PVP content and then increases at high PVP content, as a result of the increase in inter-molecular interaction. Considering the chemical structure of the pure PAS and PVP, the dipole – dipole interaction of pure PVP is greater than that of the pure PAS as would be expected due to the observed lower wavenum-ber in FTIR and down field shift in NMR. In PAS-co-PVP copolymer system, we anticipate that the Tg behavior depends on four main factors: (1) the self dipole – dipole interaction of the PAS (PAS – PAS interaction), (2) the interaction between PAS and PVP, (PAS – PVP interaction), (3) the self dipole – dipole interaction of PVP (PVP – PVP interaction) and (4) the inert diluent role to reduce the self-interaction of parent polymer molecules. In addition, the relative strength of the dipole interaction is in the following order: PVP – PVP interaction . PAS – PVP interaction . PAS – PAS interaction. As a result, the carbonyl of PVP shifts to higher wavenumber in FTIR and high-field shift in NMR with increasing PAS mole fraction because the PAS – PVP interaction is relatively smaller than the PVP – PVP interaction. Furthermore, the carbonyl of PAS shifts to higher wavenumber in FTIR and high-field shift in NMR at lower PVP content due to the diluent effect, but the lower wavenumber in FTIR and down-field shift in NMR at higher PVP content because the PAS – PVP interaction is greater than the PAS – PAS interaction. As a result, the self dipole – dipole interaction of PAS decreases at lower PVP content due to the increasing PAS – PVP interaction which is not enough to overcome the diluent effect, decreasing the self dipole – dipole interaction of PAS causing significant decrease in Tg: At a relatively lower PVP content, the diluent role plays the dominant role and thus results in Tg decrease. On the contrary, the PAS – PVP interaction and
PVP – PVP interaction play a dominant role at a higher PVP content and result in Tgincrease. Therefore, the Tgbehavior at higher PVP content shows smaller deviation predicted by the Fox rule than that at lower PVP content.
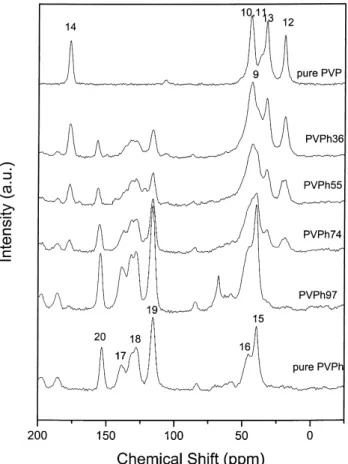
Fig. 3shows the13C CP/MAS spectra of pure PVPh, pure PVP and their respective PVPh-co-PVP copolymers. The pure PVPh has six resonance peaks and the hydroxyl-substituted carbon in the phenolic ring (C-6) is located at 153.2 ppm. All other peak assignments shown inFig. 3are also given inScheme 1. Clearly, the carbonyl carbon of PAS at 169.4 ppm is disappeared after deacetylation while a peak from the hydroxyl group of PVPh-co-PVP copolymer between 153 and 157 ppm appears. The spectra of these copolymers display significant changes in comparison with those of pure homopolymers. Table 2 lists the resonance peak positions for the pure PVPh, pure PVP and theirs PVPh-co-PVP copolymers.
Fig. 4A shows that the chemical shift of the carbonyl carbon of the pure PVP increases with the increase of the PVPh content in the PVPh-co-PVP copolymer. The chemical shift of PVP carbonyl carbon of PAS-co-PVP copolymers (Fig. 4C) from high field (lower chemical shift, 175.3 ppm) to down field chemical shift (higher chemical shift, 177.7 ppm) in PVPh-co-PVP copolymers, indicates the strong specific interaction between PVPh-co-PVP copolymer segments. Therefore, the glass transition
Fig. 3.13C CPMAS spectra recorded at room temperature for pure PVPh,
temperatures of PVPh-co-PVP copolymers are approxi-mately 80 8C higher than those of PAS-co-PVP copolymers because of the transformation of the relatively weaker dipole – dipole interaction of the PAS-co-PVP copolymer into the relatively stronger hydrogen bonding in PVPh-co-PVP copolymer. The hydroxyl-substituted carbon peak in
the phenolic ring (C-6) of the pure PVPh is at 153.3 ppm, a downfield shift of 3.4 ppm is observed in the PVPh36-co-PVP64 copolymer (Fig. 4D) relative to the pure PVPh, implying that strong inter-molecular interaction between the hydroxyl of PVPh and carbonyl (C-14) of PVP. Compared with previous studies [13 – 15] in the chemical shift of hydroxyl-substituted carbon peak of PVPh, a 2.2 ppm downfield shift for the PVPh/PEO blend[13]ðKA¼ 88:3Þ
[16], a 0.9 ppm downfield shift for the PVPh/PCL blend[14] ðKA¼ 66:2Þ [16], and a 0.5 ppm downfield shift for the PVPh/PMMA blend[15]ðKA¼ 37:4Þ[16]were observed, indicating that the hydrogen bonding strength between the hydroxyl group of PVPh and the carbonyl group of PVP (PVPh/PVP blend ¼ 2.7 ppm, PVPh-co-PVP copolymer ¼ 3.4 ppm and ðKA¼ 6000Þ [17]) is stronger than the other blend systems. This result is consistent with the order of inter-association equilibrium constant based on Painter – Coleman association model (PCAM). Interest-ingly, Fig. 4A and D shows that the chemical shifts of hydroxyl (C-20) and carbonyl (C-14) from the PVPh-co-PVP copolymer is greater than its corresponding PVPh-co-PVPh/PVPh-co-PVP blend (Fig. 4B and E), suggesting that the strength of hydrogen bonding within the PVPh-co-PVP copolymer is stronger than the corresponding PVPh/PVP blend. This result is also consistent with the observed glass transition temperature difference between PVPh-co-PVP copolymer and PVPh/PVP blend. In order to understand the glass transition temperature difference between PVPh-co-PVP copolymer and PVPh/PVP blend, we will measure the molecular mobility based on T1rðHÞ value from solid state NMR in the following section.
3.2. Spin-lattice relaxation time in the rotating frame ðT1rðHÞÞ analyses
C13 spin-lattice relaxation time in the rotating frame ðT1rðHÞÞ has previously been shown to be sensitive to the domain size and molecular mobility in polymers. The T1rðHÞ value can be calculated from the following equation:
Mt¼ M0expb 2t=T1rðHÞc ð1Þ
where t is the spin-lock time used in the experiment. M0 and Mt are the intensities of peaks at zero time and at t; respectively.
Fig. 5 shows the plot of lnðMt=M0Þ versus t; for the phenolic carbon at 115 ppm for PVPh. The experimental data give a single exponential decay function as shown in Fig. 5. The T1rðHÞ value can be determined from the slope of the above plot based on Eq. (1). Calculated T1rðHÞ values are summarized inTable 3. A single T1rðHÞ was obtained for both polymer blend and copolymer. Value of the blend system is shorter than that of pure components (PVPh and PVP), indicating that the inter-molecular interaction is stronger than the intra-molecular self-association[18]. This result is consistent with previous equilibrium constants
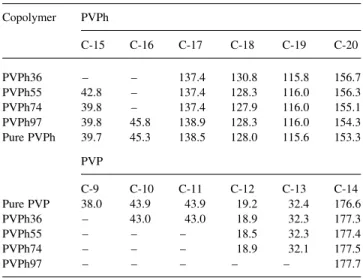
Table 2
Chemical shifts of the13C CP/MAS/DD spectra of PVPh, PVP and their copolymers (ppm) Copolymer PVPh C-15 C-16 C-17 C-18 C-19 C-20 PVPh36 – – 137.4 130.8 115.8 156.7 PVPh55 42.8 – 137.4 128.3 116.0 156.3 PVPh74 39.8 – 137.4 127.9 116.0 155.1 PVPh97 39.8 45.8 138.9 128.3 116.0 154.3 Pure PVPh 39.7 45.3 138.5 128.0 115.6 153.3 PVP C-9 C-10 C-11 C-12 C-13 C-14 Pure PVP 38.0 43.9 43.9 19.2 32.4 176.6 PVPh36 – 43.0 43.0 18.9 32.3 177.3 PVPh55 – – – 18.5 32.3 177.4 PVPh74 – – – 18.9 32.1 177.5 PVPh97 – – – – – 177.7
Fig. 4. Composition dependence of the chemical of the carbonyl group of PAS-co-PVP, PVPh/PVP blend and PVPh-co-PVP copolymer; the hydroxyl substituted carbon of PVPh/PVP blend and the hydroxyl substituted carbon of PVPh-co-PVP copolymer.
ðKA¼ 6000 . KB¼ 66:8Þ and the mixing scale can be estimated using the approximate equation[19 – 21],
L ¼ ð6DT Þ1=2 ð2Þ
For the T1rðHÞ at 10 ms and a effective spin diffusion coefficient, D; of 10216m2s21, the dimension of miscibility of these PVPh/PVP blends is less than 2 – 3 nm. However, the T1rðHÞ values of PVPh (C-19) of copolymer systems show longer than the pure PVPh, indicating that a strong
hydrogen bonding exists between these two components. As a result, the segmental motion of the polymer chain is restricted and causes the relaxation times for those copolymers to be longer than the pure PVPh [7,22]. In addition, the T1rðHÞ value of PVPh-co-PVP is shorter than the PAS-co-PVP, suggesting that the homogeneous domain size of the PVPh-co-PVP is smaller than the PAS-co-PVP. It is reasonable that the strong hydrogen bonding between PVPh and PVP segments that would enhance the miscibility and decrease the domain size. The single T1rðHÞ value obtained for the PVPh-co-PVP copolymer is 9.05 ms which is higher than corresponding PVPh/PVP blend (6.06 ms). That means the PVPh-co-PVP copolymer mobility retar-dation is relatively greater that of the blend, reflecting the more rigid character of the PVPh-co-PVP copolymer. Therefore, the glass transition temperatures of PVPh-co-PVP copolymers are higher than their corresponding PVPh-co-PVPh/ PVP blends, which is consistent with T1rðHÞ values based on solid state NMR analyses.
3.3. TGA analyses
Fig. 6 shows TGA analyses of the PAS74-co-PVP26 copolymer, pure PVP homopolymer, PVPh74/PVP26 blend and PVPh74-co-PVP26 copolymer ranging from 150 to 600 8C. The observed thermal decomposition temperature is in the order of PVPh-co-PVP copolymer . PVPh/PVP blend . pure PVP homopolymer . PAS-co-PVP copoly-mer, which is also consistent with previous DSC analyses. Interestingly, the char yield of these polymers show the same trend as the glass transition and thermal decompo-sition temperatures, revealing that the PVPh-co-PVP copolymers not only have higher glass transition tempera-tures but also have higher thermal stability than other copolymers and blends. This suggests that the more homogeneity and stronger hydrogen bonding between polymers will increase the thermal stability.
Fig. 5. The semi-logarithmic plots of the magnetization intensities of 115 ppm versus delay time for pure PVPh, PVPh/PVP blend and PVPh-co-PVP copolymer.
Table 3
T1rðHÞ values (ms) for PVP, PVPh, their blends and copolymers Compositions (wt%) (PVPh/PVP blend) PVP C-13 PVPh C-19 Pure PVP 15.21 20/80 10.45 4.73 40/60 10.27 5.86 60/40 7.17 6.06 80/20 6.36 6.18 Pure PVPh – 7.24 Copolymers PVP C-13 PVPh C-19 PAS36 12.38 – PAS55 10.05 – PAS74 8.74 – PVPh36 11.63 9.40 PVPh55 9.86 9.05
PVPh74 8.26 7.68 Fig. 6. TGA thermograms of PAS74-co-PVP26, pure PVP, PVPh74/PVP26
3.4. Poly(vinylphenol-co-acetoxystyrene-co-vinylpyrrolidone) copolymers analyses
In order to understand the reason for significant glass transition temperature increase of PVPh-co-PVP copoly-mer, the degree of hydrolysis was controlled by varying time of reaction of the PAS74-co-PVP26 copolymer.Fig. 7 shows the DSC analyses of different degrees of hydrolyses from the same PAS74-co-PVP26 copolymer controlled by varying time of reaction. The glass transition temperature increases with increasing reaction time from 115 8C for the PAS-co-PVP copolymer to 195 8C for the PVPh-co-PVP copolymer. The glass transition temperature gradually increases by increasing the vinylphenol content in the PVPh-co-PAS-co-PVP copolymer. In order to determine the vinylphenol content in the PVPh-co-PAS-co-PVP copoly-mer system, the absorptions between 1490 and 1530 cm21 can be used to determine copolymer compositions in PVPh-co-PAS copolymers[23].
For convenience, we turn our attention on the infrared spectra measured at room temperature ranging from 1490 to 1530 cm21 for pure PAS, pure PVPh and various PVPh/PAS blends as shown in Fig. 8. Clearly, the absorptions at 1512 and 1505 cm21can be assigned as the PVPh and PAS, respectively. For PVPh/PAS blend system, these bands can be easily decomposed into two Gaussian peaks, with areas corresponding to the PVPh (1512 cm21) and PAS (1505 cm21). The curve fitting results are summarized inTable 4. As a result, the calibration curve of the area fraction of PVPh at 1512 cm21 plotted the weight fraction of PVPh is shown inFig. 9. The calibration curve is expressed by Eq. (3):
Y ¼ 0:95X ð3Þ
Therefore, we can easily determine the composition of the PVPh-co-PAS-co-PVP copolymer by Eq. (3).Fig. 10shows scale expanded infrared spectra recorded in the region from 1490 to 1530 cm21for neat PAS-co-PVP, neat PVPh-PVP and various PVPh-co-PAS-co-PVP copolymers prepared
from different hydrolyses times at room temperature. Similar behaviors are expected between these copolymers and blend systems. Therefore, the area fraction of PVPh can also be determined by curve fitting. The corresponding wavenumbers, half widths, curve-fitting areas and the mole fractions for pure PAS-co-PVP, pure PVPh-co-PVP and various PVPh-co-PAS-co-PVP copolymers are summarized inTable 5. Here, we assume that the mole fraction of PVP would not change after deacetylation of PAS-co-PVP copolymer into the PVPh-co-PVP copolymer
Now, we turn our attention to these copolymers based on
Fig. 7. DSC thermograms of degree hydrolysis of PAS74-co-PVP26 copolymers.
Fig. 8. FTIR spectra recorded at room temperature at 1490 – 1530 cm21 region for PVPh/PAS blends: (a) pure PVPh (b) 75/25 (c) 60/40 (d) 50/50 (e) 40/60 (f) 25/75 (g) pure PAS.
Table 4
Curve fitting result of the PVPh/PAS blend at 25 8C PVPh/PAS (wt %) PAS PVPh n (cm21) W1=2 (cm21) Af (%) n (cm21) W1=2 (cm21) Af (%) 0/100 1505.0 10.6 100 – – – 25/75 1507.3 11.8 85.14 1513.4 6.2 14.86 40/60 1506.2 11.1 65.78 1512.8 7.1 34.22 50/50 1506.4 11.4 56.14 1513.0 7.2 43.86 60/40 1506.3 11.4 45.63 1512.6 7.4 54.37 75/25 1506.5 11.5 26.60 1512.7 7.7 73.40 100/0 – – – 1511.7 9.2 100
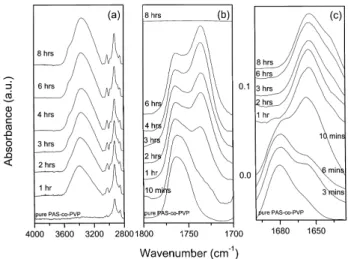
FTIR analyses.Fig. 11shows degrees of hydrolysis of the PAS-co-PVP copolymer controlled by varying time of reaction. In Fig. 11(b), the wavenumbers at 1763 and 1735 cm21 are assigned as free and hydrogen bonded carbonyl group of the PAS, respectively. The fraction of hydrogen-bonded carbonyl group of PAS is increased with increasing reaction time due to the increasing vinylphenol content in the PVPh-co-PAS-co-PVP copolymer. Further-more, the carbonyl group of PAS completely disappeared when the reaction time is 8 h, implying that the
acetoxy-styrene is completely transformed into the vinylphenol. FromFig. 11(c), the carbonyl group of the PVP shifts from 1682 cm21(PAS74-co-PVP26) to 1650 cm21 (PVPh74-co-PVP26) due to the strong hydrogen bond existing between the carbonyl group of PVP and the hydroxyl group of PVPh. Clearly, the strength and fraction of hydrogen-bonded carbonyl group of PVP is increased with increasing the vinylphenol content in PVPh-co-PAS-co-PVP copolymer. Fig. 11(c)also shows a shoulder at 1640 cm21is gradually increased with increasing the vinylphenol content, which is assigned as the ‘multimer’ hydrogen bonding between the PVP carbonyl group and the PVPh hydroxyl group. Interaction mechanisms of PAS, PVP and PVPh segments are summarized inScheme 2.
For convenience, the degree of hydrolysis of the PVPh-co-PAS-co-PVP copolymer should also be taken into account the hydroxyl group of PVPh in the infrared spectrum. Therefore, we now turn our attention to focus on the hydroxyl-stretching region. Fig. 11(a) shows the absorption region between 2700 and 4000 cm21of the pure PAS-co-PVP copolymer, pure PVPh-co-PVP copolymer and various PVPh-co-PAS-co-PVP copolymers at room temperature. Pure PAS-co-PVP copolymer shows no hydroxyl stretching between 3100 and 3700 cm21 as would be expected. However, a broad absorbance band of the hydroxyl group of the PVPh-co-PAS-co-PVP copolymer between 3100 and 3700 cm21appears and the total area of this hydroxyl absorption increases with the increase of the vinylphenol content. The broad band centered at 3420 cm21 and a shoulder at 3525 cm21, corresponding to the multimer hydrogen bonded hydroxyl group and free hydroxyl group, respectively. The peak frequency of this broad band shifts to lower wavenumber with increasing PVP content.
The peak frequency of this broad band hydrogen bonding at 3400 cm21 of the PVPh-co-PAS-co-PVP copolymer (PVPh39-co-PAS35-co-PVP26) shifts to lower frequency with increasing reaction time of PVPh-co-PAS-PVP
Fig. 9. The calibration curve of area fraction of wavenumber at 1512 cm21
versus different PVPh content.
Fig. 10. FT-IR spectra in 1490 – 1530 cm21region for pure PAS-co-PVP
and different degree of hydrolysis of PAS-co-PVP copolymers.
Fig. 11. Infrared spectra of PVPh-co-PAS-co-PVP copolymer at room temperature in the hydroxyl-stretching region of PVPh (a), carbonyl stretching region of PAS (b) and carbonyl stretching region of PVP (c).
copolymer at the vicinity of 3350 cm21of the pure PVPh-co-PVP copolymer. This result reflects a new distribution of hydrogen bonding formation resulting from the hydroxyl group of PVPh with both carbonyl groups of PAS and PVP
to only with PVP carbonyl. The hydroxyl groups of PVPh are able to totally hydrogen bonded with both carbonyl groups of PAS and PVP at a relative lower PVPh content. On the contrary, at a relatively higher PVPh content, certain
Table 5
Curve fitting result of the PVPh-co-PAS-co-PVP copolymer from different hydrolysis at 25 8C
Time (hour) PAS PVPh fha Copolymerb(PVPh[X]
co-PAS[74-X]-co-PVP26 n(cm21) W 1=2(cm21) Af(%) n(cm21) W1=2(cm21) Ab(%) 0.05 1506.4 11.4 85.76 1513.9 7.3 14.24 15.02 PVPh14-co-PAS61 1 1506.3 12.1 50.08 1513.7 7.3 49.92 52.67 PVPh44-co-PAS30 2 1507.6 12.3 40.87 1513.8 7.1 59.13 59.13 PVPh49-co-PAS25 3 1506.9 11.8 27.52 1513.3 7.4 72.48 76.47 PVPh59-co-PAS15 4 1508.0 12.3 26.05 1513.3 7.8 73.95 78.02 PVPh61-co-PAS13 6 1507.8 12.6 14.47 1513.0 8.0 85.53 90.23 PVPh68-co-PAS6 8 – – – 1512.3 7.9 100 100 PVPh74 a fh: degree of hydrolysis. b
The actual mole fraction of PVPh needs to transfer from weight fraction to mole fraction
free hydroxyl groups of PVPh are still present due to relatively smaller mole fraction of carbonyl groups from PVP than the hydroxyl groups of PVPh in PVPh [74]-co-PVP[26] copolymer. As a result,Fig. 11(a)shows that the intensity of the free hydroxyl group of PVPh at 3525 cm21 increases gradually with increasing vinylphenol content in PVPh-co-PAS-co-PVP copolymer. Interestingly, although the amounts of hydroxyl groups increases with the increase of vinylphenol content, the intensity of free hydroxyl group of PVPh also increases with increasing the vinylphenol content for the PVPh-co-PAS-co-PVP copolymer. Even though the pure PVPh-co-PVP copolymer shows the greatest intensity of the free hydroxyl group, the glass transition temperature of the pure PVPh-co-PVP copolymer is still greater than the other PVPh-co-PAS-co-PVP copolymers. Here, we confirm that the glass transition temperature of PVPh-co-PAS-co-PVP copolymer depends on the frequency difference between the free and the hydrogen bonded hydroxyl groups.
4. Conclusions
The relative strength of the dipole interaction is in the following order: PVP – PVP interaction . PAS – PVP interaction . PAS – PAS interaction. Therefore, the incor-poration of acetoxystyrene into PVP results in lower glass transition temperature and lower thermal decomposition temperature due to lower dipole – dipole interaction between PAS and PVP segment than the self-association of PVP. However, after deacetylation of the acetoxystyrene to form the PVPh-co-PVP copolymer, the glass transition tempera-ture, thermal decomposition temperature and spin-lattice relaxation time in the rotating frame ðT1rðHÞÞ are substan-tially higher than the pure PVPh, and corresponding PVPh/PVP blend due to the stronger hydrogen bonding in copolymer systems based on FTIR and solid state NMR analyses. Finally, the extent of glass transition temperature increase of PAS-co-PVP copolymer to transform PVPh-co-PVP copolymer is increased gradually by increasing the vinylphenol content in the PVPh-co-PAS-co-PVP
copoly-mer and good correlation between FTIR and DSC analyses was observed.
Acknowledgements
This research was financially supported by the National Science Council, Taiwan, Republic of China, under Contract Nos. NSC-91-2216-E-009-018. The authors would like to thank Miss S. Y. Fan for her help with NMR measurements.
References
[1] Kuo SW, Chang FC. Macromolecules 2001;34:5224.
[2] Kuo SW, Xu H, Huang CF, Chang FC. J Polym Sci Polym Phys Ed 2002;40:2313.
[3] Hill DJT, Whittaker AK, Wong KW. Macromolecules 1999;32:5285. [4] Miyoshi T, Takegoshi K, Terao T. Macromolecules 1999;32:8914. [5] Wu HD, Ma CCM, Chang FC. Macromol Chem Phys 2000;201:1121. [6] Qin C, Pires ATN, Belfiore LA. Macromolecules 1991;24:666. [7] Wang J, Cheung MK, Mi Y. Polymer 2001;42:2077.
[8] Asano A, Eguchi M, Shimizu M, Kurotsu T. Macromolecules 2002; 35:8819.
[9] Lau C, Mi Y. Polymer 2002;43:823.
[10] Qin C, Pries ATN, Belfiore LA. Polymer Commun 1990;31:177. [11] Miyoshi T, Takegoshi K, Terao T. Polymer 1997;38:2315. [12] Mathias LJ, editor. Solid state NMR of polymer. New York: Plenum
Press; 1991.
[13] Jack KS, Whittaker AK. Macromolecules 1997;30:3560. [14] Wang J, Cheung MK, Mi Y. Polymer 2002;43:1357.
[15] Zhang X, Takegoshi K, Hikichi K. Macromolecules 1991;24:5756. [16] Coleman MM, Graf JF, Painter PC. Specific interactions and the
miscibility of polymer blends. Lancaster, PA: Technomic Publishing; 1991.
[17] Hu Y, Motzer HR, Etxeberria AM, Fernadez-Berridi MJ, Iruin JJ, Painter PC, Coleman MM. Macromol Chem Phys 2000;201:705. [18] Wang J, Cheung MK, Mi Y. Polymer 2001;42:3087.
[19] McBrierty VJ, Douglass DC. J Polym Sci Macromol Rev 1981;16: 295.
[20] Demco DE, Johansson A, Tegenfeldt J. Solid State Nucl Magn Reson 1995;4:13.
[21] Clauss J, Schmidt-Rohr KWH. Acta Polymer 1993;44:1. [22] Lau C, Zheng S, Zhong Z, Mi Y. Macromolecules 1998;31:5756. [23] Xu Y, Graf J, Painter PC, Coleman MM. Polymer 1991;32:3103.