行政院國家科學委員會專題研究計畫 成果報告
企業風險管理與公司冒險行為之關係
研究成果報告(精簡版)
計 畫 類 別 : 個別型 計 畫 編 號 : NSC 100-2410-H-004-030- 執 行 期 間 : 100 年 08 月 01 日至 101 年 07 月 31 日 執 行 單 位 : 國立政治大學風險管理與保險學系 計 畫 主 持 人 : 陳彩稚 計畫參與人員: 碩士班研究生-兼任助理人員:陳虹羽 公 開 資 訊 : 本計畫可公開查詢中 華 民 國 101 年 09 月 18 日
中 文 摘 要 : 本文主要目的在於探討企業風險管理(Enterprise Risk Management, ERM)與公司冒險行為之關係,尤其著重於公司 對於風險管理之重視程度,對於企業經營之積極性與穩定性 的影響。由於企業風險管理範圍甚廣,無法全部納入討論, 因此本文主要著重於下列三方面:(1)董事會、(2)風險胃 納、(3)風險文化。 本文將進行實證分析研究,以我國上市 櫃公司為樣本,瞭解目前我國公司之企業風險管理之狀況。 根據實證研究結果,本文發現重視風險管理的公司不必 然有較佳之董事會。其次,風險胃納與董事會規模及風險管 理重視程度有顯著相關。此外,研究結果亦顯示重視風險管 理之企業,其資本支出與 R&D 支出較高,亦即較積極從事冒 險計畫,而另一方面這些公司之現金持有量與稅前盈餘亦較 高,表示其發生流動性不足或是虧損之機率較低,亦即公司 經營較為穩定。 整體而言,本研究發現目前台灣上市櫃公司中約有 50% 已經注意到風險管理的觀念,而對於風險管理的重視,並不 會使企業裹足不前、限制其積極冒險的投資行動,但同時又 能注意維持較高之流動性與獲利性。因此,風險管理的重 視,對於企業經營具有正面的功能。 中文關鍵詞: 企業風險管理、經營策略、風險文化、 風險胃納、公司冒險 行為
英 文 摘 要 : The purpose of this paper is to investigate the
relationship between enterprise risk management (ERM) and firm risk-taking behavior, with emphasis on the impact of corporate ERM perception on firm’s
operational stability. This paper focuses on the following three items: (1) the board, (2) risk appetite, and (3) risk culture because they are the primary elements of internal risk environment
according to COSO-ERM process.
According the empirical analysis, the results do not strongly support the hypothesis that firms with more RM attention will present better corporate
governance. However, the risk appetite shows a negative relationship with board size and RM
attention. The empirical results show that firms with higher RM attention have higher capital and R&D
expenditures, cash-holding, and earnings. That is, RM attention does not restrict risky investment
strategies, and at the same RM attention also help to maintain higher liquidity and earnings to avoid
financial distress and litigation risk. The risk appetite does not have a significant impact on risk-taking strategies.
In summary, this paper finds that there about 50% of public firms in Taiwan have already paid attention to risk management. RM attention does not confine risk-taking strategies (e.g., capital and R&D
expenditures) but encourage them. This is in fact the purpose of COSO-ERM --- an integrated RM policy which makes a firm not to miss its business opportunity but at the same time avoid financial distress.
英文關鍵詞: enterprise risk management, corporate strategies, risk culture, risk appetite, firm risk-taking.
Enterprise Risk Management and Firm Risk-Taking
Tsai-Jyh Chen
Department of Risk Management and Insurance National Chengchi University
Abstract
The purpose of this paper is to investigate the relationship between enterprise risk management (ERM) and firm risk-taking behavior, with emphasis on the impact of corporate ERM perception on firm’s operational stability. This paper focuses on the following three items: (1) the board, (2) risk appetite, and (3) risk culture because they are the primary elements of internal risk environment according to COSO-ERM process.
According the empirical analysis, the results do not strongly support the hypothesis that firms with more RM attention will present better corporate governance. However, the risk appetite shows a negative relationship with board size and RM attention. The empirical results show that firms with higher RM attention have higher capital and R&D expenditures, cash-holding, and earnings. That is, RM attention does not restrict risky investment strategies, and at the same RM attention also help to maintain higher liquidity and earnings to avoid financial distress and litigation risk. The risk appetite does not have a significant impact on risk-taking strategies.
In summary, this paper finds that there about 50% of public firms in Taiwan have already paid attention to risk management. RM attention does not confine risk-taking strategies (e.g., capital and R&D expenditures) but encourage them. This is in fact the purpose of COSO-ERM --- an integrated RM policy which makes a firm not to miss its business opportunity but at the same time avoid financial distress.
Keywords: enterprise risk management, corporate strategies, risk culture, risk appetite, firm risk-taking.
中文摘要
本文主要目的在於探討企業風險管理(Enterprise Risk Management, ERM)與公司冒險行為之關係,尤其著重於公司對於風險管理之重視程度,對於 企業經營之積極性與穩定性的影響。由於企業風險管理範圍甚廣,無法全部納 入討論,因此本文主要著重於下列三方面:(1)董事會、(2)風險胃納、(3)風險 文化。 本文將進行實證分析研究,以我國上市櫃公司為樣本,瞭解目前我國公 司之企業風險管理之狀況。 根據實證研究結果,本文發現重視風險管理的公司不必然有較佳之董事 會。其次,風險胃納與董事會規模及風險管理重視程度有顯著相關。此外,研 究結果亦顯示重視風險管理之企業,其資本支出與 R&D 支出較高,亦即較積極 從事冒險計畫,而另一方面這些公司之現金持有量與稅前盈餘亦較高,表示其 發生流動性不足或是虧損之機率較低,亦即公司經營較為穩定。 整體而言,本研究發現目前台灣上市櫃公司中約有 50%已經注意到風險管 理的觀念,而對於風險管理的重視,並不會使企業裹足不前、限制其積極冒險 的投資行動,但同時又能注意維持較高之流動性與獲利性。因此,風險管理的 重視,對於企業經營具有正面的功能。 關鍵詞:企業風險管理、經營策略、風險文化、 風險胃納、公司冒險行為。
Enterprise Risk Management and Firm Risk-Taking
I. Introduction
In the modern economy a firm’s perception and concern on risks is critical for its business strategies. Enterprise risk management (ERM) is a new concept which integrates several aspects of business risks, including strategic risk, operational risk, financial and hazard risk (Slywotzky and Drzik, 2005). The unexpected failures of several large public companies in recent years have urged the investors to pay more attentions to a firm’s risk management. Managing the integrated business risks (i.e. ERM) has increasingly become an important issue since the business environment is more complicated and business risks are more diversified nowadays (Nocco and Stulz, 2006). ERM regards risk as opportunity that may make a firm profitable and successful. The ERM’s view of risk is different from traditional risk management which considers risk as a hazard and negative to a firm’s profitability. The risks in ERM are embedded in all of business strategies and operations. These risks are connected to each other and critical to firm performance, including firm value and risk-taking behavior. Today most of the rating agencies such as Standard & Poor’s and Moody’s regard ERM as an important factor for credit rating. The U.S. accounting organization COSO (Committee of Sponsoring Organizations of the Treadway Commission) has already provided a framework of ERM and replace it for internal control and auditing. Most companies are eager to establish their ERM strategies. Several new books of ERM are published recently, e.g,, Moeller (2007), Hampton (2009), and Cendrowski and Mair (2009). However, the experiences of ERM are still new and the academic research related to its impact is limited.
Although the risk management has been an important topic in corporate finance, the previous studies usually focus on financial risk management instead of all aspects of corporate risks, e.g., Froot (1998) and Fatemi and Luft (2002). The analysis of
ERM and is not popular yet (Paladino, Cuy, and Frigo, 2009), which is probably due to data constraints because ERM is related to all aspects of business operations in addition to finance. As more and more unexpected cases of corporate failure happened not simply resulting from financial risk, the business decision makers now pay great attentions to ERM because an integrated risk management is a must for a firm to survive and success. Now many firms set up an ERM committee under the board of directors to monitor the aggregate business risks because the firm’s risk-taking strategies are critical for protections to investors.
The risk management policy of a firm contributes to the relationship between corporate success and their business strategies for several reasons. First, firm risk-taking results from the strategic decisions made by the directors and top management who can affect firm’s ability to survive and success. Second, the outcomes of risk-taking decision turn out to influence firm value and consequently the investors’ support. Third, the firm’s risk-taking strategy affects financial and economic fragility, which intensifies interest in understanding the impact of risk management strategies on corporate social responsibility (Godfrey, Merrill, and Hansen, 2009).
Numerous studies have investigated the relationship between board structure and firm risk-taking (Akhigbe and Martin, 2008; Pathan, 2009). Additionally, many studies focus on the impact of managerial compensation on firm risk-taking (Low, 2009; Coles, Daniel, and Naveen, 2006). Although the board and top management are important to firm risk-taking, they are not the overall scope of ERM. The purpose of SOX and its requirements in corporate governance in fact is to provoke the attention to ERM which stabilizes the business operations and prevents unexpected failure (section 404 of SOX, Chapman, 2006). That is, through the process of ERM which includes board composition, managerial compensation and other risk management
strategies, a firm can achieve its ultimate goal of corporate governance.
According to the definition of ERM in COSO (2004), “Enterprise risk management is a process, effected by an entity’s board of directors, ……, manage risk to be within its risk appetite, to provide reasonable assurance regarding the achievement of entity objectives.” In COSO’s 8-step ERM process, the foundation for a firm to implement risk management policy is its internal environment which includes risk culture, risk appetite, the board, etc. That is, as the business environment is more complicated and business risks are more diversified nowadays, the qualitative risks of business strategies are also critical to a firm’s survival and success in addition to quantitative risks. Frigo and Anderson (2011) suggest that strategic risk management processes and capabilities are important foundation for improving risk management and governance.
The purpose of this paper is to study the relationship between firm’s ERM policy and its risk-taking behavior, which has important implications for the stability of business operations and profitability. Since the full scope of ERM policy may be too broad to study within one paper, this paper will only focus on the following three items: (1) the board, (2) risk appetite, and (3) risk culture because they are the primary elements of internal environment according to COSO-ERM process. The board is the decision maker for firm risk-taking and crucial for corporate governance. Risk appetite is a restriction to firm risk-taking strategies because the basic goal of ERM is to avoid bankruptcy. Risk culture implies the attention to risk management which influences the judgment in risk-taking strategies. It is expected that a firm has more balanced risk-taking strategies if it pays more attentions to risk management.
This paper analyzes the effect of ERM policy, which integrates the board composition, risk appetite and risk culture, on firm risk-taking based on regression analyses. The empirical results find that there about 50% of public firms in Taiwan
have already paid attention to risk management. RM attention does not confine risk-taking strategies (e.g., capital and R&D expenditures) but encourage them. That is, RM attention does not restrict risky investment strategies, and at the same RM attention also helps to maintain liquidity and earnings to avoid financial distress and litigation risk. With the additional consideration of ERM perception, the results of this paper supplement the previous findings about the relationship between risk-taking and corporate governance.
The remainder of this paper is organized as follows. Section II reviews previous literature and develops the testing hypotheses. Section III presents sample data and research methodology. The empirical results are discussed in section IV, and then the conclusions are provided in the section V.
II. Literature Review and Hypotheses Development
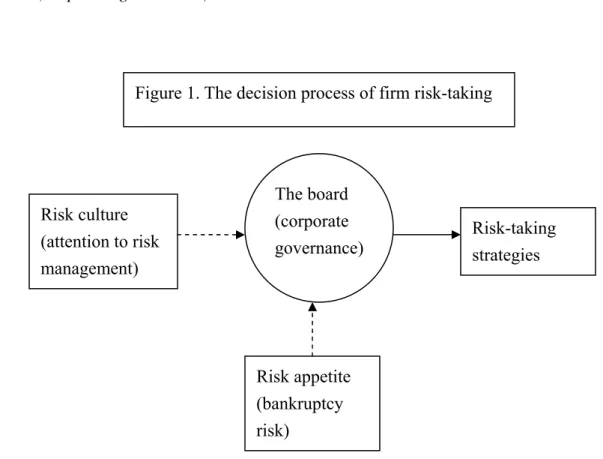
The stakeholders and investors express more concerns about the risks encountered by the firms and how the firms manage those risks. According to COSO (2004), the foundation of ERM process is the firm’s internal environment which includes the board, risk appetite, risk culture and risk management philosophy, etc. and has an impact on risk-taking strategies of the firm. It is a general concept with broad range of elements which cannot be all included within one paper. Thus this paper will only focus on three important elements: (1) the board (corporate governance), (2) risk appetite (bankruptcy risk), and (3) risk culture (attention of risk management). The board is the decision maker for firm risk-taking and the key of corporate governance. Risk appetite is the limit of risk which the firm can endure and relevant with bankruptcy risk. Since the basic purpose of ERM is to avoid bankruptcy, risk appetite will restrict a firm’s risk-taking. Risk culture is the implicit atmosphere of attention to risk management within a firm. Although culture cannot be measured
directly, it is the underlying factors for firm risk-taking strategies.
Previous studies have investigated the relationship between corporate governance and firm risk-taking. Pathan (2009) finds that strong board positively affects bank risk-taking but CEO power has a negative impact. Wang (2012) shows that small board can encourage more risky investment. Akhigbe and Martin (2008) find negative relation between board structure and bank risks. Cheng (2008) suggests that board size has an impact on the variability of corporate performance. Andres and Vallelado (2008) also indicate that board structure is relevant to bank performance.
Although many studies have investigated the effect of corporate governance on firm risk-taking, most of them focus on quantitative information such as board structure. The qualitative aspects of and board decision and risk management on firm risk-taking have not been analyzed. In reality, both conventional quantitative variables such as probabilities and outcomes, and behavioral variables such as “dread” and “unknown” would directly or indirectly influence risk perceptions and judgment, according to the conclusion of Koonce, McAnally and Mercer (2005) who studied how financial statements users perceive financial risks. It is reasonable to expect the board directors will consider the firm’s risk management policy which includes its risk appetite and risk culture when they decide the risk-taking strategies. This decision process is shown as figure 1.
A firm with better risk culture which pays more attention to risk management is expected to present better corporate governance. Just as Basel II (Basel Committee, 2005) identified, the board of directors is an integral part of risk management. Numerous studies suggest that the board structure and top management significantly influence the firm risk-taking. (Wright et al., 1996; Adams, Almeida, and Ferreira, 2005; Andres and Vallelado, 2008). Although aggressive risk-taking may create profits for shareholders, an impetuous risk-taking can destroy a firm. To keep prudent
in the risk-taking strategies (i.e., better risk management), a firm must have better board. Therefore the first testing hypothesis is as follows.
H1: Firms paying more attention to risk management will present better board (corporate governance).
.
On the other hand, a more responsible board (better board) is expected to pay more attention to risk management. Schrand and Elliott (1998) indicated that the US firms did not provide sufficient risk information in their annual reports. The survey of institutional investors taken by Solomon et al. (2000) suggests that the directors need to provide more information related to risk disclosure. Ge and McVay (2005) show that the regulations have increased disclosure requirements related to risk and effectiveness of internal control. In fact the newly updated corporate governance regulations such as SOX (US) or Turnbull Report (UK) all require more disclosures on risk information and risk management policies since these disclosures are relevant
Risk culture (attention to risk management) Risk appetite (bankruptcy risk) Risk-taking strategies The board (corporate governance)
for investors and other stakeholders. Therefore it is expected that a firm with better board will pay more attention to risk management and will disclose more information of risk management policy on their annual report. Thus the second testing hypothesis is
H2: Firms with better board (corporate governance) will pay more attention to risk management.
When the risk management is emphasized and risk culture is popular in a firm, the board probably will take more conservative risk-taking strategies. Although the direct studies on risk culture effect are not available, Bargeron, Lehn and Zutter (2010) show that the adoption of SOX is associated with a subsequent decline in corporate risk-taking. Because SOX legislation emphasizes risk management (section 404)1, it can create an adverse effect on firm risk-taking. SOX enhances the role of independent directors in corporate governance and expanding their liability for corporate misdeeds. Additionally, SOX requires companies to evaluate and disclose the adequacy of their internal control and enterprise risk management. The costs of disclosing will be higher for those high growth firms as indicated by Ashbaugh-Skaife et al. (2007) and Doyle et al. (2007).
All these regulations may discourage directors from approving risky investments that are costly to monitor. The expected costs of complying with section 404 of SOX are directly related to firm risk and consequently reducing the incentives of firms to invest in risky projects. Cohen et al. (2007) and Shadab (2008) show a negative relation between SOX and corporate risk-taking. Linck, Netter and Yang (2008) find
1 Section 404 of SOX requires public companies to evaluate and disclose the adequacy of their internal controls in annual reports. The companies are required to disclose the information about internal control and enterprise risk management in their annual reports, including (1) a statement of management's responsibility for establishing and maintaining adequate risk management, (2) identification of the framework to evaluate the adequacy of enterprise risk management, and (3) disclosure of any “material weaknesses" in the system of internal controls.
that boards of publicly traded US corporations are larger and consist of more outside directors after SOX. The increased role for independent directors is likely to adversely affect corporate risk-taking. Lehn, Patro and Zhao (2008) have found that firms with high risk and high growth opportunities have significantly fewer outside directors.
Previous research showed evidences that new regulations of corporate governance which emphasize on internal control and enterprise risk management discourage corporate risk-taking. For example, Graham, Harvey and Rajgopal (2003), Wintoki (2007) and Litvak (2007) find evidences consistent with the view that SOX has adversely affected corporate risk-taking. However, most of the studies are based on the comparison of data before and post SOX. It is unknown about the difference in firm risk-taking among firms after SOX. Do all the firms voluntarily take the same level of attention to risk management? Do the level of risk management attention influence firm risk-taking strategies?
Although it is difficult to disentangle the detailed effect of risk culture on firm risk-taking, this paper considers the attention to risk management will induce different risk-taking behavior. Since it is expected that a firm with more attention to risk management will have better board and corporate governance which in turn is expected to take less risky strategies, therefore it is expected that firm risk-taking strategies are negatively related to its risk management policy which is presented by its risk appetite and risk culture. Risk appetite is obviously a restriction to firm risk taking strategies because every rational firm will take into account the bankruptcy risk in its business decision. The third testing hypothesis of this paper is:
H3: The risk-taking strategies of a firm are negatively related to its risk management policy.
appetite.
H3b: The risk-taking strategies of a firm are negatively related to its risk culture.
In literature more risk-taking strategies usually imply more R&D expenditures, riskier investment, higher leverage, less liquidity, less diversification in products, etc. (Low, 2009; Coles, Daniel, and Naveen, 2006). Because the board plays the critical role in making these decisions, the corporate governance has been greatly emphasized in business practice and academic research since the passage of SOX. Bargeron, Lehn, and Zutter (2010) find that risk-taking in R&D and investment strategies is reduced for the US companies after SOX. Coles, Daniel, and Naveen (2008) find a positive relation between R&D expenditures and the proportion of inside directors on the board.
The arguments for the relationship between risk-taking and capital expenditure are not consistent. Some ( e. g. Bargeron, Lehn, and Zutter, 2010) expect that more risk-taking result in higher capital expenditure, but others ( e.g., Coles, Daniel, and Naveen, 2006) suggest that more risk-taking implies less capital expenditure. As risk management policies diverse in different firms and industries, this paper consider both situations are possible. Lower earnings and less liquidity usually imply higher financial risk and/or bankruptcy risk. Since SOX especially emphasizes on the concerns of firm failure, it is expected that firms with more risk management attention will present more earnings and higher liquidity. Product diversification in general also reduces risk according to portfolio theory. However, production strategies and technologies are quite different among industries. There is no conclusive empirical finding for the effect of diversification (Eisenmann, 2002), which may depend on the CEO’s decisions or industry characteristics. Therefore this paper will not include
diversification in the study of firm risk-taking strategies.
III. Sample and Research Methodology A. Sample and Data
A firm’s risk culture usually cannot be measured directly. We can only make indirect observation through its attention to risk management. Therefore this paper applies the methodology of content analysis as Linsley and Shrives (2006) to find the message of risk culture. The key word “risk management” is searched in the annual reports of firms. The rationale is that a firm will frequently use this term in describing its business policies and strategies if its risk culture regards risk management important.
This paper retrieved the annual reports of all the 1397 publicly listed and OTC firms in Taiwan from the public information data bases, including the Taiwan Economic Journal (TEJ), Taiwan Stock Exchange Corp. (TSEC), and Market Observation Post System (MOPS) for year 2010. By the computer’s searching techniques, the term “risk management” is searched on the annual reports. Because the formats of some annual reports are not fit for the search technique, there are 1288 firms available for this study. However, financial institutions are excluded because risk management is required by the regulations. They talk about risk management much more than other industries and thus are excluded in the sample. Finally the total number of firms included in the sample is 972.
The risk management attention is identified through the following procedures. (1) If a firm sets up “risk management” department or committee in its organization
structure, a dummy variable (RMD) equal to 1 is recorded, otherwise 0.
(2) According to the contents of each paragraph on the annual report, if the term “risk management” appears in a paragraph related to market competition or other
business strategies, it is identified as the firm’s attention to “strategic risk management” (SRM). A dummy variable equal to 1 is assigned if it appears at least once, otherwise 0. By the same approach, if the term “risk management” appears in a paragraph related to corporate finance, it is regarded as attention to “financial risk management” (FRM). If the term “risk management” appears in a paragraph about internal business operations, it is regarded as attention to “operational risk management” (ORM). If the term “risk management” appears in a paragraph related to unexpected natural or man-made disasters such as fire and earthquake, it is regarded as attention to “hazard risk management” (HRM). (3) The total number of appearance of the term “risk management” in an annual report
is counted for each firm (RMsum). And if the term “risk management” appears at least once, the dummy variable (RMyes) is equal to 1, otherwise RM=0.
In addition to the variables for RM attention, the variables for risk appetite, corporate governance, and firm characteristics are all retrieved from the public data bases including TEJ, TSEC, and MOPS as indicated in the above. Risk appetite is measured by the bankruptcy risk because a firm with higher bankruptcy risk usually cannot afford high risk-taking strategies. Bankruptcy risk is calculated based on Z-score as in Boyd, Graham and Hewitt (1993), which is Z = -{[average (daily stock returns) + average (equity/assets)]/standard deviations of daily stock returns}. Corporate governance of a firm is represented by its board composition because the board is the center for decision-making. According to Linck, Netter, and Yang (2008), the board composition primarily emphasizes on three elements: board independence, leadership duality, and board size. Board independence is defined as the proportion of the outside directors in the board. Leadership duality means the CEO also the chairman of the board (COB), which is a dummy variable equal to 1 if CEO=COB
and zero otherwise. Board size is the number of directors on the board.
Four variables are used to represent firm risk-taking strategies, including (1) capital expenditure (CAPEX), (2) research and development expenditure (R&D), both of them implies risky investment, (3) holding of cash and short term securities (Cash) to maintain liquidity, and (4) earning before income and tax (EBIT) which is the profitability and final outcome of business strategies.
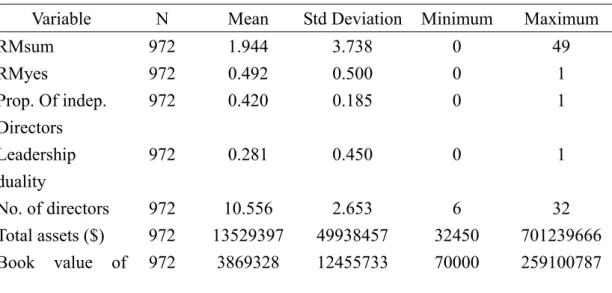
Additionally, several firm characteristics variables are included to control the individual differences in firms. Firm size is measured by the natural logarithm of book value of total assets. The debt ratio is equal to the book value of debt to book value of debt plus market value of equity. Stock volatility is measured through the standard deviation of daily stock returns over the year. High technology firms usually have more R&D and take more risky investments than other firms. Therefore, a dummy variable 1 is assigned for high-technology industry and zero for others. Adj-ROA is traditionally an accounting measurement for firm performance, Firms with potential growth opportunity usually take more risky strategies and thus market-to-book value of equity (MTB) is included as the proxy for growth opportunity (Gaver and Gaver, 1993). The descriptive statistics of the sample are summarized in table 1.
Table 1 Summary Statistics of the Sample
Variable N Mean Std Deviation Minimum Maximum
RMsum 972 1.944 3.738 0 49 RMyes 972 0.492 0.500 0 1 Prop. Of indep. Directors 972 0.420 0.185 0 1 Leadership duality 972 0.281 0.450 0 1 No. of directors 972 10.556 2.653 6 32 Total assets ($) 972 13529397 49938457 32450 701239666 Book value of 972 3869328 12455733 70000 259100787
equity ($) Market value of equity ($) 972 16542327 81491311 67000 1839615000 Debt ratio 972 35.135 16.909 2.260 123.630 Stock volatility 937 3.191 2.490 0.916 43.860 High tech. (yes/no) 972 0.709 0.455 0 1 Industry adjusted ROA 972 -2.447 9.770 -70.440 25.180 Market-to-book of equity 972 3.857 5.200 0.166 89.999 Z-score 972 -0.301 0.135 -1.097 0.132 Capital exp. ($) 971 1073758 14303234 -2064286 386631221 R&D exp. ($) 972 207328 1177116 0 27623299 Cash($) 972 1266698 5440126 812 109511130 Earning before interest & tax ($)
972 1129680 6857546 -14866475 169504845 All variables of dollar amount are in NT$1000.
B. Research Methodology
To test hypotheses, this paper searches the text of annual report and uses the dummy variables to count the risk management attention, together with the risk appetite represented by bankruptcy probability. Then firm risk-taking strategies are analyzed under these internal risk environments as described in COSO (2004). Firm risk-taking strategies include capital expenditure, R&D expenditure, liquidity (cash holding), and earnings before interest and taxes.
This paper first compares the board composition and firm characteristics and their risk-taking strategies between the firms with and without RM attention. A firm is regarded as paying attention to RM if the variable RMsum is greater than 0 (i.e., RMyes=1) otherwise is grouped as firms without attention on RM. This method is similar to the matched-sample method used by Chhaochharia and Grinstein (2007).
T-test and nonparametric Wilcoxon test are applied to compare the means and medians of board composition and risk-takings between these two groups of firms: with and without attention on RM. These analyses provide initial knowledge on the relationship between RM culture and business operations.
Next, regression analyses are applied to study firm risk-taking strategies with these risk management environment variables (ERM) and corporate governance (CG). The testing models include:
CGit =α + β1 ERMit + Σβj FirmCharacteristicsit +εit (1)
ERMit =α + β1 CGit + Σβj FirmCharacteristicsit +εit (2)
FirmRiskTakingit = α +φ1CGit + β1 ERMit + Σβj FirmCharacteristicsit +εit (3a)
FirmRiskTakingit = α+ φ1CGit + β1ERMit + φ2CGit*ERMit
+Σβj FirmCharacteristics it + εit (3b)
Each regression analysis is applied to two measurements of RM and corporate governance (CG). RM attention is measured either by RMyes or RMsum. CG is first using three elements of board composition directly, or second approach is using principle component analysis based on three elements to find a composite index for corporate governance. OLS regression is applied first for the relationship between corporate governance and RM and the relationship between firm risk taking strategies. To analyze the interaction effect of corporate governance and RM attention on the firm risk-taking strategies, this paper applies the interaction of RM and corporate governance to the regression model. The control variables for firm characteristics are also included because Bargeron, Lehn and Zutter (2010) indicate various factors likely to affect the corporate risk-taking.
IV. Results
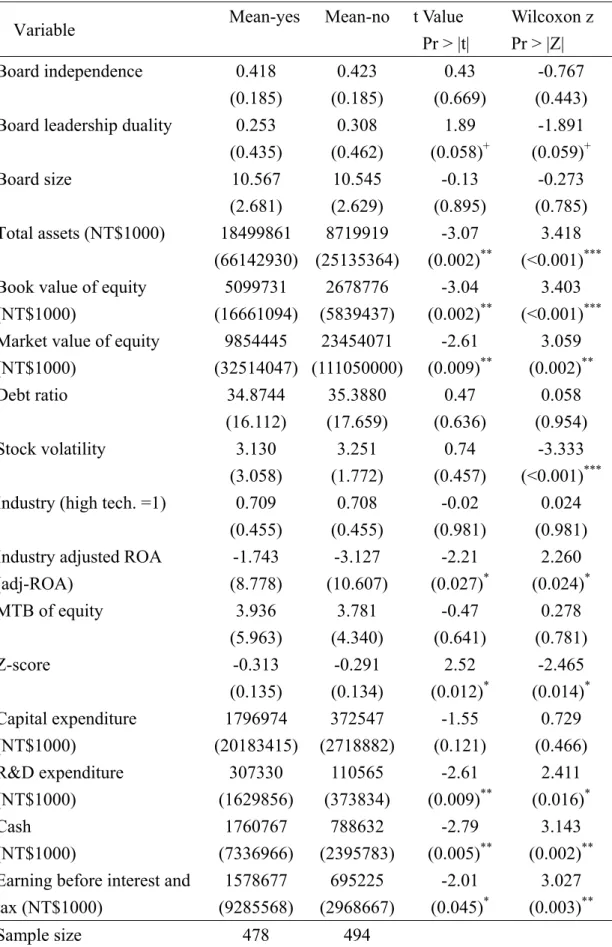
The comparisons in corporate governance and firm characteristics between the firms with and without risk management attention are shown in Table 2. The finding shows that about 50% of public firms have attention on ERM since they use the term “risk management” at least once in their annual reports. The t-tests indicate that board independence is almost the same among firms no matter with or without RM attention. The tests on leadership duality show significant difference and indicate firms with RM attention have less duality, according to t-test and the Wilcoxon test. The difference in board size is not significant according to both tests.
The firms with RM attention also present more total assets and equities, which implies large firms have more concerns on risk management. The difference in the means of debt ratio is not significant according to t-test. Additionally, the Wilcoxon test shows that firms without RM attention have significantly higher stock volatility. The proportion of high technology firms is quite similar in both groups of firms. The performance indicators adj-ROA shows that firms with RM attention present better ROA. Growth opportunity measurement MTB does not show significant difference between two groups of firms.
Bankruptcy probability measured by Z-score is significantly lower for firms with RM attention. The risk-taking strategies, including R&D expenditure, cash holding, and EBIT, are all in higher levels for firms with RM attention. The only exception is capital expenditure, which does not have significant difference between two group of firms.
The correlation matrix among variables are provided table 3. Most of the explanatory variables are not highly correlated and thus there is no multicollinearity problem in the regression analysis.
Table 2 Comparisons between the Firms with and without RM Strategies
Variable Mean-yes Mean-no t Value Pr > |t| Wilcoxon z Pr > |Z| Board independence 0.418 (0.185) 0.423 (0.185) 0.43 (0.669) -0.767 (0.443) Board leadership duality 0.253
(0.435) 0.308 (0.462) 1.89 (0.058)+ -1.891 (0.059)+ Board size 10.567 (2.681) 10.545 (2.629) -0.13 (0.895) -0.273 (0.785) Total assets (NT$1000) 18499861 (66142930) 8719919 (25135364) -3.07 (0.002)** 3.418 (<0.001)*** Book value of equity
(NT$1000) 5099731 (16661094) 2678776 (5839437) -3.04 (0.002)** 3.403 (<0.001)*** Market value of equity
(NT$1000) 9854445 (32514047) 23454071 (111050000) -2.61 (0.009)** 3.059 (0.002)** Debt ratio 34.8744 (16.112) 35.3880 (17.659) 0.47 (0.636) 0.058 (0.954) Stock volatility 3.130 (3.058) 3.251 (1.772) 0.74 (0.457) -3.333 (<0.001)*** Industry (high tech. =1) 0.709
(0.455) 0.708 (0.455) -0.02 (0.981) 0.024 (0.981) Industry adjusted ROA
(adj-ROA) -1.743 (8.778) -3.127 (10.607) -2.21 (0.027)* 2.260 (0.024)* MTB of equity 3.936 (5.963) 3.781 (4.340) -0.47 (0.641) 0.278 (0.781) Z-score -0.313 (0.135) -0.291 (0.134) 2.52 (0.012)* -2.465 (0.014)* Capital expenditure (NT$1000) 1796974 (20183415) 372547 (2718882) -1.55 (0.121) 0.729 (0.466) R&D expenditure (NT$1000) 307330 (1629856) 110565 (373834) -2.61 (0.009)** 2.411 (0.016)* Cash (NT$1000) 1760767 (7336966) 788632 (2395783) -2.79 (0.005)** 3.143 (0.002)** Earning before interest and
tax (NT$1000) 1578677 (9285568) 695225 (2968667) -2.01 (0.045)* 3.027 (0.003)** Sample size 478 494
Note: Mean-yes is the mean for the firms with RM attention (i.e., RMyes=1) and Mean-no is the mean for those without RM attention (i.e., RMyes=0). T-test and Wilcoxon test are for differences in
means and medians. Significance levels: + p<0.10; * p<0.05; ** p<0.01; *** p<0.001.
Table 3 Correlation Matrix of RM Strategy Variables N=972
rmsum rmyes outpro du sdc asset debtr vol tech adjroa mtb zscore capex rd cash ebit rmsum 1 rmyes 0.529 1 outpro -0.044 -0.014 1.000 du -0.037 -0.061 0.104 1 sdc -0.014 0.004 0.123 -0.118 1 asset 0.266 0.098 -0.171 -0.049 0.197 1 debtr 0.015 -0.015 -0.030 -0.058 -0.055 0.082 1 vol -0.053 -0.024 0.145 -0.015 0.064 -0.060 0.002 1 tech -0.018 0.001 0.348 0.128 0.142 -0.059 -0.130 0.133 1 adjroa 0.058 0.071 -0.023 -0.126 0.097 0.068 -0.176 -0.180 0.008 1 mtb 0.003 0.015 0.043 -0.079 0.123 0.128 -0.068 0.066 0.106 0.419 1 zscore -0.101 -0.081 0.137 0.053 -0.111 -0.104 0.544 0.220 0.226 -0.380 -0.150 1 capex 0.167 0.050 -0.045 0.051 0.024 0.658 0.040 -0.011 0.037 0.018 0.014 -0.007 1 rd 0.340 0.084 -0.059 -0.006 0.076 0.691 0.048 -0.024 0.093 0.066 0.228 -0.048 0.568 1 cash 0.335 0.089 -0.079 -0.014 0.099 0.803 0.051 -0.032 0.051 0.102 0.269 -0.078 0.582 0.895 1 ebit 0.333 0.064 -0.099 -0.015 0.128 0.716 -0.016 -0.054 -0.057 0.140 0.210 -0.221 0.320 0.734 0.752 1
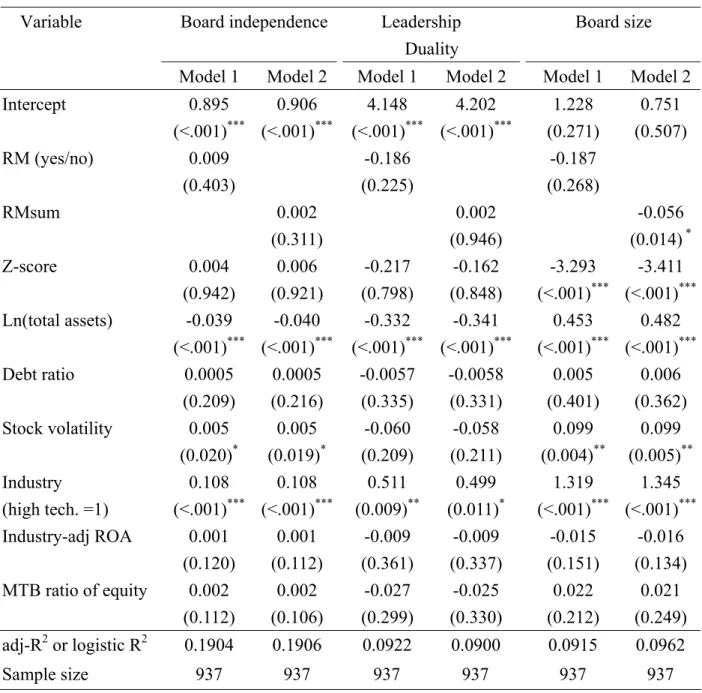
The regression analyses for corporate governance are presented in table 4. Each of the board composition elements is studied with two alternative measurements of RM attention, RMyes and RMsum. However, the model based on RMsum has higher explanation power (R2) and thus is reported here. According the results in table 4,
most of the board composition elements are not significantly related to RM attention. The only exception is that board size shows negative relation with RMsum. Firm characteristics are the primary determinants for board composition. Board independence are significantly and negatively related to asset size, but positively related to stock volatility and high-tech industry. Leadership duality also negatively related asset size but positively related to high-tech industry. Board size is significantly and negatively related to RMsum, which implies smaller board may pay
more attention to RM as predicted. Besides, board size is also negatively related to bankruptcy probability which implies the risk appetite may force a firm to form a more efficient board. Board size is positively related to asset size, stock volatility and high tech industry. To sum up, the empirical results do not fully support the hypothesis 1. Firms with more RM attention do not present better corporate governance except for the board size.
Table 4 OLS Regression for Board Structure
Board independence Leadership Duality
Board size Variable
Model 1 Model 2 Model 1 Model 2 Model 1 Model 2 Intercept 0.895 (<.001)*** 0.906 (<.001)*** 4.148 (<.001)*** 4.202 (<.001)*** 1.228 (0.271) 0.751 (0.507) RM (yes/no) 0.009 (0.403) -0.186 (0.225) -0.187 (0.268) RMsum 0.002 (0.311) 0.002 (0.946) -0.056 (0.014) * Z-score 0.004 (0.942) 0.006 (0.921) -0.217 (0.798) -0.162 (0.848) -3.293 (<.001)*** -3.411 (<.001)*** Ln(total assets) -0.039 (<.001)*** -0.040 (<.001)*** -0.332 (<.001)*** -0.341 (<.001)*** 0.453 (<.001)*** 0.482 (<.001)*** Debt ratio 0.0005 (0.209) 0.0005 (0.216) -0.0057 (0.335) -0.0058 (0.331) 0.005 (0.401) 0.006 (0.362) Stock volatility 0.005 (0.020)* 0.005 (0.019)* -0.060 (0.209) -0.058 (0.211) 0.099 (0.004)** 0.099 (0.005)** Industry (high tech. =1) 0.108 (<.001)*** 0.108 (<.001)*** 0.511 (0.009)** 0.499 (0.011)* 1.319 (<.001)*** 1.345 (<.001)*** Industry-adj ROA 0.001 (0.120) 0.001 (0.112) -0.009 (0.361) -0.009 (0.337) -0.015 (0.151) -0.016 (0.134) MTB ratio of equity 0.002 (0.112) 0.002 (0.106) -0.027 (0.299) -0.025 (0.330) 0.022 (0.212) 0.021 (0.249) adj-R2 or logistic R2 0.1904 0.1906 0.0922 0.0900 0.0915 0.0962 Sample size 937 937 937 937 937 937
Parameter estimates are listed with p-values in the parentheses. *** sig. at 0.1%; ** sig. at 1%; * sig. at 5%; + sig. at 10%.
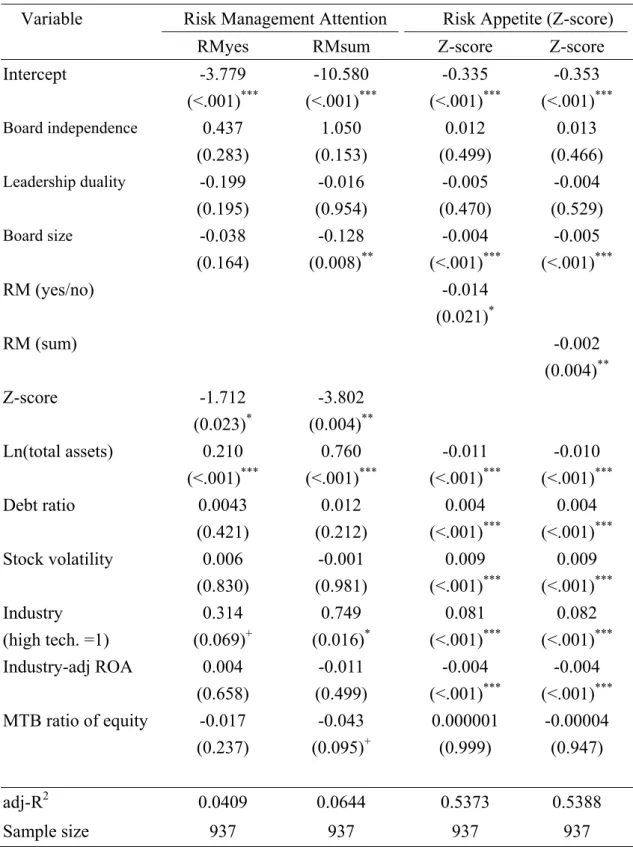
The analyses for the relationship between risk culture and corporate governance
are show in table 5. RM attention in general is not affected by the board composition except board size which has a negative relation with RM attention. This result implies an efficient board (smaller board) may pay more attention to RM. Besides, RM attention is negatively related to Z-score which indicates a firm with more RM attention usually has lower bankruptcy probability as predicted. Regarding firm characteristics, asset size has a positive relation with RM attention. That is, large firms usually are more advanced in management and thus pay more attention to RM. High technology firms are also pay more attention to RM.
The risk appetite represented by Z-score shows a negative relationship with board size and RM attention. These results implies that an efficient board and more RM attention and reduced bankruptcy probability. Larger asset size can reduce bankruptcy probability and thus has a negative relation with Z-score. Debt ratio and stock volatility both have a significant and positive relation with Z-score since more debts or higher volatility usually increases probability of bankruptcy. High technology firms also show a positive relation to Z-score because they present a higher probability of bankruptcy. The performance indicator ROA has a negative impact on bankruptcy probability because better performance usually reduces the chance of financial distress.
In summary, a firm with better corporate governance can generate some contributions to enterprise risk management which help to reduce the bankruptcy probability. Therefore, the hypothesis 2 is supported by the empirical evidence.
Table 5 OLS Regression for Risk Culture
Risk Management Attention Risk Appetite (Z-score) Variable
RMyes RMsum Z-score Z-score Intercept -3.779 (<.001)*** -10.580 (<.001)*** -0.335 (<.001)*** -0.353 (<.001)*** Board independence 0.437 (0.283) 1.050 (0.153) 0.012 (0.499) 0.013 (0.466) Leadership duality -0.199 (0.195) -0.016 (0.954) -0.005 (0.470) -0.004 (0.529) Board size -0.038 (0.164) -0.128 (0.008)** -0.004 (<.001)*** -0.005 (<.001)*** RM (yes/no) -0.014 (0.021)* RM (sum) -0.002 (0.004)** Z-score -1.712 (0.023)* -3.802 (0.004)** Ln(total assets) 0.210 (<.001)*** 0.760 (<.001)*** -0.011 (<.001)*** -0.010 (<.001)*** Debt ratio 0.0043 (0.421) 0.012 (0.212) 0.004 (<.001)*** 0.004 (<.001)*** Stock volatility 0.006 (0.830) -0.001 (0.981) 0.009 (<.001)*** 0.009 (<.001)*** Industry (high tech. =1) 0.314 (0.069)+ 0.749 (0.016)* 0.081 (<.001)*** 0.082 (<.001)*** Industry-adj ROA 0.004 (0.658) -0.011 (0.499) -0.004 (<.001)*** -0.004 (<.001)*** MTB ratio of equity -0.017 (0.237) -0.043 (0.095)+ 0.000001 (0.999) -0.00004 (0.947) adj-R2 0.0409 0.0644 0.5373 0.5388 Sample size 937 937 937 937
*** sig. at 0.1%; ** sig. at 1%; * sig. at 5%; + sig. at 10%.
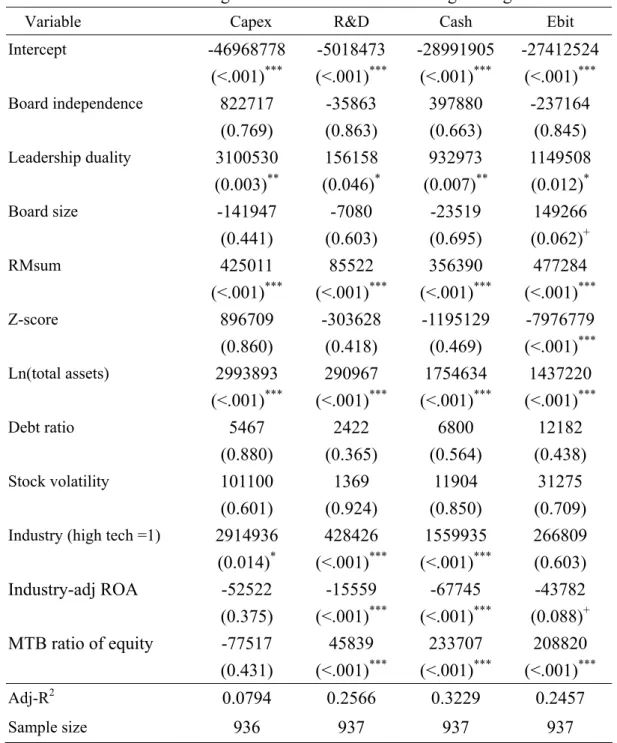
The relationship between firm risk-taking strategies, corporate governance and risk management culture are presented in table 6. The results show that risk-taking
strategies is significantly and positively related to RM attentions. The firms with higher RM attention have higher capital and R&D expenditure. That is, RM attention does not restrict firm risk-taking strategies, which contradicts to the prediction. The possible reason is that firms with RM attention usually are more advanced in their management and have long-term vision in business competition. Therefore they are more aggressive in risk-taking.
The cash-holding is higher for firms with more RM attention as predicted since the firms would like to maintain liquidity to avoid financial distress. The firms with more RM attention also have higher earnings (before interest and taxes) as predicted. Because higher earnings usually can please the shareholders and attract potential investors, the cost of capital may be lower and consequently reduce financial risk. Besides, a good performance of earnings which please shareholders can also reduce the chance of litigation risk.
The Z-score (risk appetite) does not have a significant impact on risk-taking strategies such as capital expenditure, R&D expenditure and liquidity. These results show that the risk appetite does not confined firm risk-taking strategies. The exception is that earnings (EBIT) are negatively related to Z-score, which implies a firm with higher probability of bankruptcy usually has difficulty in profitability.
Board composition also has some impact on firm risk-taking strategies. Leadership duality has a significant and positive impact on capital expenditure, R&D expenditure, cash-holding and EBIT. This result indicates that leadership duality may enhance aggressive risk-taking strategies. Board independence and board size are not significant factors for risk-taking strategies although board size has a little positive effect on EBIT.
Most of the characteristic variables are significantly related to firm risk-taking strategies. The effect of firm size and high technology industry is positive as predicted
because large firms and high tech firms usually have more aggressive risk-taking strategies. The firms with higher growth potential (MTB) also show a positive effect on their risk-taking strategies. However, the firms with better ROA present a negative relation on their risk-taking strategies probably because those strategies are long-term and money consuming and thus result in lower short-term performance ROA.
Table 6 OLS Regression Results for Risk-Taking Strategies
Variable Capex R&D Cash Ebit Intercept -46968778 (<.001)*** -5018473 (<.001)*** -28991905 (<.001)*** -27412524 (<.001)*** Board independence 822717 (0.769) -35863 (0.863) 397880 (0.663) -237164 (0.845) Leadership duality 3100530 (0.003)** 156158 (0.046)* 932973 (0.007)** 1149508 (0.012)* Board size -141947 (0.441) -7080 (0.603) -23519 (0.695) 149266 (0.062)+ RMsum 425011 (<.001)*** 85522 (<.001)*** 356390 (<.001)*** 477284 (<.001)*** Z-score 896709 (0.860) -303628 (0.418) -1195129 (0.469) -7976779 (<.001)*** Ln(total assets) 2993893 (<.001)*** 290967 (<.001)*** 1754634 (<.001)*** 1437220 (<.001)*** Debt ratio 5467 (0.880) 2422 (0.365) 6800 (0.564) 12182 (0.438) Stock volatility 101100 (0.601) 1369 (0.924) 11904 (0.850) 31275 (0.709)
Industry (high tech =1) 2914936 (0.014)* 428426 (<.001)*** 1559935 (<.001)*** 266809 (0.603) Industry-adj ROA -52522 (0.375) -15559 (<.001)*** -67745 (<.001)*** -43782 (0.088)+ MTB ratio of equity -77517 (0.431) 45839 (<.001)*** 233707 (<.001)*** 208820 (<.001)*** Adj-R2 0.0794 0.2566 0.3229 0.2457 Sample size 936 937 937 937 *** significance at 0.1%; ** significance at 1%; * significance at 5%; + significance at 10%.
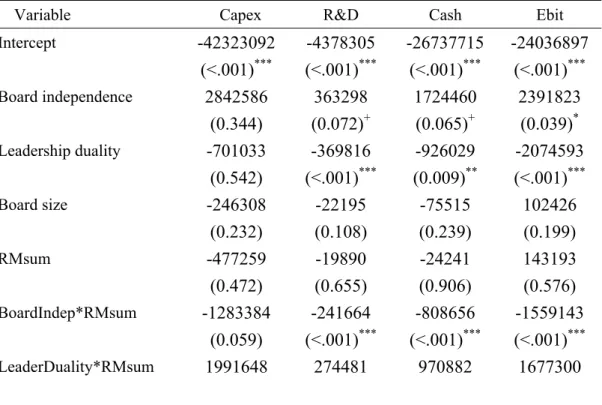
Because the risk management and corporate governance may be influenced with each other, this paper also extends the regression model to include the interaction terms. The explanation power (adj-R2) is much higher than the basic model, as shown in table 7. The interaction of corporate governance and risk management generates a negative effect on firm risk-taking strategies as predicted. According to Bergeron, lehn and Zutter (2010), better corporate governance (i.e, higher independence, less leadership duality, and smaller board) should have conservative risk-taking strategies. The results in table 7 show that board independence itself is positively related to risk-taking strategies, but it has a negative impact when interacted with RM attention. Leadership duality itself shows a negative effect on risk-taking strategies but a positive effect when interacted with RM attention. Board size itself does not significantly influence risk-taking strategies, but becomes positively related to risk-taking when interacted with RM attention.
The effects of Z-score and firm characteristics on risk-taking strategies are quite similar to those in the basic model. Thus the discussion is omitted.
Table 7 OLS Regression for Risk-Taking Strategies with Interaction Terms
Variable Capex R&D Cash Ebit Intercept -42323092 (<.001)*** -4378305 (<.001)*** -26737715 (<.001)*** -24036897 (<.001)*** Board independence 2842586 (0.344) 363298 (0.072)+ 1724460 (0.065)+ 2391823 (0.039)* Leadership duality -701033 (0.542) -369816 (<.001)*** -926029 (0.009)** -2074593 (<.001)*** Board size -246308 (0.232) -22195 (0.108) -75515 (0.239) 102426 (0.199) RMsum -477259 (0.472) -19890 (0.655) -24241 (0.906) 143193 (0.576) BoardIndep*RMsum -1283384 (0.059) -241664 (<.001)*** -808656 (<.001)*** -1559143 (<.001)*** LeaderDuality*RMsum 1991648 274481 970882 1677300
(<.001)*** (<.001)*** (<.001)*** (<.001)*** BoardSize*RMsum 87540 (0.147) 12841 (0.002)*** 44331 (0.018)* 52593 (0.024)* Z-score 2619431 (0.595) -75740 (0.819) -382110 (0.803) -6622654 (<.001)*** Ln(total assets) 2819528 (<.001)*** 263921 (<.001)*** 1661068 (<.001)*** 1267700 (<.001)*** Debt ratio 719.74317 (0.984) 1820.56134 (0.440) 4646.82065 (0.671) 9016.07827 (0.507) Stock volatility 82894 (0.658) -1339.20967 (0.915) 2508.65917 (0.965) 16467 (0.820)
Industry (high tech =1) 2939529 (0.011)*** 428519 (<.001)*** 1562330 (<.001)*** 259295 (0.559) Industry-adj ROA -71973 (0.211) -18277 (<.001)*** -77342 (<.001)*** -60952 (0.006) MTB ratio of equity -73608 (0.441) 46341 (<.001)*** 235525 (<.001)*** 212333 (<.001)*** Adj-R2 0.1324 0.4225 0.4179 0.4348 Sample size 936 937 937 937 *** significance at 0.1%; ** significance at 1%; * significance at 5%; + significance at 10%.
The p-values are reported in parentheses.
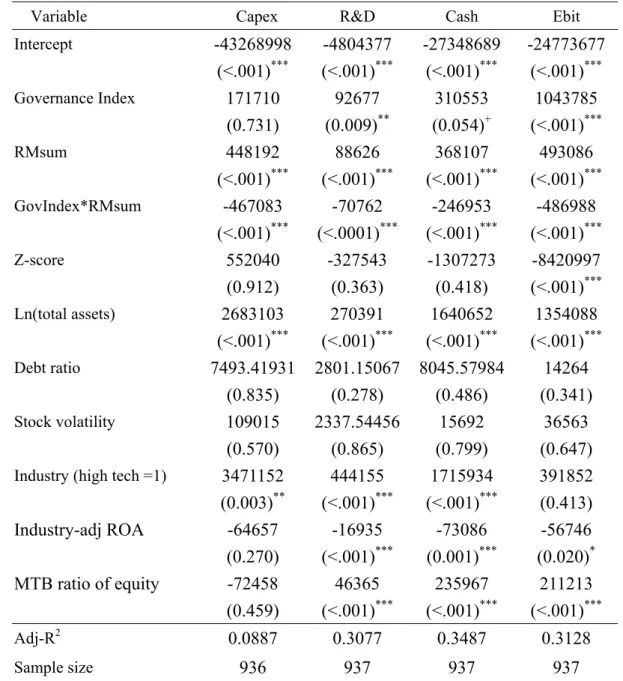
Because the three elements of corporate composition exhibit inconclusive results for the relationship between corporate governance and risk-taking strategies, this paper applied principal component analysis to obtain a governance index. Then the regression results based on the governance index are presented in tables 8 and 9. According to table 8, the corporate governance does not have a significant impact on risk-taking strategies, but RM attention is positively contributing to risk-taking strategies. When the interaction terms between corporate governance and RM attention is added, the explanation power of model is improved. The results in table 9 shows that corporate governance and RM attention may enhance risk-taking strategies respectively, but their interaction can reduce risk-taking strategies. That is, either a
better board or RM attention can encourage risk-taking. However, when a better board pays more RM attention, the firms may become careful and somewhat conservative in risk-taking.
The effect of risk appetite (Z-score) is not significant except for EBIT which has a negative relation. Other firm characteristics present similar outcome as previous analyses and thus the discussion is omitted.
Table 8 OLS Regression for Risk-Taking Strategies based on Governance Index
Variable Capex R&D Cash Ebit Intercept -44389546 (<.001)*** -4973750 (<.001)*** -27939786 (<.001)*** -25939313 (<.001)*** Governance Index -727081 (0.106) -43473 (0.190) -164600 (0.262) 106788 (0.584) RMsum 426966 (<.001)*** 85420 (<.001)*** 356917 (<.001)*** 471021 (<.001)*** Z-score 543797 (0.914) -328424 (0.379) -1310346 (0.427) -8427056 (<.001)*** Ln(total assets) 2768018 (<.001)*** 283232 (<.001)*** 1685466 (<.001)*** 1442460 (<.0001)*** Debt ratio 4630.19751 (0.898) 2369.51680 (0.376) 6539.21532 (0.580) 11294 (0.473) Stock volatility 102777 (0.595) 1393.33159 (0.922) 12397 (0.844) 30065 (0.721)
Industry (high tech =1) 3553810 (0.002)** 456572 (<.001)*** 1759267 (<.001)*** 477304 (0.343) Industry-adj ROA -57941 (0.327) -15919 (<.001)*** -69539 (<.001)*** -49752 (0.053) + MTB ratio of equity -75693 (0.443) 45878 (<.001)*** 234268 (<.001)*** 207863 (<.001)*** Adj-R2 0.0742 0.2559 0.3194 0.2403 Sample size 936 937 937 937 The eigenvector for the three elements of the board composition [independence, leadership, size] is
[0.504, -0.329, 0.798], and the cumulated probability is 0.3754.
*** significance at 0.1%; ** significance at 1%; * significance at 5%; + significance at 10%. The p-values are reported in parentheses.
Table 9 OLS Regression for Risk-Taking Strategies based on Governance Index and Interaction Terms
Variable Capex R&D Cash Ebit Intercept -43268998 (<.001)*** -4804377 (<.001)*** -27348689 (<.001)*** -24773677 (<.001)*** Governance Index 171710 (0.731) 92677 (0.009)** 310553 (0.054)+ 1043785 (<.001)*** RMsum 448192 (<.001)*** 88626 (<.001)*** 368107 (<.001)*** 493086 (<.001)*** GovIndex*RMsum -467083 (<.001)*** -70762 (<.0001)*** -246953 (<.001)*** -486988 (<.001)*** Z-score 552040 (0.912) -327543 (0.363) -1307273 (0.418) -8420997 (<.001)*** Ln(total assets) 2683103 (<.001)*** 270391 (<.001)*** 1640652 (<.001)*** 1354088 (<.001)*** Debt ratio 7493.41931 (0.835) 2801.15067 (0.278) 8045.57984 (0.486) 14264 (0.341) Stock volatility 109015 (0.570) 2337.54456 (0.865) 15692 (0.799) 36563 (0.647)
Industry (high tech =1) 3471152 (0.003)** 444155 (<.001)*** 1715934 (<.001)*** 391852 (0.413) Industry-adj ROA -64657 (0.270) -16935 (<.001)*** -73086 (0.001)*** -56746 (0.020)* MTB ratio of equity -72458 (0.459) 46365 (<.001)*** 235967 (<.001)*** 211213 (<.001)*** Adj-R2 0.0887 0.3077 0.3487 0.3128 Sample size 936 937 937 937 The eigenvector for the three elements of the board composition [independence, leadership, size] is
[0.504, -0.329, 0.798], and the cumulated probability is 0.3754.
*** significance at 0.1%; ** significance at 1%; * significance at 5%; + significance at 10%. The p-values are reported in parentheses.
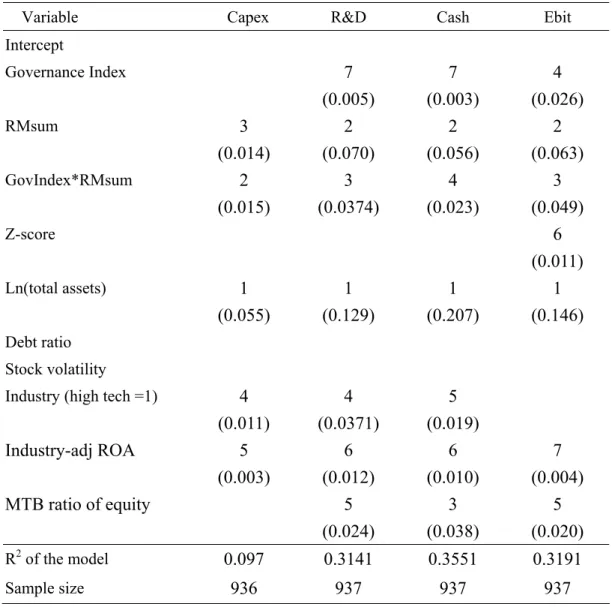
In order to understand the importance of each variable for firm risk-taking strategies, this paper further conducts stepwise regression analyses. The results in table 10 show that asset size is the most important factor for firm risk taking strategies. RM attention is ranked the second important factor, and its interaction with corporate
governance is about the third factor for risk-taking strategies. High technology industry is ranked about the forth. The growth opportunity (MTB) and performance indicator (ROA) are ranked around the fifth and the sixth. Corporate governance is about the 7th factor. Risk appetite (Z-score) is not a relevant factor for risk-taking strategies except for earnings. Debt ratio and stock volatility are not significant factors for all cases.
In summary, these results indicate that RM attention does have an important impact on firm risk-taking strategies.
Table 10 Stepwise Regression for Risk-Taking Strategies
Variable Capex R&D Cash Ebit Intercept Governance Index 7 (0.005) 7 (0.003) 4 (0.026) RMsum 3 (0.014) 2 (0.070) 2 (0.056) 2 (0.063) GovIndex*RMsum 2 (0.015) 3 (0.0374) 4 (0.023) 3 (0.049) Z-score 6 (0.011) Ln(total assets) 1 (0.055) 1 (0.129) 1 (0.207) 1 (0.146) Debt ratio Stock volatility
Industry (high tech =1) 4 (0.011) 4 (0.0371) 5 (0.019) Industry-adj ROA 5 (0.003) 6 (0.012) 6 (0.010) 7 (0.004) MTB ratio of equity 5 (0.024) 3 (0.038) 5 (0.020) R2 of the model 0.097 0.3141 0.3551 0.3191 Sample size 936 937 937 937 The ranks of independent variables for each risk-taking strategy are indicated by 1, 2…, 7, and the
Since firm size is an important determinant for its risk-taking strategies, this paper further categorizes the sample into two subgroups, large firms and small firms, according to the median of asset size. The regression results for large firms are similar to those in the whole sample, as shown in table 11. RM attention has a positive relation with firm risk-taking strategies, and its interaction with corporate governance shows a negative effect. The firm characteristics, including asset size, high technology industry and growth opportunity (MTB), have a positive impact on firm risk-taking. The performance indicator ROA is negatively related to R&D expenditures.
The results for small firms exhibit a very different picture from the whole sample and large firms. In the subsample of small firms, neither the RM attention nor its interaction with corporate governance has a significant impact on firm risk-taking strategies, as shown in table 12. On the other hand, the bankruptcy probability (Z-score) is positively related to R&D expenditure and negatively related to earnings. The debt ratio and stock volatility both have a negative relation on R&D expenditure and cash-holding, which implies financial stability is important consideration for small firms in risk-taking. This evidence is not found in the whole sample or the subsample of large firms
High technology has a positive effect for R&D and cash-holding, and growth opportunity (MTB) is positively related to R&D, cash-holding and earnings. Additionally, performance indicator ROA is negatively related to R&D and positively related to earnings. These results are similar to those for large firms.
Table 11 OLS Regression for Risk-Taking Strategies based on Governance Index and Interaction Terms for Large Firms
Variable Capex R&D Cash Ebit Intercept -100786369 (<.001)*** -10106039 (<.001)*** -58266919 (<.001)*** -57967424 (<.001)*** Governance Index -196870 (0.833) 119072 (0.062)+ 382515 (0.169) 1737162 (<.001)*** RMsum 435437 (0.028)* 101245 (<.001)*** 398420 (<.001)*** 558899 (<.001)*** GovIndex*RMsum -536297 (0.004)** -86821 (<.001)*** -294536 (<.001)*** -610052 (<.001)*** Z-score -2776066 (0.767) -931727 (0.145) -3584849 (0.197) -12934568 (<.001)*** Ln(total assets) 5962494 (<.001)*** 556088 (<.001)*** 3390505 (<.001)*** 3259861 (<.001)*** Debt ratio 44817 (0.541) 7753.88227 (0.121) 26579 (0.222) 27942 (0.320) Stock volatility 42114 (0.912) -5244.68124 (0.841) -26630 (0.815) -2999.71177 (0.984)
Industry (high tech =1) 5200631 (0.016)* 649104 (<.001)*** 2436811 (<.001)*** -233673 (0.776) Industry-adj ROA -39535 (0.785) -24489 (0.013)* -57874 (0.179) 49747 (0.371) MTB ratio of equity -131287 (0.385) 50467 (<.001)*** 237721 (<.001)*** 177434 (0.002)** Adj-R2 0.1298 0.3922 0.4515 0.4321 Sample size 478 479 479 479 The eigenvector for the three elements of the board composition [independence, leadership, size] is
[0.504, -0.329, 0.798], and the cumulated probability is 0.3754.
*** significance at 0.1%; ** significance at 1%; * significance at 5%; + significance at 10%. The p-values are reported in parentheses.
Table 12 OLS Regression for Risk-Taking Strategies based on Governance Index and Interaction Terms for Small Firms
Variable Capex R&D Cash Ebit Intercept -220228 (0.050)* -181798 (0.004)** -1269722 (<.001)*** 63096 (0.604) Governance Index 528.42944 (0.914) 2609.25929 (0.343) -4730.00334 (0.655) -1603.18867 (0.762) RMsum -812.34851 (0.630) 1009.82697 (0.288) -860.08474 (0.814) 2264.99939 (0.215) GovIndex*RMsum 3384.44954 (0.047)* -869.21986 (0.365) 2878.30092 (0.436) 831.05610 (0.652) Z-score -15728 (0.751) 125646 (<.001)*** -83561 (0.437) -189758 (<.001)*** Ln(total assets) 17578 (0.021)* 17255 (<.001)*** 99848 (<.001)*** -1913.41505 (0.816) Debt ratio 431.79783 (0.171) -951.31502 (<.001)*** -2533.23753 (<.001)*** 414.48816 (0.225) Stock volatility 1050.90301 (0.542) -1870.94577 (0.055)+ -1919.18021 (0.608) -4727.34146 (0.012)*
Industry (high tech =1) -16456 (0.148) 22711 (0.004) ** 65473 (0.008) ** 713.21077 (0.954) Industry-adj ROA 910.07537 (0.077)+ -670.53106 (0.021)* -1189.90510 (0.287) 10268 (<.001)*** MTB ratio of equity 1091.83344 (0.515) 9567.40097 (<.001)*** 34851 (<.001)*** 13632 (<.001)*** Adj-R2 0.0482 0.3131 0.3554 0.7016 Sample size 458 458 458 458 The eigenvector for the three elements of the board composition [independence, leadership, size] is
[0.504, -0.329, 0.798], and the cumulated probability is 0.3754.
*** significance at 0.1%; ** significance at 1%; * significance at 5%; + significance at 10%. The p-values are reported in parentheses.
V. Conclusion
This paper is to study the relationship between firm’s ERM policy and its risk-taking behavior, which has important implications for the stability of business operations and profitability. This paper focuses on the following three items: (1) the board, (2) risk appetite, and (3) risk culture because they are the primary elements of internal environment according to COSO-ERM process.
According to the empirical results of this paper, most of the board composition elements are not significantly related to RM attention, except for board size showing a negative relation which implies an efficient board (i.e., smaller board size) may have more attention to RM. Firm characteristics are the primary determinants for board composition. Besides, board size is also negatively related to bankruptcy probability which implies the risk appetite may force a firm to form a more efficient board. However, in general the empirical results do not strongly support the hypothesis that firms with more RM attention will present better corporate governance since board independence and leadership duality are not significantly related to risk management policy.
On the other hand, RM attention in general is not affected by the board composition except board size. However, the risk appetite represented by Z-score shows a negative relationship with board size and RM attention. Larger asset size can reduce bankruptcy probability. Debt ratio and stock volatility both have a significant and positive impact since more debts or higher volatility usually increases probability of bankruptcy. High technology firms also present a higher probability of bankruptcy. The empirical results show that firms with higher RM attention have higher capital and R&D expenditures, cash-holding, and earnings. That is, RM attention does not restrict risky investment strategies, and at the same moment RM attention also helps to maintain liquidity and earnings to avoid financial distress and litigation risk.
The risk appetite does not have a significant impact on risk-taking strategies which implies risk-taking strategies not confined by risk appetite. Board composition also has an impact on firm risk-taking strategies, especially leadership duality which has a significant and positive impact on capital expenditure, R&D expenditure, cash-holding and EBIT.
According to the empirical evidence, firm size is an important determinant for risk-taking strategies. In large firms, RM attention has a positive relation with firm risk-taking strategies, and its interaction with corporate governance shows a negative effect. The results for small firms exhibit a very different picture. Neither the RM attention nor its interaction with corporate governance has a significant impact on firm risk-taking strategies. On the other hand, the bankruptcy probability, debt ratio and stock volatility have a significant relation with R&D expenditure and cash-holding, which implies financial stability is important consideration for small firms in risk-taking.
In summary, this paper finds that there about 50% of public firms in Taiwan have already paid attention to risk management. Such RM attention does have a significant impact on firm risk taking strategies. However, RM attention does not confine risk-taking strategies (e.g., capital and R&D expenditures) but encourage them, which contradicts to the theoretical prediction. The possible reason is that firms which can pay attention to RM usually are more advanced in management or have more high-education managers. Therefore they are more aggressive in risky investment but at the same time they keep more liquidity and earnings to reduce the financial distress and shareholder litigations. This is in fact the purpose of COSO-ERM --- an integrated RM policy which makes a firm not to miss its business opportunity but at the same time to avoid financial distress.
References
Adams, R.B., Almeida, H ., and Ferreira, D ., 2005. Powerful CEOs and their impact on corporate performance. Review of Financial Studies 18, 1403-1432.
Akhigbe, A . and Martin, A.D ., 2008. Influence of disclosure and governance on risk of US financial services firms following Sarbanes-Oxley. Journal of Banking and Finance 32, 2124-2135.
Andres, P . and Vallelado, E ., 2008. Corporate governance m banking: The role of board of directors. Journal of Banking and Finance 32, 2570-2580.
Ashbaugh-Skaife, H., Collin, D., and Kinney, W., 2007. The discovery and reporting of internal control deficiencies prior to SOX-mandated audits. Journal of Accounting and Economics 44, 166-192.
Bargeron, L., Lehn, K., and Zutter, C. 2010. Sarbanes-Oxley and corporate risk-taking. Journal of Accounting and Economics 49, 34-52.
BIS, 2005. International convergence of capital measurement and capital standards: A revised framework. Discussion Paper. Basel Committee on Banking Supervision, Basel, November 2005.
Boyd. J.H ., Graham. S.L., and Hewitt. R.S., 1993. Bank holding company mergers with nonbank financial firms: Effects on the risk-failure. Journal of Banking and Finance 17, 43-63.
Cendrowski, H. and Mair, W., 2009, Enterprise Risk Management and COSO, John Wiley & Sons, Inc., Hohoken, NJ.
Chapman R., 2006, Simple Tools and Techniques for Enterprise Risk Management, John Wiley & Sons Ltd., Sussex, England.
Cheng, S., 2008. Board size and the variability of corporate performance. Journal of Fianclal Economics 87, 157-176.
The Impact of the 2002 Governance Rules. Journal of Finance 62, 1789-1825. Cohen, D., Dey, A., and Lys, T., 2007. The Sarbanes-Oxley Act of 2002: implications
for compensation contracts and managerial risk-taking. Northwestern University working paper.
Coles, J. Daniel, N., and Naveen, L., 2006. Managerial incentives and risk-taking. Journal of Financial Economics 79, 431-468.
Coles, J. Daniel, N., and Naveen, L., 2008. Boards: does one size fit all? Journal of Financial Economics 87, 329-356.
COSO (Committee of Sponsoring Organizations of the Treadway Commission). 2004. Enterprise Risk Management - Integrated Framework: Application Techniques. COSO, NJ.
Doyle, J. , Ge., W., and McVay, S., 2007. Determinants of weaknesses in internal control over financial reporting. Journal of Accounting and Economics 44, 193-223.
Eisenmann, T., 2002. The Effect of CEO equity ownership and firm diversification on risk-taking. Strategic Management Journal 23, 513:534.
Fatemi and Luft, 2002. Corporate risk management cost and benefit,” Global Finance Journal, 2002, 29-38.
Froot, K. A. and Stein, J., 1998, Risk management, capital budgeting, and capital structure policy for financial institutions: An integrated approach, Journal of Financial Economics 47, 55-82.
Frigo, M. and Anderson, R.,2011. Strategic risk management: A foundation for improving enterprise risk management and governance. Journal of Corporate Accounting & Finance 22(3), 81-.88.
Gaver, J. and Gaver, K., 1993. Additional evidence on the association between the investment opportunity set and corporate financing, dividend, and compensation
policies. Journal of Financial Economics 16 (1), 125-160.
Ge, W. and McVay, S., 2005. The disclosure of material weaknesses in internal control after the Sarbanes-Oxley Act. Accounting Horizons, 19, 137-158.
Godfrey, P., Merrill, C., and Hansen, J., 2009, The relationship between corporate social responsibility and shareholder value: An empirical test of the risk management hypothesis, Strategic Management Journal 30, 425-445
Graham, J., Harvey, J., and Rajgopal, S., 2003. The economic value versus reported earnings trade-off and voluntary disclosure. Duke University working paper. Hampton, J., 2009, Fundamentals of Enterprise Risk management, American
Management Association, New York, NY.
Koonce, L., McAnally, M., and Mercer, M., 2005. How do investors judge the risk of financial items? The Accounting Review 18, 221-241.
Lehn. K., Patro, S., and Zhao, M., 2008. Determinants of the size and structure of corporate boards: 1935-2000. University of Pittsburgh working paper.
Linck, J., Netter, J., Yang, T., 2008. The determinants of board structure. Journal of Financial Economics 87, 308-328
Linsley, P. and Shrives, P., 2006, “Risk reporting: A study of risk disclosures in the annual reports of UK companies, The British Accounting Review 38, 387-404. Litvak, K., 2007.Did the Sarbanes-Oxley Act affect risk-taking by cross-listed
companies? University of Texas working paper.
Low, A., 2009, Managerial risk-taking behavior and equity-based compensation,” Journal of Financial Economics 92, 470-490.
Moller, R., 2007, COSO Enterprise Risk Management, John Wiley & Sons, New York, NY.
Nocco, B., and R. Stulz, 2006, Enterprise risk management: Theory and practice,” Journal of Applied Corporate Finance 18, 8-20. _
enterprise risk management. Journal of Corporate Accounting & Finance 20(3), 43-51.
Pathan, S., 2009. Strong boards, CEO power and bank risk-taking. Journal of Banking and Finance 33, 1340-1350.
Schrand, C. M. and I.A. Elliott, 1998. Risk and financial reporting: a summary of the discussion at the 1997 AAA/FASB conference. Accounting Horizons 12 (3), 271-282.
Shadab, H., 2008. Innovation and corporate governance: the impact of Sarbanes- Oxley. University of Pennsylvania Journal of Business and Employment Law 10, 955-1008.
Slywotzky, A. and Drzik. J., 2005. Countering the biggest risk of all. Harvard Business Review (April), 78-88.
Solomon, I.F., Solomon, N A., Norton, S.D., Joseph, N.L., 2000. A conceptual framework for corporate risk disclosure emerging from the agenda for corporate governance reform. British Accounting Review 32 (4), 447-478.
Wang, C., 2012. Board size and firm risk-taking. Review of Quantitative Finance and Accounting 38, 519-542.
Wintoki, M., 2007, Corporate boards and regulation: the effect of the Sarbanes-Oxley Act and the exchange listing requirements on firm value. Journal of Corporate Finance 13, 229-250.
Wright, P., Ferris, S., Sarin, A., and Awasthi, V., 1996. The impact of corporate insider, blockholder, and institutional equity ownership on firm risk-taking. Academy of Management Journal 39, 441-463.