國立交通大學
生物資訊所
碩
士
論
文
在人類基因體中辨識微小核甘酸轉譯啟始位置
Identification of MicroRNA Transcriptional Start Sites in Human
Genome
研 究 生 :王定遠
指導教授 :黃憲達 博士
中 華 民 國 九 十 七 年 七 月
在人類基因體中辨識微小核甘酸轉譯啟始位置
Identification of MicroRNA Transcriptional Start Sites in Human
Genome
研 究 生:王定遠 Student:Ting‐Yung Wang
指導教授:黃憲達 博士 Advisor:Dr. Hsian‐Da Huang
國 立 交 通 大 學
生 物 資 訊 所
碩 士 論 文
A Thesis Submitted to Institute of Bioinformatics College of Biological Science and Technology National Chiao Tung University in partial Fulfillment of the Requirements for the Degree of Master in Bioinformatics July 2008 Hsinchu, Taiwan, Republic of China
中華民國九十七年七月
在人類基因體中辨識微小核甘酸轉譯啟始位置
學生:王定遠
指導教授:黃憲達
國立交通大學生物資訊所碩士班
摘 要
微小核甘酸非常小,大約由 21 個核甘酸構成,在核甘酸干擾機制中微小核甘酸藉由完 全互補或是部分互補來抑制目標基因的表現。絕大多數的微小核甘酸是由核甘酸聚合酶 II 來進行轉譯。經由核甘酸聚合酶 II 所轉譯出來的原始微小核甘酸具有 5'端帽以及 3'端腺嘌呤尾。在這些微小核甘酸中,有一部分的微小核甘酸基因沒有覆蓋到其他已 知的基因序列上,這些微小核甘酸稱之為基因間微小核甘酸,基因間微小核甘酸具有獨 立的啟動子。在研究基因間微小核甘酸的調控時,首先要知道這些基因間微小核甘酸啟 動子的位置。由於傳統聚合酶連鎖反應中所使用的去氧核醣核甘酸聚合酶的酵素特性, 該酵素很難完全地合成出完整的 5'端片段序列。在本研究之中,我們使用了 5'端迅 速放大互補去氧核甘酸終端的技術來確保可以得到原始微小核甘酸的 5'端序列,並藉 由整合微小核甘酸的表現資料來過濾掉那些低表現量的微小核甘酸。經由一系列的電腦 輔助啟動子的預測,我們可以選出那些含有各種證據所支持的可能轉錄起始位置。為了 要辨認出這些可能的轉錄起始位置,我們針對這些位置設計了專一性的引子。最後再藉 由反轉錄聚合酶連鎖反應來證明我們找到的可能轉錄起是位置的真偽。Identification of miRNA promoters by computational studies and
miRNA expression profiles
Student:Ting-Yung Wang
Advisors:Dr. Hsian-Da Huang
Institute of Bioinformatics
National Chiao Tung University
ABSTRACT
The miRNAs are ~21nt single-strand short nucleotide that can induce RNAi mechanism through complete or partial complementarities. Most of the miRNAs are transcribed by RNA polymerase II [1]. The pri-miRNA transcribed by RNA polymerase II contained 5’cap and 3’poly-A tail [2]. For those intergenic miRNA, non-gene-overlap miRNA, they have their own promoter. It is important to understand those promoters of intergenic miRNA gene to facilitated understanding the regulation of intergenic miRNA. Because of the nature of the enzymatic reaction the probability of retrieving the sequence of extreme 5’ end region was very low with traditional PCR technology. Here, we use 5’RACE [3, 4] to ensure that the 5’end region of pri-miRNAs was obtained. In addition, we incorporate miRNA expression profile [5] to filter out those lower-expressed miRNA. With a series of computational promoter prediction, we could choose the putative TSS that has many support evidences. In order to identify whether putative TSS is true or false, the putative TSS specific primer was designed. Finally, the RT-PCT results were used to confirm the putative promoter regions.
誌謝
研究所這兩年,雖然只是短短的兩年,但卻是截然不同的學生生活,身為一 個研究生,漸漸體會到研究這條路的無窮無盡。其中路途上的波折,非常感謝路 上許多學長與老師們的指引才不會讓我失去方向、喪失力量,是我克服障礙的推 手。 這兩年之中我首先要感謝我的指導教授,黃憲達教授在我研究上的題點,在 作研究路上的孜孜教誨,老師在學術研究上的淵博學問讓我體悟到做研究的精 隨。也感謝老師在日常生活上的照顧,從老師身上學習到了許多處事的哲學,說 話的學問,以及團隊合作的溝通協調,再次感謝我指導教授在這兩年中的幫忙, 讓學生能夠順利完成生平第一篇學術研究。 另外,我要感謝我的學長宗夷,他總是在我遇到困難時指出我的問題重點, 讓我快速地通過障礙,我還要感謝我的學長威霽,他總是細心地指出我做研究上 的缺失與不足,還有實驗室中的其他學長與學姐,熙淵、博凱、唯哲、勝達、豐 茂、雯玲、文琦,有你們在研究路上的共同奮鬥,讓我覺得研究的路上不孤單, 最後還要感謝幫助我過的學弟,昭昉、煒志、恆毅、致宏,有你們的幫忙,我才 能有現在的研究成果。 最後我要感謝我的父母親,感謝父親辛苦地工作支付我的生活開銷,沒有怨 言,讓我日常生活不虞匱乏,感謝母親辛苦地維持家計,讓我每次回到台北都有 溫暖的感覺,還要感謝我的弟弟政遠,他健康的笑容就是我前進的力量。Table of Contents
摘 要 ... i ABSTRACT ... ii 誌謝 ... iii Table of Contents ... iv List of Tables ... viList of Figures ... vii
Chapter1. Introduction ... 1
1.1 Overview of scheme ... 1
1.2 Biogenesis of miRNAs ... 1
1.1 Transcriptional regulation of miRNAs ... 3
1.4 Motivation ... 6
1.5 Goal ... 7
Chapter2. Related Works ... 8
2.1 Putative promoter prediction programs ... 8
2.2 Intergenic miRNA literature reviews ... 9
Chapter3. Materials and Methods ... 11
3.1 Materials ... 11
3.1.1 miRBase ... 11
3.1.2 DBTSS ... 12
3.1.3 FANTOM3 CAGE tag database ... 14
3.1.4 UCSC Genome browser ... 16
3.1.5 miRNAMap ... 17
3.2 Method overview ... 18
3.3 Data preprocessing ... 19
3.4 Computational TSS prediction ... 20
3.4.1 Promoter prediction tools ... 20
3.4.2 CAGE tags ... 20
3.4.3 Solexa tag ... 22
3.4.4 Evolutionary conservation... 23
3.4.5 Putative TSS clustering ... 24
3.4.6 Putative TSS ranking ... 25
3.5 Experimental condition selection ... 27
3.5.1 Human normal tissue Q-PCR profile ... 27
3.6 Experimental verification ... 28
3.6.1 RACE ... 30
3.6.2 Reverser transcription ... 31
3.6.3 Nested PCR ... 32
3.6.5 Sequence alignment ... 33
Chapter4. Results ... 36
4.1 Predicted TSS of human intergenic miRNA ... 36
4.1.1 The putative TSS cluster ... 39
4.1.2 The prediction performance ... 39
4.2 Experimental evidence of human intergenic miRNA TSS ... 40
4.2.1 CAGE Tag Evidence ... 40
4.3 Verified TSS of human intergenic miRNA ... 42
4.3.1 Selected human intergenic miRNAs and tissues ... 42
4.3.2 Designed putative TSS cluster specific primer by Primer3 ... 44
4.3.3 Identification of TSS by nested PCR ... 45
4.3.4 Sequencing PCR product ... 57
4.3.5 Blast sequenced result to genome to check the TSS position ... 57
4.4 Web server ... 58
4.4.1 MIRPM overview ... 58
4.4.2 Web interface ... 59
Chapter5. Discussion ... 62
5.1 The limitation of promoter prediction programs ... 62
5.2 The limitation of TSS evidence tags ... 63
5.3 The limitation of verified TSS ... 64
5.4 Future works ... 65
5.4.1 Transcription Factor binding site analysis ... 65
5.4.2 Double check by Open reading frame ... 65
Chapter6. Conclusion ... 66
Chapter7. Reference ... 67
List of Tables
Table 2.1 TSS prediction tools ... 8
Table 3.1 The scoring method in our putative TSS cluster ... 26
Table 4.1 Experimental condition selection of human intergenic miRNA ... 42
Table 4.2 The PCR condition use of hsa-mir-122a ... 46
Table 4.3 The PCR condition use of hsa-mir-130a and hsa-mir-143 ... 47
Table 4.4 The PCR condition use of hsa-mir-10b, hsa-mir-30b, hsa-mir-146a and hsa-mir-146b ... 49
Table 4.5 The PCR condition use of hsa-mir-7a-1, hsa-mir-7e, hsa-mir-100, hsa-mir-124a-2, hsa-mir-92b and hsa-mir-132 ... 50
Table 4.6 The PCR condition use of hsa-mir-124a, hsa-mir-125b-1, hsa-mir-7f-1, hsa-mir-517b, hsa-mir-517c and hsa-mir-30d ... 52
Table 4.7 The PCR condition use of hsa-mir-9-2, hsa-mir-7a-2, hsa-mir-517a and hsa-mir-519e ... 53
Table 4.8 The PCR condition use of hsa-mir-145, hsa-mir-222, hsa-mir-192, hsa-mir-223, hsa-mir-506, hsa-mir-141-1 and hsa-mir-141-2 ... 55
Table 4.9 The PCR condition use of hsa-mir-514-1, hsa-mir-514-2, hsa-mir-514-3, hsa-mir-92-2 and hsa-mir-106a ... 56
Table 5.1 Compare tissue used in CAGE database and Ambion ... 63
List of Figures
Figure 1.1 The miRNA endogenesis process ... 2
Figure 1.2 The illustration of intergenic miRNA ... 3
Figure 1.3 The transcriptional regulation of RNA pol II transcribe[7] ... 5
Figure 1.4 The illustration of promoter ... 6
Figure 3.1 miRBase ... 12
Figure 3.2 DBTSS ... 14
Figure 3.3 The CAGE database ... 15
Figure 3.4 UCSC Genome browser web interface ... 17
Figure 3.5 miRNAMap web interfaces... 18
Figure 3.6 System flowchart ... 19
Figure 3.7 CAGE tags and CTSS ... 21
Figure 3.8 position distribution of human intergenic miRNA CAGE tags ... 22
Figure 3.9 Comparison of Phastcons17way with Phastcons28way ... 23
Figure 3.10 The conservation of Human chromosome ... 24
Figure 3.11 The rule of putative TSS cluster... 25
Figure 3.12 Choose the 5’ terminal site of putative TSS cluster as TSS ... 25
Figure 3.13 An example of primer dimmer ... 25
Figure 3.14 The expression profile of Q-PCR ... 28
Figure 3.15 The experiment flow of verify the putative TSS ... 29
Figure 3.16 Ambion 5’ RLM-RACE (From Ambion protocol: AM1700) ... 31
Figure 4.1 All kinds of miRNA in human genomes ... 36
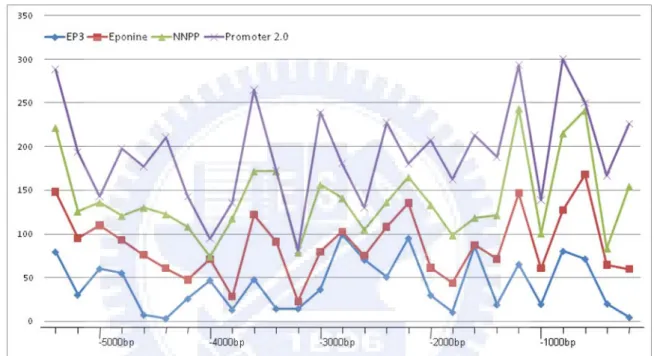
Figure 4.2 The predicted result distribution between upstream -5400bp to -1bp of five promoter prediction programs ... 37
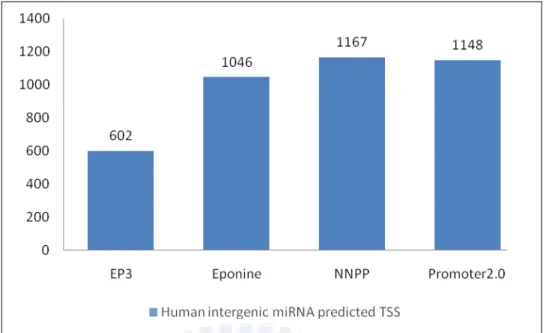
Figure 4.3 The predicted result of five promoter prediction programs ... 38
Figure 4.4 Coverage of five promoter prediction programs ... 38
Figure 4.5 The putative TSS distribute between from upstream -5400bp to -1bp after clustering ... 39
Figure 4.6 Performance of our integrated system... 40
Figure 4.7 CTSS distribution between upstream -5200bp to upstream -1bp ... 41
Figure 4.8 Representative CTSS distribution between upstream -5200bp to upstream -1bp... 41
Figure 4.9 The illustration of primer design ... 44
Figure 4.10 The electrophoresis result of hsa-mir-122a ... 45
Figure 4.11 The electrophoresis result of hsa-mir-130a and hsa-mir-143 ... 47
Figure 4.12 The electrophoresis result of hsa-mir-10b, hsa-mir-30b, hsa-mir-146a and hsa-mir-146b ... 48
Figure 4.13 The electrophoresis result of hsa-mir-7a-1, hsa-mir-7e, hsa-mir-100,
hsa-mir-124a-2, hsa-mir-92b and hsa-mir-132 ... 50
Figure 4.14 The electrophoresis result of hsa-mir-124a, hsa-mir-125b-1, hsa-mir-7f-1, hsa-mir-517b, hsa-mir-517c and hsa-mir-30d ... 51
Figure 4.15 The electrophoresis result of hsa-mir-9-2, hsa-mir-7a-2, hsa-mir-517a and hsa-mir-519e ... 53
Figure 4.16 The electrophoresis result of hsa-mir-145, hsa-mir-222, hsa-mir-192, hsa-mir-223, hsa-mir-506, hsa-mir-141-1 and hsa-mir-141-2 ... 54
Figure 4.17 The electrophoresis result of hsa-mir-514-1, hsa-mir-514-2, hsa-mir-514-3, hsa-mir-92-2 and hsa-mir-106a ... 56
Figure 4.18 MIRPM flow chart ... 59
Figure 4.19 Two types of operation of web interface ... 60
Figure 4.20 The result of user given a miRNA ... 61
Chapter1. Introduction
1.1 Overview of scheme
Since miRNA were discovered about a decade, there are more and more information about miRNAs is available on the public domain. However, the known transcriptional start sites of miRNAs are relative required. In the molecular biology, scientists are interesting in the how miRNAs are regulated and targeting.
1.2 Biogenesis of miRNAs
MicroRNAs (miRNAs) are the small single-strand regulatory RNAs about 21nt in length. The mature miRNAs are capable of interfering with messenger RNAs (mRNAs) through complete or partial complementarities. Most of miRNA genes were transcribed by RNA polymerase II [1]. After RNA polymerase II finished miRNA gene transcription, the pri-miRNAs were capped in the 5’ head and polyadenylated in the 3’ tail [2] (see pri-miRNA in Figure1.1). Pri-miRNAs were sooner cut by Drosha, a nucleus enzyme which can process pri-miRNA into pre-miRNA. After that, pre-miRNAs were transported from nucleus to cytoplasm by nuclear membrane protein, Expotin 5 and then pre-miRNAs were cut by Dicer, a cytoplasm protein which can process pre-miRNA into single-strand mature miRNA. Finally, the mature miRNAs were ready and are going to induce RNA interference (RNAi) through RNA induced silencing complex (RISC).
Figure 1.1 The miRNA endogenesis process
miRNA was been discovery over fifth-teen years, as the first miRNA, lin-4 and let-7, were identified in 1993 [6]. With the rapid progress in identifying more miRNAs molecules and understanding their function, mechanism and target gene regulation, the variety kinds of miRNA are discovered [6]. As shown in Figure 1.2, the intergenic miRNAs are defined as non-gene-overlap miRNA. In contrast of intronic and exonic miRNAs those have the gene-overlap region in the intron and exon, respectively. The intergenic miRNAs must have their own promoter to ensure the initiation of transcription and regulation. In the intronic or exonic miRNAs, they share the promoter of overlapped gene and miRNA is co-expressed and co-regulated with the overlapped gene. In addition, intergenic miRNAs do not need post-transcriptional modification but intronic and exonic miRNAs need alternative splicing to
produce the final miRNA product.
Figure 1.2 The illustration of intergenic miRNA
1.1 Transcriptional regulation of miRNAs
MicroRNA gene transcribed by RNA polymerase II is shown in the Figure 1.3. The transcription will not initiate until all the transcription factors are recruited, especially the TFIIB. The initiation is the most important of transcription. TBP and TFIIB could find a region of promoter to bind. Once TFIIB incorporated TBP to bind on the promoter, it will recruit a serial of transcriptional factor to bind of itself. However, transcriptions of some genes do not need TBP because TBP (TATA box binding protein) is a kind of DNA binding protein which can bind on the sequence motif, TATA box. Thus, TFIIB is especially important in TATA box independent gene. TFIIB could enhance the binding affinity of TBP or bind on the promoter without TBP. It is believed that there is conservation motif around the transcriptional start site for TFII binding. For example, Inr (Initiating region) region is a conserved motif presence in some genes and some transcriptional factor could bind on it.
Other transcriptional factor, like TFIIF could stabilize the RNA polymerase II. A stable RNA polymerase II binding on the transcriptional start site is called closed complex. After the DNA helicase unwind the downstream DNA double helix, the closed complex became open complex. Once open complex is formation the transcription is going to the second step, elongation step. When the full length of gene was transcribed, the RNA polymerase II will leave the DNA called the termination step.
Thus, the key of miRNA transcription is the initiation step. The general transcription factor shown in the Figure 1.3 is the same in all genes. But some of gene specific transcriptional factor might be different in miRNA gene. Therefore, the miRNA specific transcriptional factor is especially important in the study of miRNA regulation.
Figure 1.3 The transcriptional regulation of RNA pol II transcribe[7]
Hence, the promoter is the key cis-reulatory element of miRNA gene transcription. The definition of promoter might be confused. Generally, the promoter might refer to distal promoter, proximal promoter and core promoter (see Figure 1.4). But the narrow definition of promoter only refers to core promoter. No matter how the definition of promoter, the promoter always refer to the regulation sequence element of gene and generally locate on the upstream of gene (see Figure 1.4).
Figure 1.4 The illustration of promoter
1.4 Motivation
MicroRNA could induced some cancer through the over-expressed the oncogene or under-expressed the tumor-suppressed gene. Although there are many researches on the miRNA targeting and RNAi mechanism, the regulation of miRNA is still less discovered. The regulation of miRNA is important because to control the miRNA could control the miRNA target gene. For some case, to control the miRNA transcriptional regulation is to control the tumor development.
Since RNAi is a post-transcriptional gene silencing mechanism in eukaryotes which can be triggered by miRNA and other small RNA molecules. It is necessary to understand how does the miRNAs are controlled in living cell before we apply RNAi in applications. In addition, there are many researches involved in miRNA target prediction. The more and more miRNA target will be discovered and it will be possible for construct a miRNA gene/miRNA target gene network. As a result, the miRNA transcriptional regulation is important to understand miRNA target regulation and further systematically studying.
1.5 Goal
In this study, our major goal is to identify human miRNA transcriptional start site as more as possible. To do this, we incorporated different promoter prediction programs to
Therefore, we hope to develop a pipeline for identify promoter region of intergenic miRNA. User can input the intergenic miRNA id or set a threshold to cut off in which they interest. The system will return the optimal and specific groups of primers quickly according to user’s requirements. It will reduce the time and cost in synthesizing primers and assaying. Finally, the system is also designed with a friendly interface for biologists or scientists to use easily.
Chapter2. Related Works
2.1 Putative promoter prediction programs
As shown in Table 2.1 there are varieties of promoter prediction tools for gene annotation [8-24]. Most of programs identify the promoter region based on the biological features of TSSs such as the TATA box score or CpG islands. More recently, simple consensus methods using a combination scheme have been proposed. All of these computation TSS prediction tools are useful in our studies. We can incorporate some of them into our system to obtain putative TSS information.
Table 2.1 TSS prediction tools
Package Web Server Predicted Result Reference
ARTS 8 8 9 Sonnenburg 2006[9] CpgProD 9 9 8 Ponger 2002[15] DragonGSF 8 9 8 Bajic 2003[10] DragonPF 8 9 8 Bajic 2002[16] Eponine 9 9 8 Thomas 2002[17] FirstEF 8 9 9 Davuluri 2001[18] McPromoter 8 9 9 Ohler 2002[19] NNPP2.2 8 9 9 Reese 2001[20] PromoterExplorer 8 8 8 Xie, 2006[21] Promoter2.0 9 9 8 Knudsen 1999[22] EP3 9 9 8 Abeel 2008[23] EnsemPro 8 8 8 Won, 2008[11] TSSW 8 9 8 Solovyev & Salamov, 1997[24] TSSG 8 9 8 Solovyev & Salamov, 1997[24]
Different promoter prediction programs focus on the different feature on the transcriptional start site
[Ensempro] Although several computational methods have been developed to identify transcription start sites (TSSs)/promoters, the computational prediction still needs improvement. Due to low performance, the promoter prediction programs can provide misleading results in functional genomics studies. To improve the prediction accuracy, we propose the use of an ensemble approach, EnsemPro (Ensemble Promoter), which combines the prediction results of the existing promoter predictors. We schematically compared the prediction performance of the currently available promoter prediction programs in an identical evaluating environment, and the results served as a guide for choosing the combined predictors. We applied three representative ensemble schemes-the majority voting, the weighted voting, and the Bayesian approach-for the TSS prediction of hundreds of human genomic sequences. EnsemPro identified the TSSs more precisely than other combining methods as well as the currently available individual predictor programs.
2.2 Intergenic miRNA literature reviews
In addition, some of pri-miRNAs were experimental verified [2]. These pri-miRNA full length sequences could be checking data in our system. We choose these known pri-miRNA promoter region to be a positive control.
Analysis of the genomic localization of known human miRNAs has revealed that the major miRNA located in the intergenic regions, and sometimes in clusters of several miRNAs, and therefore they must have their own promoters[2]. However, 25% of human miRNA genes
were located within known protein coding genes primarily, but not invariably, within introns. This location could imply that these miRNAs are excised from intron lariats derived from the splicing of the pre-mRNAs transcribed from these flanking genes, as previously reported for some small nucleolar RNAs (Weinstein and Steitz 1999). However, as a number of these intronic miRNAs are found in the antisense orientation, relative to the surrounding gene (Lagos-Quintana et al. 2003), this localization does not prove that miRNAs can be derived from pre-mRNAs. Moreover, the fact that mature human miRNAs can be ectopically expressed using either pol II– or pol III–based expression plasmids (Zeng and Cullen 2003; Chen et al. 2004) indicates that miRNA genes are not dependent on aspecific polymerase, such as pol II, for their appropriate processing and expression in vivo. In this report, we have examined several isolated or clustered human miRNAs and find that they are derived from capped, polyadenylated pri-miRNA precursors. In the case of the human miR-21 miRNA, we have cloned the entire 3433-nt pri-miRNA transcript as well as the flanking promoter element. We show that mature miR-21 is indeed processed from this long pri-miRNA and not from a smaller RNA transcribed from a cryptic internal promoter element, and we further demonstrate that the miR-21 promoter can be used to express a protein-coding mRNA in human cells. Finally, we demonstrate that the presence of a miRNA gene within the 3’ untranslated region (3’UTR) of an mRNA, as seen with a small number of human miRNAs, results in a surprisingly modest inhibition of the expression of the linked open reading frame. When considered together with earlier work, these data argue that RNA polymerase II is likely to be the major, and possibly the only, polymerase involved in human miRNA transcription.
Chapter3. Materials and Methods
3.1 Materials
We collected the miRNA sequence data from miRBase, Solexa tag data from DBTSS, CAGE tag data from FANTOM3 CAGE tag database, chromosome sequence data and evolution conservation data from UCSC genome browser.
3.1.1 miRBase
The miRNA information, e.g., miRNA name, miRNA type, miRNA precursor sequence, miRNA precursor position and which strand of chromosome is collected in miRBase. In the miRNA type miRBase distinguish the miRNA type into five type, i.e., intronic, exonic, 3’UTR, 5’UTR and intergenic. In the lasted version of miRBase v11.0[25] , there are 60 species and 12 virus miRNA were included. In human, there are 678 miRNAs and 273 miRNAs were annotated as intergenic miRNA.
Figure 3.1 miRBase
3.1.2 DBTSS
In the lasted update DBTSS[26], there are two Solexa data have been included, i.e., HEK293 dataset and MCF7 dataset. HEK293 is human embryonic kidney 293 cells. MCF7 is a human cell line of breast cancer. Both of above are the human TSS data we used in our system.
DBTSS is a database which collected transcriptional start sites. In addition, DBTSS data is precise because some of transcriptional start sites in the DBTSS has the experimental evidence support, i.e., the experimentally-determined 5’-end sequence of full-length cDNAs. The full-length cDNAs sequence is valuable because the traditional experimental method is
hard to get the full-length cDNA and thus the 5’-end sequence of cDNAs were always missing.
In the lasted update[26], DBTSS collected human TSS with 19 million uniquely-mapped and RefSeq-associated 5’end sequence[27]. The update human TSS was generated using the newly developed Solexa sequencer. In addition, DBTSS provide an interface for interpreting collected TSS data. That is, they connected expression information with the predicted transcription factor binding site and annotating evolutionary conservation or species-specificity of the promoters and the transcripts. All of above information could be browsed by a dynamic and flexible comparative genomic viewer. In conclusion, DBTSS provides a platform to undertake transcriptome analyses.
Figure 3.2 DBTSS
3.1.3 FANTOM3 CAGE tag database
CAGE tag database is a subproject of FANTOM (Functional Annotation of the Mouse) which aims at providing the ultimate characterization of the mouse transcriptome. FANTOM project develop a serial of new experimental technique, e.g., full-length cDNA libraries, CAGE and GSC. With these powerful techniques, users could analyze
Our strategies are based on the philosophy that progress depends on the combination of technical developments, biological problems and bioinformatics. After the development of
original technologies (such as full-length cDNA libraries, CAGE, GSC) followed by massive application, the data have been analyzed by the members of the Fantom-3 consortium. The combination of original RIKEN full-length cDNAs, CAGE tags and GSC ditags allowed providing the most extensive description of any transcriptome so far. These results were summarized in two milestone papers on the September 2, 2005 issue of Science, another milestone one in Nature Genetics, the Genome Network / FANTOM3 article collection in PLoS Genetics, and other sattelites.
3.1.4 UCSC Genome browser
As vertebrate genome sequences near completion and research refocuses to their analysis, the issue of effective genome annotationdisplay becomes critical. A mature web tool for rapid and reliabledisplay of any requested portion of the genome at any scale, togetherwith several dozen aligned annotation tracks, is provided at http://genome.ucsc.edu. This browser displays assembly contigs and gaps, mRNA and expressedsequence tag alignments, multiple gene predictions, cross-specieshomologies, single nucleotide polymorphisms, sequence-tagged sites, radiation hybrid data, transposon repeats, and more as a stackof coregistered tracks. Text and sequence-based searches providequick and precise access to any region of specific interest. Secondarylinks from individual features lead to sequence details and supplementaryoff-site databases. One-half of the annotation tracks are computedat the University of California, Santa Cruz from publicly availablesequence data; collaborators worldwide provide the rest. Userscan stably add their own custom tracks to the browser for educationalor research purposes. The conceptual and technical framework ofthe browser, its underlying MYSQL database, and overall use aredescribed. The web site currently serves over 50,000 pages perday to over 3000 differentusers.
Figure 3.4 UCSC Genome browser web interface
3.1.5 miRNAMap
miRNAMap 2.0 collected experimental verified microRNAs and experimental verified miRNA target genes in human, mouse, rat, and other metazoan genomes. In addition to known miRNA targets, three computational tools previously developed, such as miRanda, RNAhybrid and TargetScan, were applied for identifying miRNA targets in 3' -UTR of genes. In order to reduce the false positive prediction of miRNA targets, several criteria are supported for filtering the putative miRNA targets. Furthermore, miRNA expression profiles can provide valuable clues for investigating the properties of miRNAs, such tissue specificity and differential expression in cancer/normal cell. Therefore, we performed the Q-PCR experiments for monitoring the
expression profiles of 224 human miRNAs in eighteen major normal tissues in human. The cross-reference between the miRNA expression profiles and the expression profiles of its target genes can provide effective viewpoint to understand the regulatory functions of the miRNA. Besides, the interface is also redesigned and enhanced.
Figure 3.5 miRNAMap web interfaces
3.2 Method overview
The present system contains three parts as being shown in Figure 3.1. The first part is computational prediction of Transcription Start Site (TSS). The second part is experimental conditions selection. The third part is experimental verification.
Figure 3.6 System flowchart
3.3 Data preprocessing
The genomic information and sequence of miRNAs were retrieved from miRBase v10.1 which is a database collected variety information of miRNAs [25]. The miRNAs are thought as intragenic where the GENOME_CONTEXT field in the miRBase is 3’UTR, 5’UTR, intron or exon. Therefore, the miRNAs are intergenic when sequences of pre-miRNAs do not overlap
on the transcript of genes, i.e. overlap on 3’UTR, 5’UTR, intron or exon. In addition, the miRNA expression profiles were collected from MIT miRNA microarray profiles [5] and CGU miRNA Q-PCR profiles. The miRNAs were defined as highly expressed if the expressed value above 7.5 in MIT miRNA microarray profiles and expressed value above 150×104copies/ng in CGU miRNA Q-PCR profiles. We collect all the highly expressed miRNA and classified miRNA to 18 classes according to tissue type. Finally, we separately annotated the promoters of all the highly expressed intergenic miRNAs with varied computational annotation method and prepare the 5’RACE product of each tissue. The computational annotation method and 5’RACE technology were discussed in below sections.
3.4 Computational TSS prediction
3.4.1 Promoter prediction tools
After we collected highly-expressed intergenic miRNA sequence data, the next step was to decide the upstream region from pre-miRNA +1 position to considered putative promoter region. Since some pri-miRNA transcripts have been discovered [1, 2] and the length of pri-miRNA are diversity. The longer upstream region is needed to ensure the promoter of some long pri-miRNA could be annotated, and therefore we use 5000bp upstream region to be a putative promoter region.
3.4.2 CAGE tags
mRNA sequence in the proximity of the cap site [28]. Because all of the RNA polymerase II transcripts were altered the 5’ end nucleotide to 7-methylguanosine after the finish of transcription, the genomic position of CAGE tags could be represented for the transcription start site (TSS). In addition, CAGE tags which had an identical 5’ terminal site were grouped into a CAGE-tag starting site (CTSS) []. Mapping of CAGE tags to the human intergenic miRNA putative promoter region allowed us to identify 1111 potential TSSs (see Figure 3.3).
As shown in Figure 3.2, the CAGE tags which could map to the intergenic miRNA putative promoter region might be a potential intergenic miRNA TSS. The more of the CAGE tags number in the one CTSS, the more support evidence of this potential TSS. Moreover, the distribution of CAGE tags mapped to the all intergenic miRNA putative promoter region was shown in Figure 3.3. We can find that
Figure 3.7 CAGE tags and CTSS
Figure 3.8 position distribution of human intergenic miRNA CAGE tags
3.4.3 Solexa tag
Solexa tag is the new high-throughput sequencing technique product which sequencing templates are immobilized on a special surface designed to present the DNA in a manner that facilitates access to enzymes. The used enzymes could target the high stability of surface-bound template and low non-specific binding of fluorescently labeled nucleotides. This new sequencing technique could amplified all DNA bound on the surface in the same time with up to 1000 identical copies of each single molecule in close proximity. Because this process does not involve photolithography, mechanical spotting or positioning of beads into wells, Solexa sequencing technology could up to ten million single molecule clusters per square centimeter.
3.4.4 Evolutionary conservation
In the living organisms, the more important functional unit the more conservation they are. The kind of animal become more and more but the function of proteins do not increase too much during evolution. There are many way of conservation, the conservation in sequence, structure and pathway, e.g., the sequence of TATA box on the promoter shows the great conservative across eukaryotes and the structure of RNA polymerase in human and mouse is highly similarity. The RNA polymerase needs a lot of transcriptional factor help for locate on the right position of transcriptional site. As result, it is believed there are some conservation in transcriptional start sites.
Figure 3.9 Comparison of Phastcons17way with Phastcons28way
In the Figure 3.9, the conservation in human chromosome sequences was shown. Talk about the data…
Figure 3.10 The conservation of Human chromosome
3.4.5 Putative TSS clustering
The traditional promoter prediction methods focus on promoter region rather than the accurately position of TSS. Therefore, the traditional promoter prediction program predicts a putative promoter region and the position of TSS are given by the 3’ terminal of this putative promoter region. In this study, we focus on the accurately position of TSS. To approach this goal, we use a serial biological experiment to confirm the exactly position of TSS in the putative TSS regions. A putative TSS region was predicted by different promoter prediction program then clustered by their related distance.
Figure 3.11 The rule of putative TSS cluster
Figure 3.12 Choose the 5’ terminal site of putative TSS cluster as TSS
Figure 3.13 An example of primer dimmer
3.4.6 Putative TSS ranking
regions. The putative TSS regions with first order will be selected with highest priority to undertook a serial examine to confirm this candidate whether this predicted candidate is true or false.
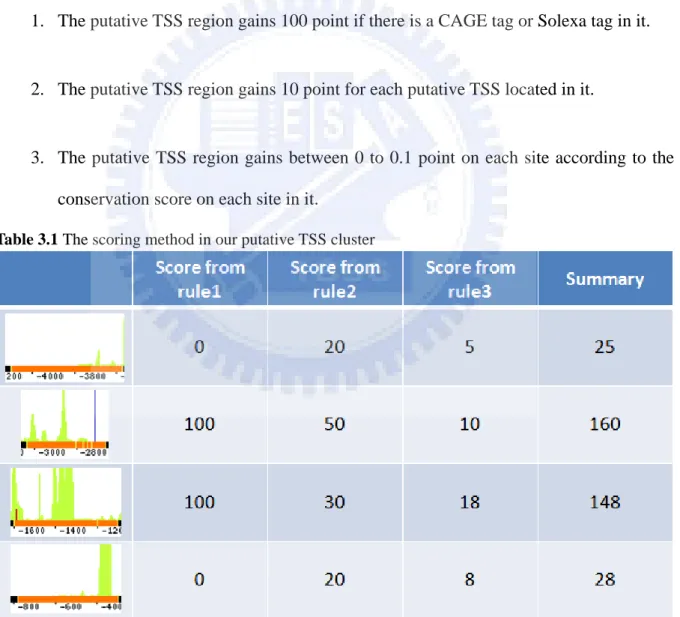
Our ranking method was based on the three rules, i.e., the absence of the representative 5’ terminal sequence tags, the predicted result density of putative TSS region and the evolutionary conservation of putative TSS region. In the summary the three rules are describes as followed and we give an example in the Table 3.1:
1. The putative TSS region gains 100 point if there is a CAGE tag or Solexa tag in it.
2. The putative TSS region gains 10 point for each putative TSS located in it.
3. The putative TSS region gains between 0 to 0.1 point on each site according to the conservation score on each site in it.
3.5 Experimental condition selection
It is critical for detect miRNA from a tissue extract with enough expression level. Genes for protein coding expressed different level in different tissue for their tissue-specific function, so does the miRNAs. As a result, if we want to examine the putative TSS of a miRNA we could choose the highly expressed miRNA in particular tissue as the source of miRNA. Therefore, the miRNA expression profile could be joined in our study. There are two common technology for detect expression profile of miRNA, i.e., miRNA microarray and miRNA Q-PCR. Based on these technologies, the Broad institute of MIT and Harvard made a great effort in miRNA microarray expression profile of human cancer. In addition, the molecular biology
3.5.1 Human normal tissue Q-PCR profile
In molecular biology, real-time polymerase chain reaction, also called quantitative real time polymerase chain reaction. It is a PCR-based laboratory technique which is used to amplify and quantify a targeted DNA molecule in the same time. It enables both detection and quantification of a specific sequence in a DNA sample. The Q-PCR procedure follows the general principle of PCR. The key feature of Q-PCR is that the amplified DNA is quantified as it accumulates in the reaction in real time after each amplification cycle. There is one common methods of quantification, use of fluorescent dyes that intercalate with double-stranded DNA, and modified DNA oligonucleotide probes that fluoresce when hybridized with a complementary DNA. With the detection of the fluorescent intensity change, the amplified DNA could be quantified.
Frequently, Q-PCR is combined with reverse transcription polymerase chain reaction to quantify low expressed messenger RNA. This combined technique enabling a researcher to quantify relative gene expression at a particular time, or in a particular cell or tissue type. Although real-time quantitative polymerase chain reaction is often marketed as RT-PCR, it should not be confused with reverse transcription polymerase chain reaction, also known as RT-PCR.
Figure 3.14 The expression profile of Q-PCR
3.6 Experimental verification
Third, we use a series of biological experiments to identify the putative miRNA promoter according to the information we annotated above. All of the 18 tissue totals RNA were
obtained from Ambion.
Figure 3.15 The experiment flow of verify the putative TSS
Rapid amplification of cDNA ends (RACE) is a PCR based technique which facilitates the cloning of full-length cDNA sequence when only 5’end partial or 3’end partial cDNA sequences are available[]. Traditionally, the lack of 5’end of cDNA sequence is often occurred when those cDNA sequences were obtained from plasmid or phage libraries. Because of the nature of the enzymatic reaction the probability of retrieving the sequence of extreme 5’ end region was very low even the libraries are very high quality. Since the 5’RACE is able to get the full length sequence of 5’ end region, it is facilitate to identify the sequence segment from TSS with designed primer.
In order to check all the putative TSS location, we use reversed transcription and nested PCR technique to detect our 5’RACE product whether the putative TSS location is true or false. In this section, we will firstly describe the main experimental techniques used about 5’RACE and then talk about reverse transcription. Finally, we will describe why nested PCR in our putative miRNA promoter identification process is necessary.
3.6.1 RACE
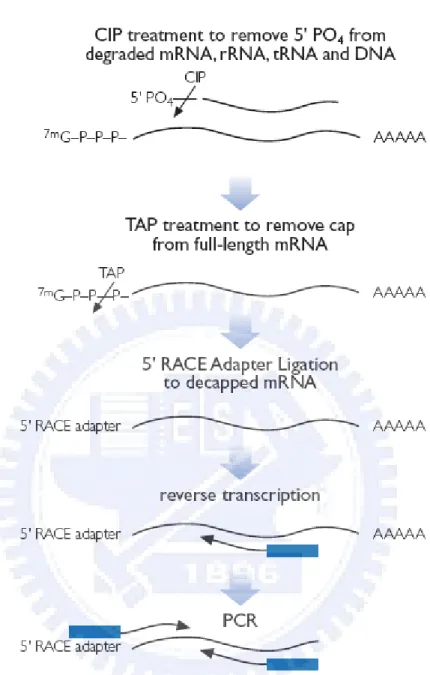
We used the kit provide from Ambion 5’RLM-RACE to undertake RACE in human normal 18 tissue. In 5’RLM-RACE (see Figure 3.16), it begins from the reaction of CIP. CIP is a enzyme which can degrade the 5’ phosphor chemical group from both DNA and RNA. Because of we use the human total RNA as primary RNA source, only RNA is removed 5’ phosphor chemical group in this step. After that, the second step of 5’RLM-RACE is removed CAP from full-length RNA. In this reaction, all RNA polymerase II transcripts will lose the 5’CAP structure. In the third step, the CAP-free RNA is ready to conjugation with an adapter sequence. With this 5’ adapter sequence, the following PCR primer designed could use this adapter sequence as left primer. With above three step the RACE product of 18 human normal tissue could be done.
Figure 3.16 Ambion 5’ RLM-RACE (From Ambion protocol: AM1700)
3.6.2 Reverser transcription
Reverse transcriptase is commonly used in research to apply the polymerase chain reaction technique to RNA in a technique called reverse transcription polymerase chain reaction. Because the reverse transcription is always combined with the PCR, it is general called RT-PCR. The classical PCR technique could only be applied to DNA strands. With the help of
reverse transcriptase, RNA could be reverse transcribed into DNA and thus making PCR analysis of RNA molecules possible. Reverse transcriptase is also used to create cDNA libraries from mRNA. Here we use reverse transcription to create cDNA from 18 human normal tissue RACE products and use nested PCR to detect our predicted TSS. The nested PCR will described in the next section.
3.6.3 Nested PCR
The polymerase chain reaction (PCR) is a technique widely used in molecular biology. It derives its name from one of its key components, a DNA polymerase used to amplify a piece of DNA by in vitro enzymatic replication. As PCR progresses, the DNA thus generated is itself used as template for replication. This sets in motion a chain reaction in which the DNA template is exponentially amplified. With PCR it is possible to amplify a single or few copies of a piece of DNA across several orders of magnitude, generating millions or more copies of the DNA piece. PCR can be extensively modified to perform a wide array of genetic manipulations.
As well as PCR technique, nested PCR is extended technique based on the PCR. It could be simply imaged as the serial PCR reaction at twice. For some reason, the longer PCR product size or the lower concentration of target DNA, nested PCR is required to detect DNA molecule which PCR could not detect. Because of the nested PCR is based on the PCR technique, the key enzyme is DNA polymerase but it needs two pairs of primer. In our work, the nested PCR product amplified from outer primer will longer than product amplified from inner primer. Here, the left primer of outer primer pair was from the 5’RCAE adaptor sequence (see section 3.6.2). The goal of nested PCR is to detect the 5’ segment contain transcriptional start site which is exist or not in the cDNA from human normal 18 tissue
RACE product. If the designed primer for the one predicted transcriptional start site could get the banding pattern after the nested PCR in the electrophoresis, the predicted transcriptional start site was be confirmed. Therefore, we undertook electrophoresis on every nested PCR product to verify each putative TSS with designed primer pair.
3.6.4 Sequencing
The term DNA sequencing encompasses biochemical methods for determining the order of the nucleotide bases, adenine, guanine, cytosine, and thymine, in a DNA oligonucleotide. The sequence of DNA constitutes the heritable genetic information in nuclei, plasmids, mitochondria, and chloroplasts that forms the basis for the developmental programs of all living organisms. Determining the DNA sequence is therefore useful in basic research studying fundamental biological processes, as well as in applied fields such as diagnostic or forensic research. The advent of DNA sequencing has significantly accelerated biological research and discovery. The rapid speed of sequencing attained with modern DNA sequencing technology has been instrumental in the large-scale sequencing of the human genome, in the Human Genome Project. Related projects, often by scientific collaboration across continents, have generated the complete DNA sequences of many animal, plant, and microbial genomes.
3.6.5 Sequence alignment
In bioinformatics, Basic Local Alignment Search Tool, or BLAST, is an algorithm for comparing primary biological sequence information, such as the amino-acid sequences of different proteins or the nucleotides of DNA sequences. A BLAST search enables a researcher
to compare a query sequence with a library or database of sequences, and identify library sequences that resemble the query sequence above a certain threshold. For example, following the discovery of a previously unknown gene in the mouse, a scientist will typically perform a BLAST search of the human genome to see if humans carry a similar gene; BLAST will identify sequences in the human genome that resemble the mouse gene based on similarity of sequence. The BLAST program was designed by Eugene Myers, Stephen Altschul, Warren Gish, David J. Lipman and Webb Miller at the NIH and was published in J. Mol. Biol. in 1990.
A multiple sequence alignment (MSA) is a sequence alignment of three or more biological sequences, generally protein, DNA, or RNA. In general, the input set of query sequences are assumed to have an evolutionary relationship by which they share a lineage and are descended from a common ancestor. From the resulting MSA, sequence homology can be inferred and phylogenetic analysis can be conducted to assess the sequences' shared evolutionary origins. Visual depictions of the alignment as in the image at right illustrate mutation events such as point mutations (single amino acid or nucleotide changes) that appear as differing characters in a single alignment column, and insertion or deletion mutations (or indels) that appear as gaps in one or more of the sequences in the alignment. Multiple sequence alignment is often used to assess sequence conservation of protein domains, tertiary and secondary structures, and even individual amino acids or nucleotides.
Multiple sequence alignment also refers to the process of aligning such a sequence set. Because three or more sequences of biologically relevant length can be difficult and are almost always time-consuming to align by hand, computational algorithms are used to produce and analyze the alignments. MSAs require more sophisticated methodologies than pairwise alignment because they are more computationally complex to produce. Most multiple sequence alignment programs use heuristic methods rather than global optimization because identifying the optimal
alignment between more than a few sequences of moderate length is prohibitively computationally expensive.
Chapter4. Results
In this chapter, we will show both the computational predicted transcriptional start site and experimental verified transcriptional start site.
4.1 Predicted TSS of human intergenic miRNA
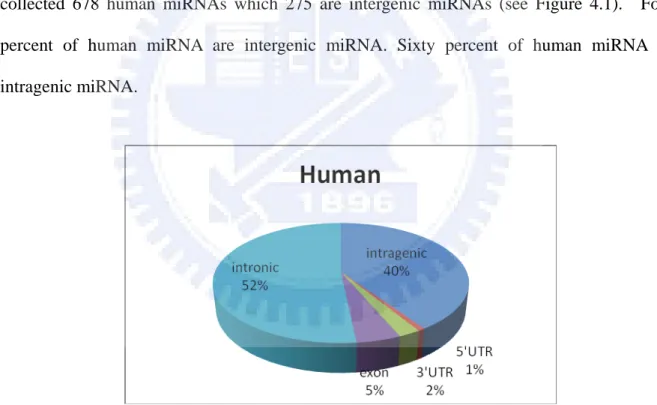
All human intergenic miRNA were retrieved from miRBase. In the lasted version, miRBase collected 678 human miRNAs which 275 are intergenic miRNAs (see Figure 4.1). Forty percent of human miRNA are intergenic miRNA. Sixty percent of human miRNA are intragenic miRNA.
Figure 4.1 All kinds of miRNA in human genomes
All TSS candidates are predicted with the upstream sequence of miRNA precursor, so called pre-miRNA. The human genome sequence, sequence of chromosome1 to chromosome22 and sex chromosome(X and Y), was downloaded from Ensembl database. The
upstream sequence was retrieved from human chromosome sequence according to the position of miRNA precursor. Because of the DNA sequence and miRNA precursor position were both at the lasted version, NCBI36, the upstream sequence was directly parsed from the position -5400bp to -1bp of the first residue of miRNA precursor. Four promoter prediction tools were predicted 3963 putative TSS between -5400bp to -1bp and the position of predicted TSS distribute over the region shows the randomization (see Figure 4.2).
Figure 4.2 The predicted result distribution between upstream -5400bp to -1bp of five promoter
prediction programs
The position of TSS was predicted by EP3, Eponine, NNPP and Promoter2.0, the result of each tools are 602, 1046, 1167 and 1148 respectively (see Figure 4.3).
Figure 4.3 The predicted result of five promoter prediction programs
Furthermore, we analyses the coverage of each tool to find out the interaction in our system.
4.1.1 The putative TSS cluster
After all putative TSS are predicted, the putative TSS cluster is ready for clustering.
Figure 4.5 The putative TSS distribute between from upstream -5400bp to -1bp after clustering
4.1.2 The prediction performance
Since our proposed method could be a kind of ensemble prediction tool, we compare our system performance with EnsemPro[11]. With the test data from EnsemPro, the TSS locate in our putative TSS cluster are seen as a true positive data, thus, the TSS are out of our putative TSS cluster are seen as a false negative data. The cross-validation was undertaking with test data and run thirty times repeat to check out the robustness of our system.
Figure 4.6 Performance of our integrated system
4.2 Experimental evidence of human intergenic miRNA
TSS
There are two experimental sequence tag, CAGE tag and Solexa tag, both of two were used for considered as evidence of transcriptional start site.
4.2.1 CAGE Tag Evidence
All CAGE tag position were retrieved from CAGE database, here we use two definition of the CAGE tag. CTSS could be a kind of transcriptional start site evidence because
Figure 4.7 CTSS distribution between upstream -5200bp to upstream -1bp
4.3 Verified TSS of human intergenic miRNA
4.3.1 Selected human intergenic miRNAs and tissues
The experimental condition was selected by Q-PCR expression profile which expression level above 100 copies per nano-gram. This expression level was selected during our several nested PCR test of human miRNA. We find that miRNAs expressed over 100 copies per nano-gram was easily to get PCR product. Table 4.1 shows the human intergenic miRNA with the expression level above 100 copies per nano-gram with a descending order.
In the other hand, human total cDNA was made from human total RNA (Ambion FirstChoice® Human Total RNA Survey Panel). There are 18 normal tissues total RNA in the Ambion product. Because the tissues we used are the same as the miRNA Q-PCR expression profiled which that work used, we can directly use Ambion product to undertaking the RACE and reverse transcription. In the beginning, we start the RACE reaction with 5’RLM-RACE kit (Ambion FirstChoice® RLM-RACE Kit) on the every tissue in Ambion human normal 18 tissues. After that, the human normal 18 tissue RACE products were undertook the reverse transcription reaction. Finally, the human normal 18 tissue cDNA products were obtained and were characterized with 5’cap free.
Table 4.1 Experimental condition selection of human intergenic miRNA Intergenic miRNA Strand Tissue Expression
Level Putative TSS Expected PCR product size hsa-mir-125b-1 (has-mir-125b) - Cervix 3934 -1555 668 hsa-let-7a-1 (has-let-7a) + Cervix 3287 -2801 671 hsa-let-7a-2 - Cervix 3287 -3801 827
(has-let-7a) hsa-mir-30b - Lung 3146 -4001 525 hsa-mir-517b + Placenta 2052 -1508 431 hsa-mir-145 + Cervix 1864 -866 685 hsa-mir-9-2 (hsa-mir-9) - Brain 929 -1429 898 hsa-mir-125a + Cervix 861 -3818 285 hsa-mir-19b-2 (hsa-mir-19b) - Ovary 531 -1824 772 hsa-mir-92-2 (hsa-mir-92-) - Cervix 503 -1670 1008 hsa-mir-146a + Lung 357 -801 533 hsa-mir-146b + Lung 357 -801 657 hsa-mir-92b + Brain 357 -725 662 hsa-mir-27a - Placenta 357 -4100 >=964 hsa-mir-517a + Placenta 332 -4001 553 hsa-mir-122a + Liver 314 -4811 417 hsa-mir-100 - Cervix 293 -1401 1265 hsa-mir-519e + Placenta 272 -3915 717 hsa-mir-30d - Placenta 235 -4962 738 hsa-mir-206 + Muscle 222 -4053 1079 hsa-mir-223 + Lung 221 -5280 771 hsa-mir-23a - Ovary 214 -1300 >=995 hsa-mir-10b + Kidney 204 -2801 599 hsa-mir-517c + Placenta 200 -1801 910 hsa-mir-222 - Brain 189 -5192 800 hsa-let-7f-1 (hsa-let-7f) + Cervix 167 -3404 351 hsa-mir-130a + Kidney 151 -2711 293 hsa-mir-29a - Muscle 146 -1101 1106 hsa-let-7e + Cervix 141 -3901 1443 hsa-mir-506 - Testes 139 -1000 849 hsa-mir-124a-2 (hsa-mir-124a) + Brain 137 -2278 990 hsa-mir-124a-1 (hsa-mir-124a) - Brain 137 -5247 706 hsa-mir-143 + Kidney 125 -2788 491 hsa-mir-106a - Kidney 115 -2401 744
hsa-mir-132 - Brain 110 -1001 762 hsa-mir-514-1 (hsa-mir-514) - Testes 110 -2817 793 hsa-mir-514-2 (hsa-mir-514) - Testes 110 -2805 867 hsa-mir-514-3 (hsa-mir-514) - Testes 110 -1601 984 hsa-mir-192 - Kidney 102 -3500 822 has-mir-141(1) + Placenta 13 -3101 778 has-mir-141(2) + Placenta 13 -1000 666
4.3.2 Designed putative TSS cluster specific primer by Primer3
When all human normal 18 tissue total cDNA were done in the section 4.3.1, all cDNA products were ready to undergoing nested PCR reaction. As shown in the Table 4.2, each primer pair of human intergenic miRNA designed for nested PCR was designed for amplified the region between the putative TSS to the downstream 700bp of putative TSS. Each expected PCR product size was shown in the Table 4.1. The Figure 4.9 shows the primer design strategy which can ensure the every possible TSS locates in the putative TSS cluster will be detected by nested PCR technique.
4.3.3 Identification of TSS by nested PCR
In the first nested PCR reaction, we choose the liver specific human intergenic miRNA – hsa-mir-122a. This miRNA could cause liver cancer and was extremely highly expressed in liver. Furthermore, the CAGE tag supports the upstream -4811bp might be a TSS of hsa-mir-122a. Because of this is the first run of nested PCR, we run two positive controls to ensure our nested PCR is successful. The first positive control is CXCR4 cDNA product with primer provides from Ambion 5’RLM-RACE kit. The second positive control is GAPDH cDNA product with primer designed for the 5’ terminal of gene segment.
Figure 4.10 The electrophoresis result of hsa-mir-122a
As shown in the Figure 4.10, we verified the upstream -4811bp putative TSS of hsa-mir-122a in the lane4, lane5 and lane6. With the positive control supported in the lane1, we get a single band around 500bp in lane4. It is interested that has-mir-144 nested PCR product size is near to the expected length (See Table 4.2). In order to confirm the exactly
genomic location, we sequenced the cDNA product of liver hsa-mir-122a and will use blast tool to verify putative TSS, this section will talk later in the 4.3.4.
Table 4.2 The PCR condition use of hsa-mir-122a
lane1 lane2 lane3 lane4 lane5 lane6 lane7 ID Positive
control X GAPDH 122a 122a 122a X
Outer Tm 60 X 60 60 60 60 X
Inner Tm 60 X 60 60 60 60 X
Tissue liver X liver liver kidney Lung X
Putative TSS X X X -4811 -4811 -4811 X
Expected
PCR product length X 417 417 417 X
Next we choose the hsa-mir-130a and hsa-mir-143 to verify the putative TSS with nested PCR. Because of both two human intergenic miRNA we choose have the highly CAGE tag support in the putative TSS cluster. In addition, we test the expression level with detected level in the nested PCR reaction. Thus, we choose three tissues expressed both expressed hsa-mir-130a and hsa-mir-143, lane1 to lane6 shown in the Figure 4.11. The expressed level of 130a in the liver, kidney and lung is 9×10⁴, 150×104 and 54×104 copies per nano-gram respectively. In the other hand, the expressed level of 143 in the liver, kidney and lung is 12×104, 125×104 and 105×104 copies per nano-gram respectively. Because of lane2, lane5 and lane6 shows the band (see Figure 4.11), we choose the kidney nested PCR product both of hsa-mir-130a and hsa-mir-143 and lung nested PCR product of hsa-mir-143 to sequencing.
Figure 4.11 The electrophoresis result of hsa-mir-130a and hsa-mir-143
As shown in the Table 4.3, the predicted putative TSS are upstream -2711bp from the miRNA precursor of the hsa-mir-130a and upstream -2788bp from the miRNA precursor of the hsa-mir-143. With the sequencing result, we could get the exactly position of TSS in the putative TSS cluster if this putative TSS cluster is correct. The sequencing result will show in the later section 4.3.4.
Table 4.3 The PCR condition use of hsa-mir-130a and hsa-mir-143
lane1 lane2 lane3 lane4 lane5 lane6 lane7
ID 130a 130a 130a 143 143 143 X
Outer Tm 60 60 60 60 60 60 X
Inner Tm 60 60 60 60 60 60 X
Tissue liver kidney lung liver kidney lung X
Putative TSS -2711 -2711 -2711 -2788 -2788 -2788 X Expected
PCR product length 293 293 293 491 491 491 X
Third, we choose the human intergenic miRNA hsa-mir-10b, hsa-mir-30b, hsa-mir-146a and hsa-mir-146b to check the predicted putative TSS. After the first and second experiment,
we decide focus on the miRNA with Q-PCR expression value above 100 copies per nano-gram to undertake the nested PCR. In each human intergenic miRNA, we select the tissue which expression level is the highest to undertake nested PCR first. Thus, the top one Q-PCR expression level of the 18 tissues for hsa-mir-10b, hsa-mir-30b, hsa-mir-146a and hsa-mir-146b are 204×104, 3146×104, 357×104 and 357×104 copies per nano-gram respectively. As shown in the Figure 4.12, the hsa-mir-10b from kidney is in the lane1 and hsa-mir-30b, hsa-mir-146a and hsa-mir-146b are in the lane2, lane3 and lane4 respectively.
Figure 4.12 The electrophoresis result of hsa-mir-10b, hsa-mir-30b, hsa-mir-146a and hsa-mir-146b
Only the hsa-mir-30b has banding pattern after the electrophoresis (see Figure 4.12). The hsa-mir-10b shows the smear result the Figure 4.12. In addition, hsa-mir-146a and hsa-mir-146b shows the primer dimmer in Figure 4.12. Therefore, we selected the nested PCR product of kidney hsa-mir-30b to undertake the sequence analysis. The putative TSS of hsa-mir-30b are locate in the upstream -4001bp of hsa-mir-30b precursor (see Table 4.4).
Table 4.4 The PCR condition use of hsa-mir-10b, hsa-mir-30b, hsa-mir-146a and hsa-mir-146b
lane1 lane2 lane3 lane4 lane5 lane6 lane7
ID 10b 30b 146a 146b X X X
Outer Tm 59 59 60 60 X X X
Inner Tm 59 59 60 60 X X X
Tissue kidney lung lung lung X X X
Putative TSS -2801 -4001 -801 -801 X X X
Expected
PCR product length 599 525 533 657 X X X
Fourth, we choose the human intergenic miRNA hsa-mir-7a, hsa-mir-7e, hsa-mir-100, hsa-mir-124a-2, hsa-mir-92b and hsa-mir-132 to check the predicted putative TSS. It should be noted that Q-PCR expression profile cannot distinguish hsamir-124a-1 from hsamir-124a-2. Therefore, we will do the same putative TSS verification with nested PCR in the next experiment. The top one Q-PCR expression level of the 18 tissues for hsa-mir-7a-1, hsa-mir-7e, hsa-mir-100, hsa-mir-124a-2, hsa-mir-92b and hsa-mir-132 are 3827×104, 141×104, 293×104, 137×104, 357×104and 110×104 copies per nano-gram respectively. As shown in the Figure 4.13, the hsa-mir-7a-1, hsa-mir-7e, hsa-mir-100 from cervix are in the lane1, lane2 and lane3. The hsa-mir-124a-2, hsa-mir-92b and hsa-mir-132 from brain are in the lane2, lane3 and lane4 respectively.
Figure 4.13 The electrophoresis result of hsa-mir-7a-1, hsa-mir-7e, hsa-mir-100, hsa-mir-124a-2,
hsa-mir-92b and hsa-mir-132
The hsa-mir-7a-1 and hsa-mir-100 have the banding pattern after the electrophoresis as shown in the Figure 4.13. Therefore, we selected the nested PCR product of cervix hsa-mir-7a-1 and hsa-mir-100 to undertake the sequence analysis. The putative TSS of hsa-mir-7a-1 and hsa-mir-100 are in the upstream -2801bp and -1401 of their own miRNA precursor respectively (see Table 4.5).
Table 4.5 The PCR condition use of hsa-mir-7a-1, hsa-mir-7e, hsa-mir-100, hsa-mir-124a-2,
hsa-mir-92b and hsa-mir-132
lane1 lane2 lane3 lane4 lane5 lane6 lane7 ID 7a-1 7e 100 124a-2 92b 132 X
Outer Tm 60 59 60 60 58 59 X
Inner Tm 60 60 60 60 62 58 X
Tissue cervix cervix cervix brain brain brain X
Putative TSS -2801 -3901 -1401 -2278 -725 -1001 X Expected
Fifth, we choose the human intergenic miRNA hsa-mir-124a, hsa-mir-125b-1, hsa-mir-7f-1, hsa-mir-517b, hsa-mir-517c and hsa-mir-30d to check the predicted putative TSS. The hsa-mir-124a-1 is confused with hsa-mir-124a-2 in the Q-PCR expression profile and thus we do the second try of nested PCR on the hsa-mir-124a-1. It should be not confused the hsa-mir-517b to hsa-mir-517c, these two miRNA are similarity but could be distinguished in the Q-PCR profile. The top one Q-PCR expression level of the 18 tissues for hsa-mir-124a-1, hsa-mir-125b-1, hsa-mir-7f-1, hsa-mir-517b, hsa-mir-517c and hsa-mir-30d are 137×104, 3934×104, 167×104, 2052×104, 200×104and 235×104 copies per nano-gram respectively. As shown in the Figure 4.14, the hsa-mir-124a-1 from brain is in the lane1. The hsa-mir-125b-1 and hsa-mir-7f-1 from cervix are in the lane2 and lane3. The hsa-mir-517b, hsa-mir-517c and hsa-mir-30d from placenta are in the lane4, lane5 and lane6.
Figure 4.14 The electrophoresis result of hsa-mir-124a, hsa-mir-125b-1, hsa-mir-7f-1, hsa-mir-517b,
hsa-mir-517c and hsa-mir-30d
shown in the Figure 4.14. Therefore, we selected the nested PCR product of cervix hsa-mir-7f-1 and placenta hsa-mir-517c to undertake the sequence analysis. The putative TSS of hsa-mir-7f-1 and hsa-mir-517c are in the upstream -3404bp and -1801 of their own miRNA precursor respectively (see Table 4.6).
Table 4.6 The PCR condition use of hsa-mir-124a, hsa-mir-125b-1, hsa-mir-7f-1, hsa-mir-517b,
hsa-mir-517c and hsa-mir-30d
lane1 lane2 lane3 lane4 lane5 lane6 lane7
ID 124a-1 125b-1 7f-1 517b 517c 30d X
Outer Tm 60 61 59 60 60 60 X
Inner Tm 60 60 59 59 60 60 X
Tissue brain cervix cervix placenta placenta placenta X Putative TSS -5247 -1555 -3404 -1508 -1801 -4962 X
Expected
PCR product length 706 668 351 431 910 738 X
Sixth, we choose the human intergenic miRNA hsa-mir-9-2, hsa-mir-7a-2, hsa-mir-517a and hsa-mir-519e to check the predicted putative TSS. The top one Q-PCR expression level of the 18 tissues for hsa-mir-9-2, hsa-mir-7a-2, hsa-mir-517a and hsa-mir-519e are 929×104, 3827×104, 332×104 and 272×104 copies per nano-gramrespectively. As shown in the Figure 4.15, the hsa-mir-9-2 from brain is in the lane1 and hsa-mir-7a-2 from cervix is in the lane2. The hsa-mir-519a and hsa-mir-519e from placenta is in the lane3 and lane4.
Figure 4.15 The electrophoresis result of hsa-mir-9-2, hsa-mir-7a-2, hsa-mir-517a and hsa-mir-519e
The hsa-mir-519e has the banding pattern after the electrophoresis as shown in the Figure 4.15. Therefore, we selected the nested PCR product of placenta hsa-mir-519e to undertake the sequence analysis. The putative TSS of hsa-mir-519e is in the upstream -3915bp of hsa-mir-519e precursor (see Table 4.7).
Table 4.7 The PCR condition use of hsa-mir-9-2, hsa-mir-7a-2, hsa-mir-517a and hsa-mir-519e
lane1 lane2 lane3 lane4 lane5 lane6 lane7
ID 9-2 7a-2 517a 519e X X X
Outer Tm 60 59 60 60 X X X
Inner Tm 60 60 60 59 X X X
Tissue brain cervix placenta placenta X X X
Putative TSS -1429 -3801 -4001 -3915 X X X
Expected
Seventh, we choose the human intergenic miRNA hsa-mir-145, hsa-mir-222, hsa-mir-192, hsa-mir-223, hsa-mir-506 and hsa-mir-141 to check the predicted putative TSS. The hsa-mir-141 is interested because it has the extremely highly CAGE tag support though it is quite low expressed level. Therefore, we choose two putative TSS to undertake the nested PCR reaction. The top one Q-PCR expression level of the 18 tissues for hsa-mir-145, hsa-mir-222, hsa-mir-191, hsa-mir-223, hsa-mir-506, and hsa-mir-141 are 1846×104, 289×104, 102×104, 221×104, 139×104 and 13×104 copies per nano-gramrespectively. As shown in the Figure 4.16, the hsa-mir-145 from cervix is in the lane1 and hsa-mir-222 from brain is in the lane2 and hsa-mir-192 from kidney is in the lane3 and hsa-mir-223 from lung is in the lane4 and hsa-mir-506 from testes is in the lane5. The hsa-mir-141 with two putative TSS from placenta is in the lane3 and lane4.
Figure 4.16 The electrophoresis result of hsa-mir-145, hsa-mir-222, hsa-mir-192, hsa-mir-223,
The hsa-mir-145 and hsa-mir-506 has the banding pattern after the electrophoresis as shown in the Figure 4.16. Although the band of hsa-mir-506 is quite light, we selected the nested PCR product of cervix hsa-mir-145 and testes hsa-mir-506 to undertake the sequence analysis. The putative TSS of hsa-mir-145 and hsa-mir-506 is in the upstream -866bp and -1000 of their own miRNA precursor (see Table 4.8).
Table 4.8 The PCR condition use of hsa-mir-145, hsa-mir-222, hsa-mir-192, hsa-mir-223, hsa-mir-506,
hsa-mir-141-1 and hsa-mir-141-2
lane1 lane2 lane3 lane4 lane5 lane6 lane7
ID 145 222 192 223 506 141 141
Outer Tm 60 60 60 60 60 59 60
Inner Tm 60 61 59 60 60 59 59
Tissue cervix brain kidney lung testes placenta placenta Putative TSS -866 -5192 -3500 -5280 -1000 -3101 -1000
Expected
PCR product length 685 800 822 771 849 778 666
Finally, we choose the human intergenic miRNA hsa-mir-514-1, hsa-mir-514-2, hsa-mir-514-3, hsa-mir-92-2 and hsa-mir-106a to check the predicted putative TSS. The top one Q-PCR expression level of the 18 tissues for hsa-mir-514-1, hsa-mir-514-2, hsa-mir-514-3, hsa-mir-92-2 and hsa-mir-106a are 110×104, 110×104, 110×104, 503×104 and 115×104 copies per nano-gramrespectively. As shown in the Figure 4.17, the hsa-mir-514-1, hsa-mir-514-2 and hsa-mir-514-3 from cervix are in the lane1 to lane3. The hsa-mir-92-2 from cervix and hsa-mir-106a from kidney is in the lane3 and lane4.
Figure 4.17 The electrophoresis result of hsa-mir-514-1, hsa-mir-514-2, hsa-mir-514-3, hsa-mir-92-2
and hsa-mir-106a
The hsa-mir-541-2 and hsa-mir-514-3 has the banding pattern after the electrophoresis as shown in the Figure 4.17. We selected the nested PCR product of testes hsa-mir-514-2 and hsa-mir-514-3 to undertake the sequence analysis. The putative TSS of hsa-mir-514-2 and hsa-mir-514-3 is in the upstream -2805bp and -1601 of their own miRNA precursor (see Table 4.9).
Table 4.9 The PCR condition use of hsa-mir-514-1, hsa-mir-514-2, hsa-mir-514-3, hsa-mir-92-2 and
hsa-mir-106a
lane1 lane2 lane3 lane4 lane5 lane6 lane7
ID 514-1 514-2 514-3 92-2 106a X X
Outer Tm 58 58 57 58 60 X X
Inner Tm 57 58 57 58 60 X X
Tissue testes testes testes cervix kidney X X
Putative TSS -2817 -2805 -1601 -1670 -2401 X X
Expected
4.3.4 Sequencing PCR product
All nested PCR product get from section 4.3.3 were undertook sequencing process. The following 13 human intergenic miRNAs were sequenced: hsa-let-7a-1, hsa-let-7f-1, hsa-mir-30b, hsa-mir-145, hsa-mir-122a, hsa-mir-100, hsa-mir-519e, hsa-mir-517c, hsa-mir-130a, hsa-mir-506, hsa-mir-143, hsa-mir-514-2 and hsa-mir-514-3. In the above list, there are three nested PCR product with clear sequence result. That is, hsa-mir-145, hsa-mir-100 and hsa-mir-143. As shown in Figure 4.18, the sequencing result of hsa-mir-130a shows the good sequence pattern of nested PCR product and it is ready for sequence alignment analysis.
Figure 4.18 Hsa-mir-130a sequencing result
4.3.5 Blast sequenced result to genome to check the TSS position
three sequencing result with clear pattern. Hsa-mir-122a, hsa-mir-100 and hsa-mir-143 were undertook the sequence alignment analysis to realize the exactly position of transcriptional start site on human genome.
4.4 Web server
4.4.1 MIRPM overview
MIRPM aims to give a useful service for users who wants to study the transcriptional start site of known miRNA. MIRPM provide an integrated computational prediction of miRNA transcriptional start sites and clustering these predicted result to an experimental oriented result. As shown in the Figure 4.19, MIRPM use the upstream sequence of user interest miRNA to predicted TSS with Eponine, EP3, FirstEF, NNPP and Promoter 2.0. After that, we cluster all the putative TSS into putative TSS cluster. With annotating the information of CAGE tag, Solexa tag and evolutionary conservation, we can rank our putative TSS cluster and given a score. The highest order of putative TSS cluster could choose as the experiment candidate and all the primer for detect the putative TSS cluster are designed by Primier3. User could directly get the primer sequence for the PCR associated experiment.


![TraditionalMLCalgorithmsmainlytacklethebatchMLCproblem,wheretheinputdataarepresentedinabatch[24,28].Nevertheless,inmanyMLCapplicationssuchase-mailcategorization[22],multi-labelexamplesarriveasastream.Onlineanalysisistherefore dimensionreducermotivatedbyma](data:image/gif;base64,R0lGODlhAQABAIAAAP///wAAACH5BAEAAAAALAAAAAABAAEAAAICRAEAOw==)