Spatial distribution of cadmium over a cyclonic eddy in the
southern East China Sea
Shih-Chieh Hsu
a,*, Fei-Jan Lin
b, Woei-Lih Jeng
b, Tswen Yung Tang
b aInstitute of Earth Sciences, Academia Sinica, Taipei, Taiwan, ROC b
Institute of Oceanography, National Taiwan University, Taipei, Taiwan, ROC Received 9 September 2001; accepted 21 November 2002
Abstract
Eddy systems are a unique ecosystem, usually having high biological masses and primary production in the sea. In this study, both particulate and dissolved phases of cadmium in the water column of 15 stations over a cyclonic eddy in the southern East China Sea were determined to obtain their spatial distributions. This allows us to confirm that cyclonic eddy systems play the role of a Cd pump in the sea.
Results showed that particulate Cd (PCd) and dissolved Cd (DCd) concentrations in water varied greatly, ranging over two orders and one order of magnitude, respectively. Large spatial variability was found not only for PCd but also for DCd in the upper water, apparently due to the effects of the cyclonic eddy system on the Cd distributions over the study area. DCd accounts for about 99% of the total Cd. For the surface water, DCd concentration at the eddy center was about five times the average of the water surrounding the eddy center. The depth distributions of DCd exhibited a typical surface depletion and a subsequent increase with depth; however, the PCd distribution showed the opposite, i.e. a surface maximum and a subsequent decline with depth. In general, the DCd maxima were found at depths of 600 – 1000 m, agreeing well with the literature. It reflected the internal biogeochemical cycling of Cd in the water column, which was driven by the utilization of Cd by plankton in the euphotic zone and by the regeneration of Cd at depth. In addition, a remarkably high DCd concentration existed in near-bottom water around the cyclonic eddy center.
The horizontal distributions of both PCd and DCd in the upper water shared a common feature with elevated concentrations centering around the eddy center and a decline in concentration with distance from the eddy center. This shows that the cyclonic eddy could bring up the Cd-rich deep water to the surface water around the eddy center and could then expand toward eddy’s vicinity via advection – diffusion. It is thus likely that it produces ample biological masses over the eddy system. Hence, this work can demonstrate that the ascending nutrient-rich water driven by the cyclonic eddies can serve as an important source not only for many nutrients but also for Cd in the sea.
D 2003 Elsevier Science B.V. All rights reserved.
Keywords: Cadmium; Cyclonic eddy; East China Sea; Particulate phase; Dissolved phase
1. Introduction
Basically, the biogeochemical behavior of Cd in the water column is well known in most oceans 0924-7963/03/$ - see front matterD 2003 Elsevier Science B.V. All rights reserved.
doi:10.1016/S0924-7963(03)00028-9
* Corresponding author. Tel.: +886-2-27839910x252; fax: +886-2-27833584.
E-mail address: [email protected] (S.-C. Hsu).
(Bruland, 1980; Boyle et al., 1981; Danielsson et al., 1985; Kremling, 1985; Westerlund and Ohman, 1991; Saager et al., 1992; Nolting and De Baar, 1994; De Baar et al., 1994; Yeat et al., 1995). In principle, the dissolved Cd (DCd) is depleted in the surface water and then increases with depth, reach-ing a maximum at thermocline or about 1000 m. Its depth profiles resemble those of nutrients, especially phosphate. The biogeochemical cycling of Cd is closely linked to its removal by plankton in the surface water and subsequent regeneration from organic matter at depth. In the sea, the DCd always accounts for the majority of the total Cd, whereas the particulate Cd (PCd) accounts for little (Balls, 1985a; Westerlund and Ohman, 1991; Helmers, 1996).
In coastal oceans, cyclonic and anticyclonic eddies are commonly generated by the interaction between the main currents and topography as well as by wind stress (Robinson, 1983). The eddy systems can influence the deposition of sediments, primary production, and even exchange and interaction of water masses and nutrients in the oceans (The Ring Group, 1981; Simpson et al., 1984; Nelson et al., 1985; Wiebe and McDougall, 1986; Wolanski and Hamner, 1988; Hayward and Mantyla, 1990; Fal-kowski et al., 1991; Smith et al., 1996; Yilmaz and Tug˘rul, 1998). Cyclonic eddies may act as a nutrient pump to bring up nutrients from deep water into the euphotic zone (Hayward and Mantyla, 1990). The eddies may also accumulate suspended matter not only of biogenic materials (Nelson et al., 1985;
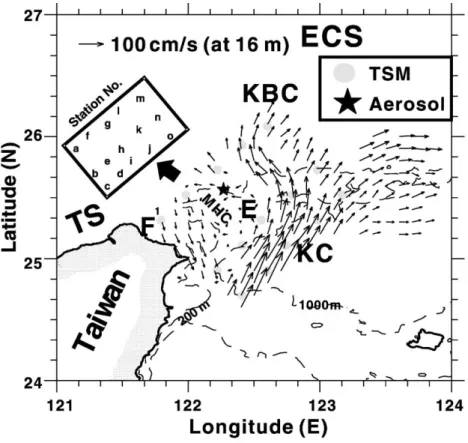
Fig. 1. Sampling locations represented by dotted circles and general circulation pattern over the study area, especially focused in summer season (from late-April to mid-October). It is modified fromHsu et al. (1998). The Kuroshio Current is designated as KC; the Kuroshio Branch Current, KBC; the cyclonic eddy, E; and the filament, F. The East China Sea is abbreviated to ECS; Taiwan Strait to TS. Noted that the eddy center is located somewhere around Sta. h. An upwelling may permanently occur somewhere at the shelf break around the Mein-hua Canyon (MHC), and it is probably induced by the eddy. An offshore island, Pengchiayu Island (shown as a star), is the collection station of marine aerosols. Bathymetric isopleths of 200 and 1000 m are shown as dashed lines on the map.
Bishop and Joyce, 1986) but also of lithogenic particles within these systems (Hsu et al., 1998). However, we have only few data available for trace metals and little understanding in their spatial dis-tributions in eddies (Sakamoto-Arnold et al., 1987; Bishop and Fleisher, 1987).
Depth profiles and horizontal patterns of DCd and PCd were obtained from seawater samples from a cyclonic eddy generated over the shelf break between the ECS shelf and the southern Okinawa Trough. These provided the first insight into the effects of the cyclonic eddy system on Cd concentrations and their complete spatial distributions, and could proved that the eddies could act as a pump not only for nutrients (Hayward and Mantyla, 1990)but also for Cd particularly in the marginal seas. In addition, the data for both particulate and dissolved Cd illustrated the biogeochemical behaviors and interactions of Cd in internal cycling in the water column.
2. Study area and its general circulation patterns The East China Sea is one of the largest marginal seas in the world. Available data for Cd, however, are very scarce for the region.Pai and Chen (1994)have obtained a Cd profile (located at 24j50VN, 123j10VE) down to 1500 m (bottom depth 1700 m) for the East China Sea, and have found its distribution similar to that for the Philippine Sea above 700 m and to that for the South China Sea below 700 m.
The principal picture for circulation pattern in the study area is displayed in Fig. 1. The Kuroshio Current (KC) flows northward along the eastern coast of Taiwan. When approaching northeastern Taiwan offshore, it collides with the shoaling shelf of the southern ECS; consequently, a variety of physical phenomena occur (Chern et al., 1990; Liu et al., 1992a; Hsueh et al., 1992; Tang and Yang, 1993). After collision, part of KC water intrudes onto the shelf forming a branch current, called the Kuroshio Branch Current (KBC). On the western side of the KBC, a cyclonic eddy of about 70 km in diameter is generated over the shelf-slope as a result of the west-erly deflection of part of the KBC. However, the KC may intrude a long way onto the shelf with the result that the eddy would disappear above 150 m in winter (Tang et al., 1999). An upwelling likely induced by
the eddy permanently takes place around Mien-hua Canyon (Tang et al., 1999; Hsueh, 2000), and it may introduce abundant nutrients that become the most important source of nutrients for the ECS (Chen, 1996a). The collision of the Kuroshio and the shelf thus producing a series of oceanic phenomena has made the study area one of the most dynamic loca-tions of mixing processes between the ECS and the Kuroshio.
3. Methods
3.1. Sampling strategies
Seawater samples (n = 96) were taken from the southern ECS off northeastern Taiwan during August 1994 on board National Taiwan University’s R/V Ocean Researcher I. Three parallel NE – SW transects crossing the shelf, slope and trough over the cyclonic eddy were designed for sampling; each transect con-tained five hydrographic stations (Fig. 1). Seawater was collected using 20-l GO-FLO PTFE-coated bot-tles on a CTD rosette, and was taken from the water column at varying depths. About 20 – 40 l of seawater was pressure-filtered through a cleaned, pre-weighed 142 mm – 0.4 Am Nuclepore polycarbonate filter using a Sartorius PTFE pressure filter holder and a MasterflexR wriggle pump. A liter filtrate was stored in acid-precleaned 1-l PP bottles (Nalgene), and acidified to pH < 2 with Suprapur HNO3(Merck) for subsequent analysis of dissolved trace metals in a land-based laboratory. Particulate-laden filters were stored in plastic petri dishes. Seawater and particulate samples were kept in a refrigerator and a desiccator, respectively, until analysis. Details of filtrating proce-dures have been given elsewhere (Hsu et al., 1998; Lin et al., 2000a).
3.2. Analyses
After drying and weighing, particulate-laden filters were processed by the total digestion method using an acid mixture of Suprapur HF, HNO3and HClO4(all from Merck). The filtrates were pre-concentrated by using Chelex-100 resin (100 – 200 mesh and ammo-nium form) columns after adjusting the pH to 6.5. The elution used 2 N HNO3 (Merck Suprapur). Resin
columns were pre-cleaned with 2 N Suprapur HNO3 and D.D.W. twice before use. The conditions of preconcentration mainly followed those of Pai and Chen (1994). The preconcentration was performed on a laminar flow clean bench (class 100). All containers used were acid-washed prior to use. Special care was taken at all times to prevent contamination of the samples.
Metal analysis was made with a Hitachi Z-8100 flameless atomic absorption spectrophotometer (graphite furnace) equipped with a Zeeman correc-tion system, and at least three replicate determina-tions were made for each sample. The quality of PCd determination was controlled by analysis of BCSS-1 standard reference samples. The accuracy and precision of Cd were 100 F 6% (Cd certified value of BCSS-1 is 0.25 F 0.04 Ag/g) and 4%
(n = 5), respectively. By spiking four very small volumes of known amounts of Cd (Cd standard from Merck) into 1 l of double purified seawater and subsequently by preconcentration, the recovery and precision of DCd under preconcentration treat-ments were also obtained to be 86 F 3% and 10% (n = 5), respectively, before field work. Readers are referred to the analytical details of Hsu et al. (1998) and Lin et al. (2000a).
4. Results
4.1. Temperature and salinity data
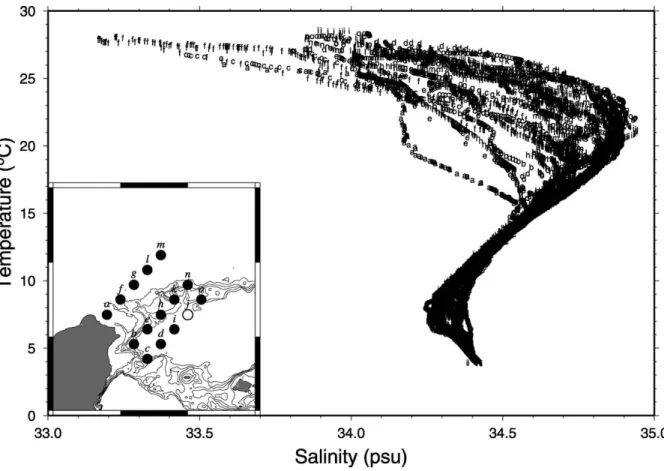
The temperature – salinity (T – S) diagram (Fig. 2) of all hydrographic stations studied was used to
Fig. 2. A temperature – salinity diagram of all hydrographic stations for TSM sampling. The salinity data from Sta. j (open circle) are questionable, likely due to instrumental malfunction, and are not included in this plot.
characterize several water masses in this study area. The T – S data and diagram would be useful for finding out the relationships of certain water masses and distributions of PCd and DCd concentrations.
According toTang et al. (1999), the T – S data could be divided into two principal categories. One is the KC main stream and KBC (such as Stas. d, i, j, k, l, m, n and o), and is characterized by high temper-ature and high salinity in the lower water. The other
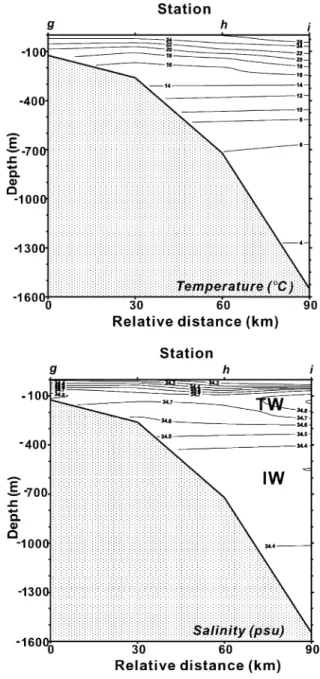
Fig. 3. Cross-sections of temperature and salinity along the slope transect (from Sta. b to Sta. n) crossing the eddy center (Sta. h). Two distinct water masses of the Kuroshio have been identified as the Kuroshio Tropical Water (TW) and the Kuroshio Intermediate Water (IW). The shelfward- and upward-isotherms and isohalines may indicate the occurrence of upwelling.
Fig. 4. As inFig. 3, but for the transect crossing the shelf, slope and trough.
Table 1
Concentrations of both particulate and dissolved Cd (PCd and DCd, respectively) in the water column at 15 stations over a cyclonic eddy in the southern East China Sea
Depth (m) T (jC) S (psu) TSM (mg/l) PCd (ng/l) DCd (ng/l) Sta. a 5 25.2 34.04 0.61 0.29 (0.47) 16 40 23.0 34.04 0.52 0.28 (0.53) 21 100 16.8 34.46 1.70 0.19 (0.11) 27 140 16.3 34.52 0.75 0.28 (0.38) 43 160 15.9 34.53 1.22 0.28 (0.23) 19 Sta. b 5 24.5 34.13 0.46 0.21 (0.45) 19 50 20.8 34.45 0.96 0.14 (0.15) 17 200 14.4 34.56 0.71 0.12 (0.17) 19 600 6.4 34.38 1.44 0.10 (0.07) 87 900 4.9 34.39 0.99 0.16 (0.16) 29 Sta. c 5 26.8 33.70 0.27 0.63 (2.33) 7 50 22.8 34.58 0.21 0.42 (1.98) 21 150 17.6 34.73 0.23 0.08 (0.36) 24 300 12.7 34.50 0.49 0.23 (0.47) 38 450 9.1 34.38 0.35 0.09 (0.26) 38 600 7.0 34.36 0.56 0.25 (0.44) 43 920 4.6 34.39 1.72 0.25 (0.14) 67 Sta. d 5 27.6 33.95 0.49 0.26 (0.53) 10 50 25.0 34.60 0.20 0.87 (4.32) 6 200 16.8 34.68 0.20 0.07 (0.35) 12 400 10.2 34.39 0.31 0.10 (0.31) 55 800 5.1 34.38 0.27 0.44 (1.64) 13a 1000 4.5 34.40 0.19 0.07 (0.37) 72 1300 4.0 34.41 0.30 0.17 (0.57) 56 1500 3.9 34.42 0.40 0.06 (0.16) 29 Sta. e 5 25.5 34.08 0.60 0.42 (0.69) 9 50 22.7 34.37 0.62 0.67 (1.08) 13 150 15.9 34.63 0.41 0.14 (0.35) 17 300 13.2 34.50 0.49 0.07 (0.14) 28 500 8.2 34.36 0.41 0.17 (0.41) 19 700 5.9 34.36 1.36 0.23 (0.17) 29 900 4.9 34.39 0.60 0.29 (0.48) 29 1020 4.6 34.40 0.38 0.06 (0.15) 33 Sta. f 5 24.7 34.33 0.32 0.52 (1.65) 7 40 23.4 34.42 0.39 0.26 (0.66) 7 80 18.2 34.74 0.20 0.03 (0.17) 11 110 17.9 34.73 0.19 0.11 (0.58) 10 Sta. g 5 24.9 34.27 0.41 0.42 (1.04) 6 40 23.1 34.55 0.18 0.08 (0.44) 4 80 20.5 34.82 0.22 0.03 (0.15) 4 120 19.0 34.80 0.20 0.22 (1.11) 5 Table 1 (continued ) Depth (m) T (jC) S (psu) TSM (mg/l) PCd (ng/l) DCd (ng/l) Sta. h 5 25.9 34.08 0.67 1.17 (1.76) 58 30 25.0 34.22 0.42 0.72 (1.72) 65 50 24.1 34.31 0.23 – 44 100 21.0 34.76 0.33 0.42 (1.26) 51 150 17.5 34.70 0.23 0.17 (0.76) 48 200 15.9 34.63 0.45 – 107a 300 12.7 34.48 0.29 0.10 (0.36) 38a 400 10.0 34.37 0.31 0.22 (0.73) 72 500 8.0 34.31 0.32 0.12 (0.38) 89 600 6.4 34.34 0.60 0.43 (0.72) 109 650 6.0 34.36 0.34 0.38 (1.14) 80 700 5.4 34.36 0.47 0.20 (0.41) 162 Sta. i 5 27.6 34.14 0.22 0.39 (1.79) 25 50 25.4 34.54 0.18 0.28 (1.58) 20 150 20.2 34.90 0.42 0.22 (0.52) 27 400 11.1 34.40 0.22 0.10 (0.46) 48 800 5.3 34.38 0.28 0.03 (0.12) 70 1200 4.1 34.41 0.26 0.27 (1.01) 62 1550 3.9 34.42 0.20 0.27 (1.37) 72 Sta. j 5 28.0 34.22 0.48 0.39 (0.82) 17 50 26.8 34.39 0.25 0.36 (1.43) 8 150 21.1 – 0.11 0.01 (0.03) 15 800 5.3 – 0.23 0.04 (0.17) 66 1200 4.1 34.40 0.40 0.05 (0.12) 55 1500 4.0 34.41 0.19 0.02 (0.13) 45 Sta. k 5 27.4 34.09 0.38 0.28 (0.75) 30 50 25.2 34.63 0.36 0.69 (1.89) 54 150 20.2 34.83 0.34 0.08 (0.25) 74 300 14.7 34.59 0.14 0.19 (1.35) 21a 500 8.0 34.31 0.25 0.33 (1.3) 110 750 5.4 34.37 0.31 0.22 (0.70) 117 860 4.9 34.39 0.30 0.07 (0.23) 72 Sta. l 5 26.7 34.16 0.27 0.51 (1.86) 13 40 24.1 34.66 0.27 0.59 (2.21) 5 70 21.8 34.88 0.18 0.09 (0.49) 8 100 19.6 34.82 0.19 0.21 (1.05) 91a Sta. m 5 26.2 34.21 0.46 0.44 (0.95) 14 30 25.6 34.36 0.33 0.55 (1.64) 23 50 24.6 34.64 0.24 0.29 (1.20) 21 80 21.3 34.78 0.23 0.08 (0.33) 33 100 19.9 34.82 0.30 0.08 (0.28) 33 Sta. n 5 27.8 33.97 0.28 0.15 (0.52) 8 50 25.2 34.60 0.15 0.14 (0.91) 14 150 20.6 34.89 – – 8
is those waters at stations near northeast Taiwan (such as Stas. a, b, c, e, f and g), and is charac-terized by low temperature and low salinity in the upper water. Profiles of temperature and salinity along the b – n (NE – SW direction) and g – i (NW – SE direction) sections crossing the eddy center (Sta. h) were also shown in Figs. 3 and 4. As seen in Figs. 3 and 4, the upwelling was evident as indi-cated by the shelfward- and upward-tilting isotherms and isohalines around the eddy center. Also, the upwelling was seen by the satellite infrared image of the sea-surface temperature taken on August 12, 1994; in this image, there is a small patch of low temperature water just located somewhere in the eddy (Tang et al., 1999; Hsueh, 2000). The flat isotherms and isohalines, however, demonstrate that stratifications are still strong particularly in summer (Chen et al., 1995). Based on the physical and chemical data of water,Chen et al. (1995)and Chen (1996a) have classified water masses of this study area into six types: the Kuroshio Surface Water (KSW), Kuroshio Tropical Water (TW), Kuroshio Intermediate Water (IW), East China Sea Water (ECSW), Coastal Water (CW) and the Taiwan Strait Water (TSW). The eddy water seems to be low in both temperature and salinity in the upper water. The water with the highest salinity (more than 34.6 psu) usually exists at depths between 100 and 300 m
(Figs. 3b and 4b), suggesting the TW. Beneath the TW, the water mass at depths of more than 400 m has a constant salinity of f 34.4 psu, suggesting the IW (Chen et al., 1995).
4.2. PCd and DCd data
Data of both PCd and DCd concentrations in the water column are given inTable 1. They ranged over two orders (for PCd) and one order (for DCd) of magnitude, respectively. It shows that both PCd and DCd were very variable and that the DCd usually accounted for almost all proportions (99% on average) of the total Cd (assumed to be equal to the sum of PCd and DCd) (Balls, 1985a; Westerlund and Ohman, 1991; Helmers, 1996).
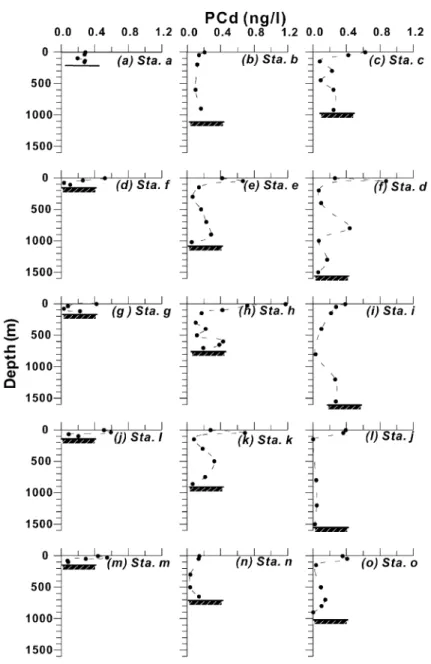
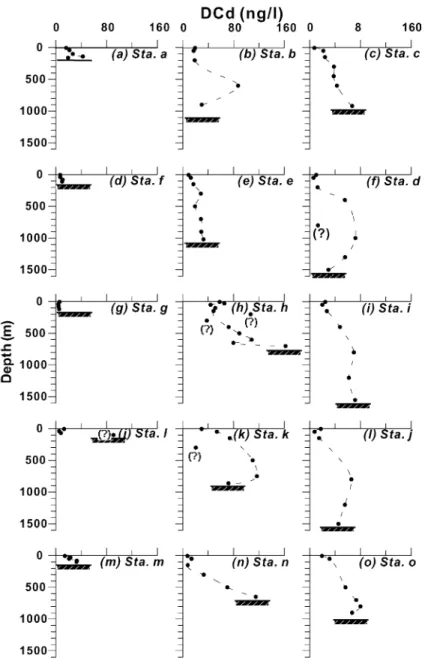
Depth profiles for PCd and DCd concentrations in the water column for each station are displayed inFigs. 5 and 6, respectively. It can be seen that in principle PCd and DCd exhibited opposite distributions. PCd maxima existed in the surface water (5 m) of most stations or in the subsurface water (30 – 50 m) of few stations (e.g. Stas. d, e and k), followed by decreases with depth (Fig. 5). In contrast to PCd, DCd minima existed in the surface water and then tended to increase with depth, reaching a maximum at depths of about 700 – 1000 m for stations of both the slope and trough transects (Fig. 6). Although some sampling intervals were large, the essential patterns were still seen in these profiles. Apparently, they had similar distribution patterns to those of labile nutrients of the same regions (Liu et al., 1992b; Pai and Chen, 1994). Among these stations, a relative minimum of DCd appeared occa-sionally at mid-depth of some stations such as at 800 m of Sta. d and at 300 m of Stas. h and k. It is not clear whether it was actually due to experimental biases or to other causes. The DCd maxima of about 70 – 120 ng/l (or 0.6 – 1.1 nM) at depths of 600 – 1000 m agreed well with those found in the Pacific(Bruland, 1980; Pai and Chen, 1994; De Baar et al., 1994). The largest DCd concentration (162 ng/l) was found at 700 m depth (bottom 720 m) beneath the eddy center.
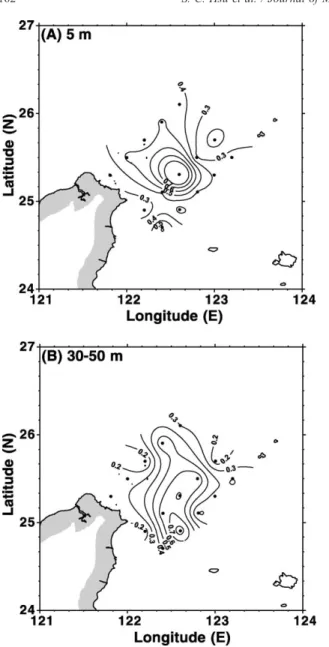
Horizontal distributions of both PCd and DCd concentrations in surface (5 m) and subsurface (30 – 50 m) water are shown inFigs. 7 and 8, respectively. Except for the PCd in the subsurface layer (Fig. 7B), the other three distribution patterns (the PCd in the surface layer and the DCd in both the surface and the Depth (m) T (jC) S (psu) TSM (mg/l) PCd (ng/l) DCd (ng/l) Sta. n 300 14.9 34.60 0.27 0.04 (0.15) 33 500 8.0 34.34 0.47 0.04 (0.08) 70 650 6.5 34.35 0.63 0.14 (0.23) 115 Sta. o 5 28.0 34.03 0.40 0.35 (0.88) 19 50 26.7 34.36 0.18 0.41 (2.30) 31 150 21.3 34.91 0.15 0.04 (0.26) – 500 8.9 34.29 0.24 0.10 (0.41) 56 700 6.0 34.34 0.23 0.15 (0.63) 73 800 5.4 34.37 0.23 0.10 (0.45) 80 900 4.9 34.38 0.66 0.01 (0.01) 67
Data of total suspended matter (TSM) concentrations, temperature (T) and salinity (S) are also given. Additionally, the PCd concentrations (Ag/g) of TSM are given in parentheses.
– : failure in sample treatments.
aQuestionable DCd data. These data were not included in calculations of the mean.
subsurface layers) of contour lines shared a similar shape with a maximum (1.20 ng/l for PCd in the surface layer and 58 and 65 ng/l for DCd in both the surface and subsurface layers, respectively) centering around the eddy center (Sta. h) and a decline with distance from the eddy center (Figs. 7A and 8A,B). The DCd concentrations in the upper water of the eddy center were several times higher than those
observed in many upwelling areas (Bruland, 1980; Boyle et al., 1981; Van der Loeff et al., 1997), and were close to those (>50 ng/l) observed in the Weddell Sea (Nurnberg et al., 1983).
Basically, the PCd distribution in the subsurface layer displayed a similar pattern to that in the surface layer, but the maximum shifted at Sta. d (Fig. 7b). Mean concentrations for both PCd and DCd in the Fig. 5. Vertical profiles of PCd (ng/l) in the water column of 15 stations occupied over a cyclonic eddy in the southern East China Sea.
upper water ( V 50 m) were 0.367 and 15 ng/l, respec-tively, compared to 0.115 and 39 ng/l in the deep water (>50 m), respectively. The DCd surface concentrations were close to those in the Changjiang Coastal Water ( f 10 ng/l)(Edmond et al., 1985; Elbaz-Poulichet et al., 1987) and in the North Sea ( f 15 ng/l) (Balls, 1985b; Nolting, 1986), and much higher than those of the open oceans (b10 ng/l in general).
5. Discussion
5.1. Cd cycling in the water column
The opposite depth distributions for both PCd and DCd concentrations suggest their gradual transforma-tion between each other throughout the water column. Generally speaking, the biogeochemical cycling of Cd Fig. 6. As inFig. 2, but for DCd (ng/l). The doubtful data points are marked by ‘?’.
is intimately related to organic matter in the seas (Bruland, 1980; Boyle et al., 1981; Westerlund and Ohman, 1991). Interactions and transformations between two phases of Cd in the water column are driven via uptake by plankton in the euphotic zone and release through regeneration of organic matter at depth; i.e. the internal processes control the vertical
distributions of Cd. Thus, it causes enrichment for PCd and depletion for DCd in the upper water; that always coincides with the growth depth of plankton (Sherrell and Boyle, 1992). The depth of euphotic zone in the study area is usually about 50 m. In addition, abrupt decreases of PCd with depth (Fig. 5) illustrated quick regeneration of Cd from biogenic matter-bound Cd back into ambient water.
Fig. 7. Horizontal distributions of PCd (ng/l) in (A) the surface water (5 m) and (B) the subsurface water (30 – 50 m) over a cyclonic eddy in the southern East China Sea.
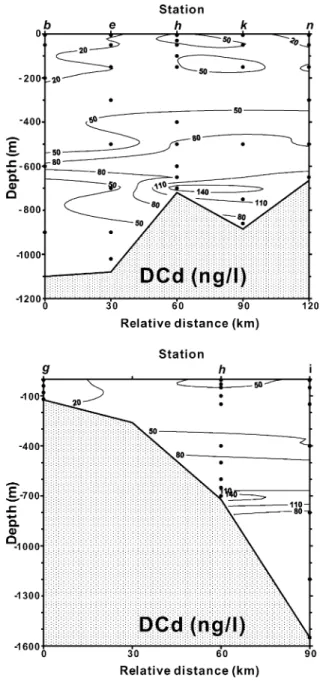
Basically, the DCd mid-depth (600 – 1000 m) max-ima in the study area are in good agreement with the observations of the Pacific (Bruland, 1980; Pai and Chen, 1994; De Baar et al., 1994). Profiles of PCd and DCd concentrations along the b – n (NE – SW shelf transect) and g – i (NW – SE shelf – slope – trough trans-ect) sections crossing the eddy center (h) shown in Fig. 9(PCd) andFig. 10(DCd) can further illustrate the PCd and DCd vertical distributions. Comparing Figs. 9 and 10withFigs. 3 and 4, it demonstrates that the TW water mass was always low in PCd and DCd. Additionally, the DCd mid-depth maximum occurred exactly at the depths of the IW, i.e. below 600 m there was a constant salinity of around 34.4 psu, as mentioned above. Based on our data, TW and IW water masses, two main water masses occupied the study area, have close PCd mean concentrations, 0.08 F 0.10 ng/l for TW and 0.12 F 0.12 ng/l for IW, respectively. Whereas for DCd, the mean concen-tration of the IW water mass is 58 F 32 ng/l, signifi-cantly higher than that of TW, 18 F 23 ng/l. The shallower DCd maxima at depths of 600 – 800 m, however, are likely related partly to uplifting of the Kuroshio water after collision onto the ECS shelf. This may reflect the unique situation for Cd distribu-tion in the study area.
A markedly high DCd concentration existing in near-bottom water beneath the eddy center (Figs. 6h and 10)probably results from the remineralization of high biogenic materials in early diagenesis on the slope, as suggested in a conceptual model proposed by Hsu et al. (1998). Lin et al. (2000b) have found high levels (larger than 0.6%) of organic carbon in the lower slope sediments of the study area, compared to the adjacent shelf sediments (less than 0.3%). Accord-ing to Gobeil et al. (1987), more than 80% of Cd associated with organic matter in sediments would release back into benthic water once these sediments were deposited. Thus, it would supply DCd and enhance DCd in the bottom water. On the other hand, a great deal of biogenic matter might be deposited beneath the eddy, especially the eddy center, and be likely to enhance the DCd source from regeneration or decomposition of organic matter because in the eddy systems abundant nutrients can generate large amounts of organisms in the euphotic zone(The Ring Group, 1981; Nelson et al., 1985; Hayward and Mantyla, 1990; Falkowski et al., 1991). The benthic
fluxes of DCd would become more important around the eddy center than any other locations. This scenario could explain why a high PCd was found around the eddy center in the upper water(Figs. 5h, 7 and 9)and a high DCd was found in the near-bottom water(Figs. 6h and 10).
Fig. 9. Cross-sections of PCd concentrations along two transects (one from Sta. b to Sta. n and one from Sta. g to Sta. i) crossing the eddy center (Sta. h).
5.2. Cd-rich water brought up by the cyclonic eddy The upwelling induced by the cyclonic eddies can bring up nutrient-rich bottom water to the surface (Hayward and Mantyla, 1990; Falkowski et al., 1991;
Yilmaz and Tug˘rul, 1998). It can also bring up the DCd-rich bottom water found around the eddy center, and then can cause DCd surface enrichment (Figs. 8 and 10) when compared to other marine environ-ments. The ascended DCd-rich water will be subjected to expansion toward the eddy’s vicinity and will decline (Figs. 8 and 10) via diffusion – advection processes. As a consequence of such upwelling, the ascended DCd-rich water is likely to enhance the primary production (up to 20 mg C m 3day 1,Chen et al., 2001) in the euphotic zone so that considerable amounts of biogenic matter have been found around the eddy center (Chen and Tang, 1994); hence, high biogenic masses may contribute to high PCd found around the eddy center (Figs. 7 and 9). Helmers (1996) has also found high PCd and DCd occurring in an upwelling region.
Coastal sources for Cd sometimes need to take into account when considering various sources of seawater Cd (Balls, 1985b; Kremling and Pohl, 1989). How-ever, the decreasing trend of DCd from the eddy center toward coastal areas (Figs. 8 and 10)reveals that the DCd coastal sources are obviously not sig-nificant here, even though the coastal water probably mixes with the river discharge in the study area(Liu et al., 1992a; Tang et al., 1999), resulting in high DCd. The present result differed from that of an anticyclonic warm-core ring in the Gulf Stream studied by Saka-moto-Arnold et al. (1987). They have found high DCd existing in shallower water of the ring, and suggested that the introduction of coastal water into the ring is responsible essentially for the DCd enrichment.
The upwelling rate nearby the eddy has been estimated to be about 2 – 4 m/day (Liu et al., 1992b; Chen et al., 1995; Chen, 1996b), so it can be assumed to be 3 m/day for the cyclonic eddy system. The representative DCd concentration in the end member of upwelled water is assumed to equal 90 ng/l averaged from all DCd data (n = 21) of 400 – 800 m at the six stations (Sta. h to Sta. o) occupied in Kuroshio area. Thus, the DCd input fluxes into the surface water contributed by the cyclonic eddy could be roughly estimated to be 0.27 mg/m2/day. On the other hand, from recent 2-year measurements made on a small island in this study region, an eolian deposi-tion flux of DCd has been estimated to be only 0.16 Ag/m2/day (Lin, unpublished data). The eolian inputs of Cd seem to be negligible to the DCd surface Fig. 10. As in Fig. 9, but for DCd concentrations. Three
questionable data of DCd concentrations from Stas. h and k shown inTable 1were omitted for drawing contour lines.
enrichments around the eddy center when compared to the upwelled fluxes. The upwelled intermediate Kuroshio water intruding upon the ECS shelf has been assessed to be the most crucial nutrient source of the ECS particularly in summer (Chen, 1996a), so the risen DCd-rich water is postulated to be the significant DCd source of the ECS, like nutrients.
Owing to large quantities of biogenic material settling out of the overlying water and being deposited beneath the eddy center, it might be rationally expected that high benthic DCd fluxes could be produced once biogenic matter decomposed. This would lead to an increase in the DCd concentrations of the bottom water (e.g. up to 162 ng/l at 700 m of Sta. h) although we had no available data of pore water DCd. Certainly, these processes would influ-ence the biogeochemical cycling of Cd in the sea. This is in accordance with a conceptual model, illustrating the cyclonic eddy’s effects on the distribution of lithogenic particles and likely on the internal cycling of trace metals, constructed byHsu et al. (1998).
6. Conclusions
Basically, PCd and DCd in the water column of the southern East China Sea showed typical oceano-graphic distributions. Higher levels of PCd and lower levels of DCd occur in the upper water, but, at depth, PCd decreases and DCd increases. However, the most striking result is that elevated concentrations not only for PCd but also for DCd appeared in the upper water around the eddy center. Certainly, the cyclonic eddies can bring up DCd-rich deep water into the upper layers. They thus become an important conveyor for transporting DCd from the deep water to the surface water in the sea, like a nutrient pump. They would also play a critical role in the biogeochemical cycling of Cd in the water column.
Acknowledgements
We are grateful to the three anonymous reviewers for their constructive comments. We thank the technicians and crew of R/V Ocean Researcher I for help with sampling. Thanks are also extended to Mr. K. Huang for pretreatment of samples. This work was
supported by National Science Council (R.O.C.) grants NSC 84-2611-M002A-007K2 and NSC 85-2611-M002A-026K2 to F.J.L. and NSC 85-2611-M-002A-019-K2 to T.Y.T.
References
Balls, P.W., 1985a. Trace metals in the northern North Sea. Mar. Pollut. Bull. 16, 203 – 207.
Balls, P.W., 1985b. Copper, lead and cadmium in coastal waters of the western North Sea. Mar. Chem. 15, 363 – 378.
Bishop, J.K.B., Fleisher, M.Q., 1987. Particulate manganese dy-namics in Gulf Stream warm-core rings and surrounding waters of the N.W. Atlantic. Geochim. Cosmochim. Acta 51, 2807 – 2825.
Bishop, J.K.B., Joyce, T.M., 1986. Spatial distributions and varia-bility of suspended particulate matter in warm-core ring 82B. Deep-Sea Res. 33, 1741 – 1760.
Boyle, E.A., Huested, S.S., Jones, S.P., 1981. On the distribution of copper, nickel and cadmium in the surface waters of the North Atlantic and North Pacific Ocean. J. Geophys. Res. 89, 8048 – 8066.
Bruland, K.W., 1980. Oceanographic distributions of cadmium, zinc, nickel, and copper in the north Pacific. Earth Planet. Sci. Lett. 47, 176 – 198.
Chen, C.T.A., 1996a. The Kuroshio intermediate water is the major source of nutrients on the East China Sea continental shelf. Oceanol. Acta 19, 523 – 527.
Chen, L.Y., 1996b. Model estimation of volume transport and ni-trate fluxes in the upwelling zone northeast of Taiwan. Master’s thesis, National Taiwan University. 69 pp. (in Chinese). Chen, M.S., Tang, T.Y., 1994. KEEP-II Data Bank Report: Cruise
OR 397 of R/V Ocean Researcher I, supported by National Science Council of Executive Yuan (R.O.C.). 168 pp. Chen, C.T.A., Ruo, R., Pai, S.C., Liu, C.T., Wong, G.T.F., 1995.
Exchange of water masses between the East China Sea and the Kuroshio off northeastern Taiwan. Cont. Shelf Res. 15, 19 – 39. Chen, Y.L., Chen, H.Y., Lee, W.H., Hung, C.C., Wong, G.T.F., Kanda, J., 2001. New production in the East China Sea, com-parison between well-mixed winter and stratified summer con-ditions. Cont. Shelf Res. 21, 751 – 764.
Chern, C.S., Wang, J., Wang, D.P., 1990. The exchange of Kuroshio and the East China Sea shelf water. J. Geophys. Res. 95, 16017 – 16023.
Danielsson, L.G., Magnusson, B., Westerlund, S., 1985. Cadmium, copper, iron, nickel and zinc in the northeast Atlantic Ocean. Mar. Chem. 17, 23 – 41.
De Baar, H.J.W., Saager, P.M., Nolting, R.F., Van der Meer, J., 1994. Cadmium versus phosphate in the world ocean. Mar. Chem. 46, 261 – 281.
Edmond, J.M., Spivack, A., Grant, B.C., Hu, M.H., Chen, Z., Chen, S., Zeng, X., 1985. Chemical dynamics of Changjiang estuary. Cont. Shelf Res. 4, 17 – 36.
Elbaz-Poulichet, F., Martin, J.M., Huang, W.W., Zhu, J.X., 1987. Dissolved Cd behavior in some selected French and Chinese
Estuaries. Consequences on Cd supply to the Ocean. Mar. Chem. 22, 125 – 136.
Falkowski, P.G., Ziemman, D., Kolber, Z., Bienfang, P.K., 1991. Role of eddy pumping in enhancing primary production in the ocean. Nature 352, 55 – 58.
Gobeil, C., Silverberg, N., Sundby, B., Cossa, D., 1987. Cadmium diagenesis in Laurentian trough sediments. Geochim. Cosmo-chim. Acta 51, 589 – 596.
Hayward, T.L., Mantyla, A.W., 1990. Physical, chemical and bio-logical structure of a coastal eddy near Cape Mendocino. J. Mar. Res. 48, 825 – 850.
Helmers, E., 1996. Trace metals in suspended particulate matter of Atlantic Ocean surface water (40jN to 20jS). Mar. Chem. 53, 51 – 67.
Hsu, S.C., Lin, F.J., Jeng, W.L., Tang, T.Y., 1998. The effect of a cyclonic eddy on the distribution of lithogenic particles in the southern East China Sea. J. Mar. Res. 56, 813 – 832.
Hsueh, Y., 2000. The Kuroshio in the East China Sea. J. Mar. Syst. 24, 131 – 139.
Hsueh, Y., Wang, J., Chern, C.S., 1992. The intrusion of the Kur-oshio across the continental shelf northeast of Taiwan. J. Geo-phys. Res. 97, 14323 – 14330.
Kremling, K., 1985. The distribution of cadmium, copper, nickel, manganese, and aluminum in surface waters of the open Atlantic and European shelf area. Deep-Sea Res. 32, 531 – 555. Kremling, K., Pohl, C., 1989. Studies on the spatial and seasonal
variability of dissolved cadmium, copper and nickel in North-east Atlantic surface waters. Mar. Chem. 27, 43 – 60. Lin, F.J., Hsu, S.C., Jeng, W.L., 2000a. Lead in the southern East
China Sea. Mar. Environ. Res. 49, 329 – 342.
Lin, S., Huang, K.M., Chen, S.K., 2000b. Organic carbon deposi-tion and its control in iron sulfide formadeposi-tion of the southern East China Sea continental shelf sediments. Cont. Shelf Res. 20, 619 – 635.
Liu, K.K., Gong, G.C., Shyu, C.Z., Pai, S.C., Wei, C.L., Chao, S.Y., 1992a. Response of Kuroshio upwelling to the onset of north-east monsoon in the sea north of Taiwan: observation and a numerical simulation. J. Geophys. Res. 97, 12511 – 12526. Liu, K.K., Gong, G.C., Lin, S., Yang, C.Y., Wei, C.L., Pai, S.C.,
Wu, C.K., 1992b. The year-round upwelling at the shelf break near the northern tip of Taiwan as evidenced by chemical hy-drography. Terres. Atmos. Ocean. Sci. 3, 243 – 276.
Nelson, D.M., Ducklow, H.W., Hitchcock, G.L., Brzezinski, M.A., 1985. Distribution and composition of biogenic particulate matter in a Gulf Stream warm-core ring. Deep-Sea Res. 32, 1347 – 1369.
Nolting, R.F., 1986. Copper, zinc, cadmium, nickel, iron and man-ganese in the southern bight of the North Sea. Mar. Pollut. Bull. 17, 113 – 117.
Nolting, R.F., De Baar, H.J.W., 1994. Behavior of nickel, copper, zinc and cadmium in the upper 300 m of a transect in the South-ern Ocean. Mar. Chem. 45, 225 – 242.
Nurnberg, H.W., Mart, L., Rutzel, H., Sipo, L., 1983. Investigation on the distribution of heavy metals in the Atlantic and Pacific Oceans. Chem. Geol. 40, 97 – 116.
Pai, S.C., Chen, H.Y., 1994. Vertical distribution of cadmium in marginal seas of the western Pacific Ocean. Mar. Chem. 47, 81 – 91.
Robinson, A.R., 1983. Overview and summary of eddy science. In: Robinson, A.R. (Ed.), Eddies in Marine Science. Springer, Berlin, pp. 3 – 15.
Saager, P.M., De Baar, H.J.W., Howland, R.J., 1992. Cd, Zn, Ni and Cu in the Indian Ocean. Deep-Sea Res. 39, 9 – 35.
Sakamoto-Arnold, C.M., Hanson Jr., A.K., Huizenga, D., Kester, D.R. 1987. Spatial and temporal variability of cadmium in Gulf Stream warm-core rings and associated waters. J. Mar. Res. 45, 201 – 230.
Sherrell, R.M., Boyle, E.A., 1992. The trace metal composition of suspended particles in the oceanic water column near Bermuda. Earth Planet. Sci. Lett. 111, 155 – 174.
Simpson, J.J., Koblinsky, C.J., Haury, L.R., Dickey, T.D., 1984. An offshore eddy in the California current system. Prog. Oceanogr. 13, 1 – 111.
Smith, C.L., Richards, K.J., Fasham, M.J.R., 1996. The impact of mesoscale eddies on plankton dynamics in the upper ocean. Deep-Sea Res. 43, 1807 – 1832.
Tang, T.Y., Yang, Y.J., 1993. Low frequency current variability on the shelf break northeast of Taiwan. J. Oceanogr. 49, 193 – 210. Tang, T.Y., Hsueh, Y., Yang, Y.J., Ma, J.C., 1999. Continental slope flow northeast of Taiwan. J. Phys. Oceanogr. 29, 1353 – 1362. The Ring Group, 1981. Gulf Stream cold-core rings: their physics,
chemistry, and biology. Science 212, 1091 – 1100.
Van der Loeff, M.R., Helmers, E., Kattner, G., 1997. Continuous transects of cadmium, copper, and aluminum in surface waters of the Atlantic Ocean, 50jN to 50jS: correspondence and con-trast with nutrient-like behavior. Geochim. Cosmochim. Acta 61, 47 – 61.
Westerlund, S., Ohman, P., 1991. Cadmium, copper, cobalt, nickel, lead, and zinc in the water column of the Weddell Sea, Antarc-tica. Geochim. Cosmochim. Acta 55, 2127 – 2146.
Wiebe, P.H., McDougall, T.J., 1986. Introduction to a collection of papers on warm-core rings. Deep-Sea Res. 33, 1455 – 1457. Wolanski, E., Hamner, W.M., 1988. Topographically controlled
fronts in the ocean and their biological influence. Science 241, 177 – 181.
Yeat, P.A., Westerlund, S., Flegal, A.R., 1995. Cadmium, copper and nickel distributions at four stations in the eastern central and south Atlantic. Mar. Chem. 49, 283 – 293.
Yilmaz, A., Tug˘rul, S., 1998. The effect of cold- and warm-core eddies on the distribution and stoichiometry of dissolved nu-trients in the northeastern Mediterranean. J. Mar. Syst. 16, 253 – 268.