X-ray Absorption Spectroscopic Studies on Light-Induced Excited
Spin State Trapping of an Fe(II) Complex
Jey-Jau Lee,†Hwo-shuenn Sheu,‡ Chi-Rung Lee,†Jin-Ming Chen,‡ Jyh-Fu Lee,‡ Chih-Chieh Wang,†Chun-Hsun Huang,† and Yu Wang*,†,‡
Contribution from the Department of Chemistry, National Taiwan UniVersity, Taipei, Taiwan, R.O.C., and the Synchrotron Radiation Research Center, Hsin Chu, Taiwan, R.O.C.
ReceiVed December 10, 1999
Abstract: Light-induced excited spin state trapping of Fe(phen)2(NCS)2 is studied by X-ray absorption
spectroscopy using synchrotron radiation. The molecular structure of the excited high-spin state at 17 K is investigated by EXAFS. The relaxation of the light-induced high-spin state at various temperatures is monitored through the absorption spectra. The concurrent abrupt lattice change with the change in electronic configuration is observed through single crystal X-ray diffraction. The lattice cooperative effect is important in the relaxation behavior. The magnetic property and the relaxation behavior of two differently prepared samples are distinctly different.
Introduction
The interesting spin-crossover phenomenon,5T
2, S ) 2 (high
spin, HS) T 1A
1, S ) 0 (low spin, LS) of the molecular
complex, FeII(phen)
2(NCS)2, has been extensively studied over
the past 30 years by various techniques. Magnetic susceptibility clearly showed an abrupt spin transition at 176 K1,2 and the
molar heat capacity, Cp, yielded a big peak at 176 K3as well.
Electronic spectral analysis in the region characteristic of the d-d transition indicated an increase in the ligand field parameter-(10 Dq) of 0.55 eV from a high-spin quintet state to a low-spin singlet state transition.2Single-crystal X-ray diffraction
mea-surements at two temperatures (293,130 K)4,5showed a decrease
in the Fe-N distance of 0.2 and 0.1 Å, respectively, for the Fe-Nphenand Fe-NNCSbonds as well as changes in∠N-Fe-N
angles, leading to a more regular octahedral shape at low temperature. Such a contraction of the first coordination shell was also detected in EXAFS analysis.6Furthermore, the spin
transition of FeII was carefully monitored by Mo¨ssbauer
measurements,7and the X- ray absorption spectra of the iron K
and LII, IIIedges of this complex show significant modifications
during the spin transition.6,8,9A shift of 1.44 and 0.5 eV in L III
and LIIabsorption edge toward high energies was detected on
going from 300 (HS) to 77 K (LS).8,9 Recent crystal field
multiplet calculations10 could actually well reproduce the
experimental spectra.
Evidence of the light-induced excited spin state trapping (LIESST)11-14 in this complex was found in Mo¨ssbauer
spectroscopy12,13and in FTIR spectroscopy.14The trapping of
the metastable HS state was detected at temperatures below 55 K after the sample was irradiated with a xenon lamp and appropriate filter12or He/Ne laser.14
The K-edge absorption at the near-edge range (XANES) is known to be sensitive to the coordination symmetry and the oxidation state of the target atom. The preedge peak was recently found15 to be rich in information about the electron density
distribution on 3d orbitals. The distinct change in K-edge absorption spectra of Fe(phen)2(NCS)2during the spin transition
was observed.8,9 The L-edge absorption spectroscopy is very
sensitive to the electronic changes of the target atom, especially the changes involving the modification on the 3d orbital populations such as the spin-crossover phenomenon. Therefore, the soft X-ray absorption spectroscopies (K- and L-edge) are ideal for the study of LIESST in this iron(II) complex. The earlier report of the HS/LS K- and LII,III-edge absorption
spectra4,8,9above and below the transition temperature gives a
solid base for this investigation. This work presents the first example of applying the K-, L-edge absorption technique to examine the LIESST phenomenon. Although the K-edge absorption spectrum, is not as sensitive to the variation of 3d orbital population as the L-edge absorption spectrum, it does reflect the changes of the population of the antibonding orbital of Fe-N due to the spin transition of the FeIIion.
The mechanism of such discontinuous thermal- and light-induced spin transitions of FeII complexes has drawn wide
attention, especially after the Mo¨ssbauer technique was
intro-†National Taiwan University.
‡Synchrotron Radiation Research Center.
(1) Ko¨nig, E.; Madeja, K. Chem. Commun. 1966, 3, 61. (2) Ko¨nig, E.; Madeja, K. Inorg. Chem. 1967, 6, 48. (3) Sorai, M.; Seki, S. J. Phys. Chem. Solids 1974, 35, 555.
(4) Gallois, B.; Real, J.-A.; Hauw, C.; Zarembowitch, J. Inorg. Chem.
1990, 29, 1152.
(5) Real, J.-A.; Gallois, B.; Granier, T.; Franz, S.-P.; Zarembowitch, J.
Inorg. Chem. 1992, 31, 4972.
(6) Cartier, C.; Thuery, P.; Verdaguer, M.; Zarembowitch, J.; Micha-lowicz, A. J. Phys. C8, 1986, 47, 563.
(7) Goodwin, H. A. Coord. Chem. ReV. 1976, 18, 293.
(8) Cartier dit Moulin, C.; Sainctavit, P.; Briois, V. In Proceedings of
the SeVenth International Conference on X-Ray Absorption Fine Structure,
Kobe, Japan, 1992. Jpn. J. Appl. Phys. 1993, 32, 38.
(9) Cartier dit Moulin, C.; Rudolf, P.; Flank, A.-M.; Chen, C. T. J. Phys.
Chem. 1992, 96, 6196.
(10) Briois, V.; Cartier dit Moulin, C.; Sainctavit, P.; Brouder, C.; Flank, A.-M. J. Am. Chem. Soc. 1995, 117, 1019.
(11) Decurtins, S.; Gu¨tlich, P.; Ko¨hler, C. P.; Spiering, H. Chem. Phys.
Lett. 1984, 105, 1.
(12) Decurtins, S.; Gu¨tlich, P.; Ko¨hler, C. P.; Spiering, H. J. Chem. Soc.,
Chem. Commun. 1985, 340.
(13) Decurtins, S.; Gu¨tlich, P.; Hasselbach, K. M.; Hauser, A.; Spiering, H. Inorg. Chem. 1985, 24, 2174.
(14) Herber, R.; Casson, L. M. Inorg. Chem. 1986, 25, 847.
(15) Westre, T.E.; Kennepohl, P.; DeWitt, J. G.; Hedman, B.; Hodgson, K. O.; Solomon, E. I. J. Am. Chem. Soc. 1997, 119, 6297.
10.1021/ja9943290 CCC: $19.00 © 2000 American Chemical Society Published on Web 06/01/2000
Downloaded by NATIONAL TAIWAN UNIV on August 25, 2009 | http://pubs.acs.org
duced. A couple of excellent reviews16,17on this topic give a
thorough discussion of all possible models. A pulse laser photolysis study on the relaxation of a polymer-doped high-spin FeII complex18 indicates the relevance of a quantum
mechanical tunneling mechanism at temperatures below 120 K. The LIESST phenomenon in the crystalline state is believed to be associated with the elastic interactions and lattice coopera-tivity.16-19 The lattice defects and lattice anisotropy are also
considered19-21for such a phenomenon. The HS-LS relaxation
kinetics after laser excitation in a series of iron(II) complexes was carefully studied by Hauser et al.,19,22-26who proposed a
thermally activated relaxation behavior or a nonadiabatic tunneling at elevated temperatures and a nearly temperature independent quantum mechanical tunneling mechanism at low temperatures (<100 K). The intersystem crossings between singlets, triplets, and quintets as well as the reverse-LIESST are well illustrated in the case of [Fe(ptz)6](BF4)2.17,22,27A study
on [Fe0.35Ni0.65(mtz)6](ClO4)2shows that there are two transition
states (220, 120 K), each giving very different relaxation behavior.28The detailed mechanism for the spin transition and
LIESST is still not completely clear and may be worth some more effort; the XAS should be a very useful tool for this purpose.
Experimental Section
The iron complex is prepared according to the literature.4,29L II,III
-edge absorption spectra are measured on the high-energy spherical grating monochromator (HSGM) beam line of SRRC. The spectra are recorded by the total electron yield mode using a microchannel plate (MCP) detector. The schematic experimental setup of the instrument is illustrated in Figure 1. The photon energy is calibrated using 708.5 eV for the peak of LIIIline of R-Fe2O3; the entrance and exit slits are
set at 30× 30 um corresponding to an energy resolution of 0.25 eV at
∼700 eV range. XANES and EXAFS spectra are measured on the 1.8T/
25 pole wiggler beam line using fluorescence mode with a 6-µm metal
mesh made out of Mn. The resolving power of∆E/E is up to 1/7000
(operational energy of 1.5 GeV, 100-200 mA). The Si(111) double crystal is employed as the monochromator. The energy calibration is made on the basis of the E0of iron foil at 7112 eV. An APD unit is
used to control the temperature; the sample is pressed on a In foil to ensure the good thermal conductivity. The pressure of the measuring chamber is at∼10-9and 10-3Torr for L-edge and K-edge absorption, respectively.
Light-induced excitation is undertaken by a He/Ne laser or a Xe arc lamp with the proper filter. The excitation normally takes place in a few minutes. The light is then turned off before making the scan of the spectra.
The EXAFS oscillation function k3χ(k) was obtained by a standard
analysis procedure30,31 using the UWXAFS code (including
AUTOBK,32-34 ATOMS,35 FEEE,36,37 and FEFFIT32,38 programs):
preedge baseline and postedge background subtractions are applied by a linear and by a spline function, respectively. The analysis of the first coordination shell of iron (Fe-N6) is regarded as a single scattering
path, and only the first shell contribution is considered in this work. The iron atom is at the C2 symmetry site, and the starting point of
Fe-N bond lengths is based on the single-crystal diffraction (XRD) data at room temperature29and at 20 K for HS-1 and LS-1, respectively.
Single-crystal diffraction data at 20 K is taken at the X3A1 beam line of NSLS at BNL, using a wavelength of 0.642 Å. A total of 7433 reflections are collected on IP. Intensity integration and scale are based on the DENZO and the SCALE programs of the HKL package;39for
the data analyses and structure solution the NRCSDP program are used.40
FTIR spectra are taken on a Bomem spectrometer using KBr tablets; the sample temperature is controlled by an APD unit. The magnetic measurement is made on a SQUID magnetometer in the temperature range of 5-300 K.
Results and Discussion
Thermally Induced Spin Transition. Variation of the magnetic moments,µeff, with temperature for the iron compound
is shown in Figure 2, which reconfirms the abrupt spin crossover at 176 K. Figure 2 also confirms the previously observed41clear
difference between the two samples prepared by high-temper-ature extraction41,4and by diffusion.29The extraction sample
undergoes a complete spin transition from 5T
2to 1A1, while
the diffusion sample displays some residual magnetic moment
(∼1.8 µB.) at temperatures below 176 K. However, the single
crystal can only be obtained by the diffusion method. The spin-crossover phenomenon is not accompanied by a crystal structural phase change in this case. Both HS and LS state molecules are crystallized in the same space group, Pbcn; however, the lattice (16) Gu¨tlich, P.; Hauser, A.; Spiering, H. Angew Chem., Int. Ed. Engl.
1994, 33, 2024-2054.
(17) Gu¨tlich, P.; Hauser, A. Coord. Chem. ReV. 1990, 97, 1. (18) Xie, C.-L.; Hendrickson, D. N. J. Am. Chem. Soc. 1987, 109, 6981. (19) Hauser, A.; Gu¨tlich, P.; Spiering, H. Inorg. Chem. 1986, 25, 4245. (20) Spiering, H.; Willenbacher, N. J. Phys: Condens. Matter 1989, 1, 10089.
(21) Granier, T.; Gallois, B.; Gaultier, J.; Real, J.-A.; Zarembowitch, J.
Inorg. Chem. 1993, 32, 5305.
(22) Hauser, A. Coord. Chem. ReV. 1991, 111, 275.
(23) Hauser, A.; Vef, A.; Adler, P. J. Chem. Phys. 1991, 95, 8710. (24) Hauser, A. J. Chem. Phys. 1991, 94, 2741.
(25) Hauser, A. Chem. Phys. Lett. 1992, 192, 65.
(26) Hauser, A.; Adler, J.; Gu¨tlich, P. Chem. Phys. Lett. 1988, 152, 468. (27) Hauser, A. Chem. Phys. Lett. 1986, 124, 543.
(28) Buchen, T.; Schollmeyer, D.; Gu¨tlich, P. Inorg. Chem. 1996, 35, 155.
(29) Schilt, A. A.; Fritsch, K. J. Inorg. Nucl. Chem. 1966, 28, 2677. (30) Sayers, D. E.; Bunker, B. A. X-Ray Absorption: Principles,
Applications, Techniques of EXAFS, SEXAFS and XANES; Koningsberger,
D. C., Prins, R., Eds.; John Wiley & Sons: NewYork, 1988; p 211.
(31) Asakura, A. X-Ray Absorption Fine Structure for Catalysts and
Surface; Iwasawa, Y., Ed.; World Scientific: Singapore, 1996; p 34.
(32) Newville, M. Ph.D. Thesis, 1997.
(33) Newville, M.; Livins, P.; Yacoby, Y.; Rehr, J. J.; Stern, E. A. Phys.
ReV. B 1993, 47, 14126.
(34) Newville, M. AUTOBK document, 1995. (35) Ravel, B. ATOMS document, 1995.
(36) Zabinsky, S. I.; Rehr, J. J.; Ankudinov, A.; Albers, R. C.; Eller, M.
J. Phys. ReV. B 1995, 52, 2995.
(37) Ankudinov, A. FEFF601 document, 1995. (38) Newville, N. FEFFIT document, 1996.
(39) Otwinowsky, Z.; Minor, W. Methods Enzymol. 1997, 276, 307. (40) Gabe, E. J.; Le Page, Y.; Charland, J.-P.; Lee, F. L.; White, P. S.
J. Appl. Crystallogr. 1989, 22, 384.
(41) Ganguli, P.; Gu¨tlich, P.; Mu¨ller, E. W. J. Chem. Soc., Dalton Trans.
1981, 441.
Figure 1. Schematic drawing of the experimental setup for L-edge absorption.
Excited Spin State Trapping of an Fe(II) Complex J. Am. Chem. Soc., Vol. 122, No. 24, 2000 5743
Downloaded by NATIONAL TAIWAN UNIV on August 25, 2009 | http://pubs.acs.org
contracts anisotropically and the Fe-N bond shortens signifi-cantly from the HS to the LS state. The results are listed in Table 1. To investigate the change in structure near the transition temperature, a diffraction pattern out of a certain orientation is monitored through an image plate detector. A selected group of reflections out of one frame at various temperatures near 176 K is carefully studied; the observation of the drastic change in d spacing within a few kelvin implies that even the lattice change (diffraction pattern) during the spin transition is as abrupt as the change in magnetic moment. The lattice parameters deter-minated in the temperature range of 140-190 K based on the refinement of 150 reflections out of this frame indicate that the abrupt change in pattern is due mainly to the change in “a” dimension, which can be manifested by the distinct shift in diffraction position of high “h” reflections. The thermally induced spin transitions of both the extraction and the diffusion samples are reconfirmed by FTIR and K- and L- edge X-ray absorption spectra. The results for the extraction samples are shown in Figures 3a, 4a, and 5a, respectively. The ones from the diffusion sample are basically the same as those for the extraction sample, except in the case of the LS state of FTIR,
where a small residual peaks of the HS state is observed. This is consistent with the magnetic measurement.
LIESST and Electronic Configuration of HS-2. LIESST in this FeII complex is investigated by FTIR at 6 K using a 5
mW He/Ne laser. The sample pressed in a KBr tablet is exposed to the light source for only a few minutes before complete excitation from the LS to the HS state has taken place. To differentiate this light-induced excited HS state from the thermally induced HS state, we designate the light-induced one HS-2 and the thermally induced one HS-1 after the convention in the literature.14This HS-2 state in the solid is stable for at
Figure 2. Temperature-dependent effective magnetic moment (µeff) measurement of Fe(phen)2(NCS)2 prepared by extraction (9) and
diffusion (0)methods.
Table 1. Lattice Parameters and Fe-N Distances of the HS-1, LS-1, and HS-2 States Based on Single-Crystal Diffraction Data (XRD) and EXAFS Data
P bcn HS-1 (300 K) HS-2 LS-1 (20 K) lattice param (Å)
a 13.146(2) 12.510(2)
b 10.129(4) 9.959(3)
c 17.453(6) 16.949(5)
XRD EXAFS EXAFS XRD EXAFS
T (K) 300 300 17 20 17
Fe-N(phen)(Å) 2.214(8) 2.190(5) 2.12(1) 1.967(3) 1.985(5)
Fe-N(phen)(Å) 2.194(8) 2.132(5) 2.06(1) 1.962(2) 1.979(5)
Fe-N(NCS)(Å) 2.070(9) 2.115(5) 2.04(1) 1.925(3) 1.943(5)
Figure 3. C-N streching frequency,υC-N, of (a) HS-1/LS-1 and (b) HS-2/LS-2 for the extraction sample.
Figure 4. XANES spectra of (a) HS-1/LS-1 and (b) HS-2/LS-2 for the extraction sample.
Downloaded by NATIONAL TAIWAN UNIV on August 25, 2009 | http://pubs.acs.org
least 10 h at 17 K during the measurement. The C-N stretching frequency,νC-N, of HS-2 is shown in Figure 3b. In the case of
iron K- and L-edge absorption, we have performed the experi-ment at 17 K using the Xe arc lamp with a red light filter (650 ( 20 nm); the exposure time is ∼25 min. Again the excitation is complete, trapping of the HS-2 state occurs as expected. The spectra are displayed in Figures 4b and 5b, respectively. A recent report42claimed that the soft X-ray around 700 eV could induce
excitation from the LS to the HS state at∼45 K. However, we have not observed such excitation during our experiments, although the white light of the synchrotron radiation does cause some excitation effect and/or damage on the sample when the temperature is∼50 K.
It would be interesting to know the exact electronic config-uration and the geometry of the HS-2 state. It is also important to see whether they are the same as those of HS-1. It was mentioned14that there is a blue shift of 4-6 cm-1inν
CNfrom
HS-1 to HS-2. A small difference in chemical shift (0.2 mm s-1) and in quadrupole splitting (0.24 mm s-1) was also reported by means of Mo¨ssbauer spectra.12The blue shift inν
CNfrom
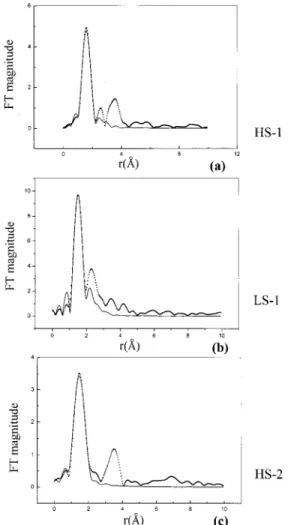
our observation seems insignificant (∼1 cm-1) both for the extraction and for the diffusion sample. However, the difference between the HS-2 and the HS-1 states is detected in XANES and EXAFS spectra. In fact, Fe-N distances are determined by EXAFS for HS-1, LS-1, and HS-2; the fitting of the first coordination sphere of Fe-N6 is displayed in Figure 6. The
distances are listed in Table 1 together with the distances obtained from single-crystal X-ray diffraction.29 The Fe-N
distances of HS-1 and LS-1 obtained from EXAFS are not significantly different from those obtained from diffraction data. According to the EXAFS data, Fe-to-N distances of the HS-2 state are slightly shorter than those of HS-1, but significantly longer than those of the LS-1 state after the temperature effect is taken into account. The difference in the L-edge absorption between HS-2 and HS-1 is mainly due to the temperature effect
based on the crystal field multiplet simulation. LS-2 and LS-1 states are basically the same from our observation.
The crystal field multiplet simulation, assuming an Oh symmetry at the Fe atom, gives rise to a 10 Dq value of 0.9 and 2.2 eV, respectively, for HS-1 and LS-1; the addition of a metal-to-ligand charge transfer (MLCT) factor is important for fitting of some fine details of peak profile, which was not considered in the earlier report.10The detail comparisons of the
measured and calculated curves with and without MLCT are displayed in Figure 7.
On the basis of all the observations, we may conclude that the electronic configuration of 2 is the same as that of HS-1; however, the geometry of HS-2 is slightly different from that of HS-1 with the volume of HS-2 being slightly smaller.
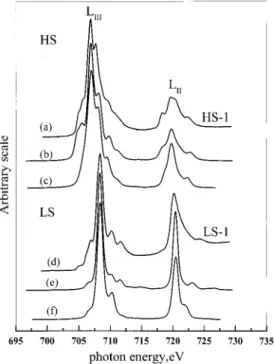
Thermal Relaxation of HS-2. The thermal relaxation from the metastable HS-2 state to the LS-2 state at 57 K is illustrated in Figure 8, where a series of iron L-edge absorption spectra is monitored at various time periods after the light-induced excitation has taken place. The typical spectra of the HS-1 and LS-1 states are also included to illustrate the change. It clearly depicts the change of spectra from a mainly HS state at 180 s after the excitation to a typical LS state at∼4000 s.
To clarify the thermally driven conversion of the metastable HS state (HS-2) to LS state (LS-2) process, the fraction of the HS species (γHS) is plotted as a function of time (after the
excitation light source is turned off) in the temperature range of 49-65 K; the plots are given in Figure 9, based on iron (42) Collision, D.; Garner, C. D.; McGrath, C. M.; Mosselmans, J. F.
W.; Roper, M. D.; Seddon, J. M. W.; Sinn, E.; Young, N. A. J. Chem.
Soc., Dalton Trans., 1997, 4371.
Figure 5. Iron LII,III-absorption edge of (a, bottom) HS-1/LS-1 (17
K) and (b, top) HS-2 (17 K)/LS-2 (70 K) for the extraction sample.
Figure 6. Fourier transforms of the experimental EXAFS spectrum (‚‚‚) and FEFF ab initio model (s) on the first shell of coordination of iron (Fe-N6) for (a) HS-1 (300 K), (b) LS-1 (17 K), and (c) HS-2 (17
K) state.
Excited Spin State Trapping of an Fe(II) Complex J. Am. Chem. Soc., Vol. 122, No. 24, 2000 5745
Downloaded by NATIONAL TAIWAN UNIV on August 25, 2009 | http://pubs.acs.org
L-edge absorption spectra. There are two diagrams in Figure 9, for the extraction sample (a) and for the diffusion sample (b). It is quite clear that the relaxation rate of the diffusion sample is significantly faster than that of the extraction sample at the same temperature. For example, at 55 K, it takes∼42 min to be half-relaxed (γHS) 0.5) for the extraction sample, but only ∼20 min for the diffusion sample. Similar observations are also obtained with K-edge absorption spectra. These observations of the differences in relaxation behavior and in the magnetic measurement from two differently prepared samples is in accord with the theory of elasticity, where the HS or LS molecules are considered to be defects in the crystal lattice.24Thus, the quality
of the crystalline material does play a role in the relaxation process. These relaxation curves are sigmoidal, which means
the relaxation behavior for the complex is not that of an isolated molecule; some cooperative interactions must be included. The model was established for a pure, nondoped [Fe(ptz)6](BF4)2
spin-crossover complex.25It has been shown that the acceleration
in relaxation is due to the buildup of an internal pressure (“lattice pressure”) with increasing LS fraction, γLS. Hauser25showed
that the relaxation rate is a function of this lattice pressure and thus is a function of the LS fraction,γLS. The relaxation curve
can be fitted according to the following equations,22,24-27,43
where kHL(γLS,T) is a rate constant for HS f LS conversion,
which is not only a function of temperature, T, but also a function of the LS fraction,γLS. kHL(γLS,T) represents a
self-acceleration of HS f LS relaxation with increasing γLS
(cooperative effect) as indicated in eq 2, Ea is the activation
energy associated with the HS f LS relaxation, and aHLis the
preexponential factor. In the temperature range studied, the relaxation behavior can be analyzed using eqs 1 and 2. The fitting parameters based on the Fe L-edge absorption experiment are summarized in Table 2. The fitted curves are shown in (43) Le´tard, J.-F.; Guionneau, P.; Rabardel, L.; Howard, J. A. K.; Goeta, A. E.; Chasseau, D.; Kahn, O. Inorg. Chem. 1998, 37, 4432.
Figure 7. Experimental and calculated Fe LII,III-edge absorption:
measured spectra at (a) 298 and (d)17 K; (b, e) calculated spectra including MLCT; (c, f) calculated spectra without MLCT.
Figure 8. Thermal relaxation of HS-2 at 57 K based on the L-edge absorption spectra. Typical spectra of HS-2 at 17 K and of LS-2 at 70 K are included as dotted curves.
Figure 9. HS f LS relaxation curves at various temperatures based on the L-edge absorption spectra after irradiation on (a) the extraction sample and (b) the diffusion sample. Solid lines are from eq 2.
dγLS/dt ) kHL(γLS,T)(1 -γLS) (1)
kHL(γLS,T) ) kHL(T) exp[R(T)γLS] (2)
kHL(T) ) aHLexp(-Ea/kBT) (3)
Downloaded by NATIONAL TAIWAN UNIV on August 25, 2009 | http://pubs.acs.org
Figure 9 as solid lines. Thus, the data of this complex can be understood in terms of a γLS-dependent, self-acceleration
process.
According to the theory of nonadiabatic multiphonon relax-ation, the temperature independent tunneling rate constant, kHL0 , is a function of the Huang-Rhys factor S and the reduced energy gap p. S is related to the equilibrium internuclear displacement∆Q of the HS and LS states,
p is related to the energy gap, ∆ΕHL0 ,between the lowest vibronic levels of the HS and the LS states according to
whereω is the frequency of the breathing vibration of the FeN6
core,∆rHLis the difference in Fe-N bond length between the
HS state and the LS state, and f is the force constant of the Fe-N bond.
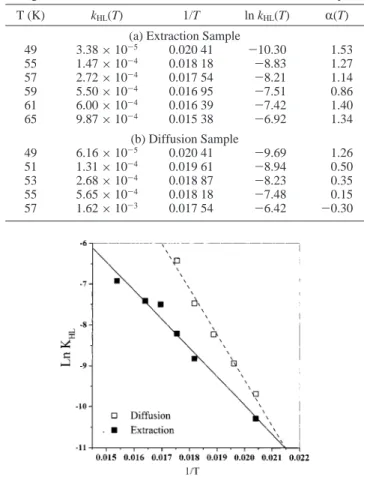
Two curves of ln KHLvs T-1are shown in Figure 10 for the
extraction and the diffusion samples, respectively. Both represent linear progression in the temperature range studied (49-65 K). From these linear plots, one can obtain thermal activation energies, Ea, of 487 ( 34 and 773 ( 52 cm-1 and the
preexponential factor aHLof 5.74× 101and 3.88× 10⁵for the
extraction and diffusion samples, respectively. It is obvious that the relaxation rate KHLis primarily controlled by aHL in the
temperature range studied. Thus KHLis larger for the diffusion
sample than for the extraction sample.
Assuming that, at temperatures below 50 K, the relaxation behavior is temperature independent, then one gets an S value
of∼45 cm-1and p value of 1-2,22,24-27Thus, the zero point
energy difference of the HS and the LS states,∆ΕHL0 , is 250-500 cm-1. The observed low-temperature tunneling rate,ΚHL0 (at T f 0), is ∼10-10, when plotted against the transition temperature (176 K), which agreees with the literature values for such spin-crossover systems.16,22Unfortunately we cannot
afford the lengthy beam time required for study of the relaxation behavior at very low temperature (<49 K). Neverthless, comparing our work with the relaxation behavior of other spin-crossover systems,16,22we believe that the relaxation mechanism
does have a temperature-dependent part at somewhat elevated temperatures and a temperature-independent tunneling part at temperatures below 50 K.
Conclusion
Metal K- and L-edge absorption spectroscopy appears to be a very powerful technique to investigate the spin-crossover system. The abrupt change in diffraction pattern near the transition temperature is firmly observed. LIESST and the relaxation behavior are successfully monitored by X-ray absorp-tion spectroscopy. The model of a self-acceleraabsorp-tion of HS to LS relaxation with increasing fraction of LS species is consistent with the experimental observations. The molecular structure of the excited high-spin state (HS-2) at low temperature is believed to be slightly different from that of the normal high-spin state (HS-1). Two differently prepared samples give the same FTIR and XAS spectra, but show significantly different behavior in magnetic measurement and the thermal relaxation behavior of the HS-2 state.
Acknowledgment. We give special thanks to Prof. Y. P. Lee and Miss L. H. Lai of National Tsing-Hwa University for their assistance with the VTFTIR measurement. Thanks are due to Dr. de Groot for supplying the software on crystal field multiplet calculation and to Dr. Otwinowsky, for supplying and kindly helping with the HKL packages. We also o express our thanks to the instrumentation center at National Taiwan University for magnetic measurement and the X3A1 beam line staff for their assistance with the XRD measurement. Financial support from NSC and SRRC are highly appreciated.
Supporting Information Available: HS f LS relaxation curves at various temperatures based on the Fe K-edge absorp-tion spectra after irradiaabsorp-tion on extracabsorp-tion sample and diffusion sample; tables of crystal data, structure solution and refinement, atomic coordinates, and anisotropic thermal parameters for Fe-(phen)2(NCS)2at 20 K; an Ortep drawing of Fe(phen)2(NCS)2
at 20 K; and Fourier-filtered EXAFS data for the first coordinated shell for HS-1, LS-1, andHS-2. See any current masthead page for ordering information and Web access instructions.
JA9943290
Table 2. Kinetics Relaxation Model Fitting Parameters from L-Edge Measurements for (a) Extraction and (b) Diffusion Sample
T (K) kHL(T) 1/T ln kHL(T) R(T)
(a) Extraction Sample
49 3.38× 10⁻⁵ 0.020 41 -10.30 1.53 55 1.47× 10⁻⁴ 0.018 18 -8.83 1.27 57 2.72× 10⁻⁴ 0.017 54 -8.21 1.14 59 5.50× 10⁻⁴ 0.016 95 -7.51 0.86 61 6.00× 10⁻⁴ 0.016 39 -7.42 1.40 65 9.87× 10⁻⁴ 0.015 38 -6.92 1.34 (b) Diffusion Sample 49 6.16× 10⁻⁵ 0.020 41 -9.69 1.26 51 1.31× 10⁻⁴ 0.019 61 -8.94 0.50 53 2.68× 10⁻⁴ 0.018 87 -8.23 0.35 55 5.65× 10⁻⁴ 0.018 18 -7.48 0.15 57 1.62× 10⁻³ 0.017 54 -6.42 -0.30
Figure 10. Arrhenius plot of the HS f LS relaxation.
S )1 2f ∆Q2 pω where ∆Q )x6∆rHL (4) p )∆ΕHL 0 /pω (5)
Excited Spin State Trapping of an Fe(II) Complex J. Am. Chem. Soc., Vol. 122, No. 24, 2000 5747
Downloaded by NATIONAL TAIWAN UNIV on August 25, 2009 | http://pubs.acs.org