國
立
交
通
大
學
應用化學所
博 士 論 文
有機-無機黏土與量子點奈米複合材料
物理性質之研究
The Study of Organic-Inorganic Clay and Quantum
Dots Nanocomposites on Physical Properties
研究生:傅懷廣
指導教授:張豐志 教授
有機-無機黏土與量子點奈米複合材料物理性質之研究
The Study of Organic-Inorganic Clay and Quantum Dots nanocomposites on Physical Properties
研 究 生:傅懷廣 Student:Huai-Kuang Fu
指導教授:張豐志 Advisor:Feng-Chih Chang
國 立 交 通 大 學
應 用 化 學 所
博 士 論 文
A DissertationSubmitted to Department of Applied of chemistry College of Science
National Chiao Tung University In Partial Fulfillment of the Requirements
For the Degree of Doctor of Philosophy
In
Applied Chemistry February 2009
誌 謝
時光飛逝,轉眼間又要跟大家道別了,回想起這段求學生涯,學到好多知 識與人生的經歷,也遇到很多幫助我的貴人,讓我可以順利完成博士學位。 首先,我要感謝張豐志老師不斷的給予我鼓勵與栽培,並提供良好的研究環 境。讓我除了學到實驗上的技巧之外更能學習到自動自發與獨立研究的能力。老 師對我的諄諄教誨及期望我會謹記在心。 感謝口試委員: 邱顯堂教授、段葉芳教授、林宏洲教授、吳震裕教授與黃介 銘教授在學生的論文上提供了寶貴的指導與意見,使得論文可以更加的豐富與完 整。 感謝實驗室的學長郭紹偉博士、黃智峯博士給予我論文上的意見及幫助,感 謝葉定儒學長傳授實驗上的技巧,讓我的研究可以更順利。也感謝凱琪學姐、春 雄、弟弟、婉君、阿堅、倩婷、小朱、仁志、幸儀、宜弘在實驗上的幫忙與協助 讓我順利完成論文。另外要感謝寶寶學姐與漢清學長,讓我的研究所生涯充滿歡 笑與回憶。感謝每位實驗室成員,感謝你們維持實驗室的運作。另外,要特別感 謝中興大學植病系貴儀中心 趙佩琪小姐,感謝你在 TEM 上的協助。感謝文君姐 不斷給予鼓勵與意見,讓我獲益良多。感謝大老闆 Steven 與愛搞笑建亨在生活 上的幫忙,讓我的生活更精彩。感謝我的好友仁陽、沛原、仲辰、柏惇、育鮮、 雅雅、曼琳、冠仁、湘菱,因為你們的存在與幫助,讓我順利完成學業與豐富我 精彩的生活。特別感謝 Barbie 這段時間的鼓勵,因為你,讓我的生活更充實。 最後,將此論文獻給我親愛的父母親、姐姐與奶奶,感謝父母親對我的栽培 及家人的支持,讓我無後顧之憂的成長並順利完成學業。 僅以這分論文,獻給在我求學的路上關心與照顧我的各位。 懷廣 2009 年 2 月
Outline of Contents
Pages
Acknowledgments
Outline of Contents I
List of Tables VI
List of Scheme VII
List of Figures VIII
Abstract (in Chinese) XIII
Abstract (in English) XVI
Chapter 1 Introduction of Organic-Inorganic Nanocpmposites 1
1.1 Introduction polymer/clay nanocomposites 1 1.1.1 Structure of layered silicates 3 1.1.2 Organically modified clays 4 1.1.3 Preparation methods of nanocomposites 6 1.1.3.1 In situ polymerization of click chemistry 6 1.1.3.2 Living polymerization 8 1.1.4 Type of the nanocomposites 10 1.1.5 Properties of the nanocomposites 11 1.1.5.1 Thermal stability and flammability 11 1.1.5.2 Dimensional stability 12 1.1.5.3 Gas barrier properties 14 1.1.5.4 Mechanical propertie 15 1.1.5.4.1 Dynamic mechanical analysis (DMA) 15 1.1.5.4.2 Tensile properties 17
1.2 Introduction of QDs nanocomposites 19
1.2.1 Bulk semiconductor 21
1.2.2Nanocrystalline semiconductors 23 1.2.3 Introduction of the II-VI ZnS material 26 1.2.4 Properties of nanostructure 28
1.2.4.1 Surface effect 29
1.2.4.2 Small size effect 29
1.2.4.3 Quantum size effect 30 1.2.4.4 Quantum confinement effect 31
1.2.5 Emission theory 32
1.2.5.1 Fluorescence and non-radiative transfer 34
1.3 Introduction of stimuli response polymer 35 1.3.1 Thermo-responsive polymers 36
1.3.2 PH responsive polymers 37
References 39
Chapter 2 Studies on Thermal Properties of PS Nanocomposites for the Effect of Intercalated Agent with Side Groups
63
Abstract 63
2.1 Introduction 64
2.2 Experimental 66
2.2.1 Materials 66
2.2.2 Preparation of POSS-Cl compound 66 2.2.3 Preparation of C20-4VB intercalated agent 67
2.2.5 Preparation of C20-, C20-4VB, and C20-POSS modified clays 67
2.2.6 Preparation of polystyrene/clay nanocomposites 68
2.2.7 Instrumentations 68
2.3 Results and discussion 70
2.3.1. Characterizations of C20-, C20-4VB, and C20-POSS modified
clays
70
2.3.2. Characterizations of polystyrene/clay nanocomposites 70 2.3.3. Glass transition temperatures 71 2.3.4. Molecular weights of the nanocomposites 71
2.3.5 TGA analyses 71
2.3.6 Coefficient of thermal expansion 72
2.4 Conclusions 74
Acknowledgments 74 References 75
Chapter 3 Properties Enhancement of PS Nanocomposites through the POSS surfactants 89 Abstract 89 3.1 Introduction 90 3.2 Experimental 92 3.2.1 Materials 92
3.2.2 Preparation of C20-POSS intercalated agent 92
3.2.3 Preparation of POSS-NH2 and C20-POSS modified clays 93
3.2.4 Preparation of polystyrene/clay nanocomposites 94
3.2.5.1 Measurement the molecular weights characterization 94 3.2.5.2 Structure analysis characterization 95 3.2.5.3 Thermal and mechanical analysis characterization 95
3.3 Results and discussion 97
3.3.1 Morphologies of modified clays and nanocomposites 97 3.3.2 Fourier transfer infrared analyses 98
3.3.3 Thermal properties 98
3.3.4 Molecular weights of the nanocomposites 99 3.3.5 Coefficient of thermal coefficient 100
3.4 Conclusions 101
Acknowledgments 101 References 102
Chapter 4 Effect of the organically modified Nanoclay on Low-Surface- Energy Materials of Polybenzoxazine
116
Abstract 116
4.1Introduction 117
4.2 Experimental 118
4.2.1 Preparation of CPC-modified clays 118 4.2.2. Preparation of CPC/clay/PP-a nanocomposites by solvent
method
118
4.2.3. Characterizations 118
4.2.4 Surface energy determination 119
4.3 Results and discussion 121
References 125
Chapter 5 Preparation of the Stimuli-Responsive ZnS/PNIPAM Hollow Spheres 132 Abstract 132 5.1 Introduction 133 5.2 Experimental 135 5.2.1 Materials 135
5.2.2 Preparation of the prepolymers of poly(ε-caprolactone) 135 5.2.3 Synthesis of the capping agent 2-mercaptoethyl methacrylate 136 5.2.4 Preparation of ZnS nanoparticle peripherally with
methacrylate
136
5.2.5 Synthesis of QDs hollow spheres 136
5.3 Characterizations 138
5.4 Results and discussion 139
5.5 Conclusions 142
Acknowledgments 142 References 143
List of Tables
Pages
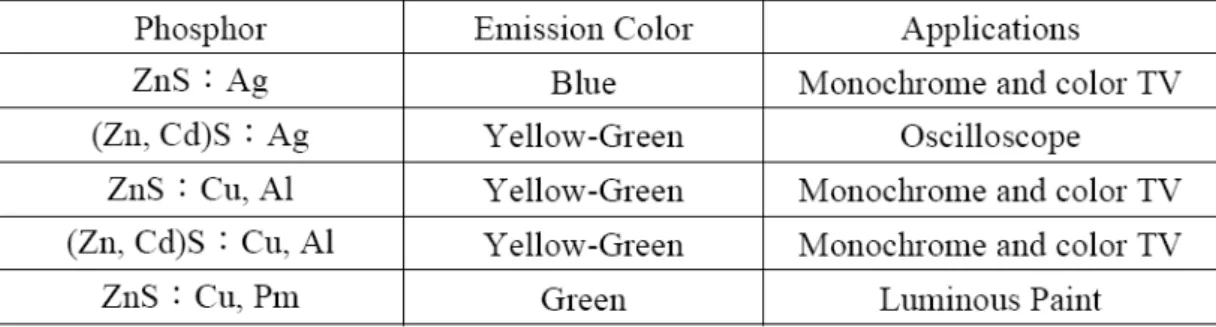
Table 1-1. Applications of the ZnS-based phosphors doping with different activators.
27
Table 2-1. Basal spacing and organic fraction of the OMMT. 78 Table 2-2. Results of thermal and mechanical properties of Polystyrene and
Polystyrene Nanocomposites.
78
Table 2-3. Molecular weights of polystyrene and polystyrene Nanocomposites.
79
Table 3-1. Results of thermal and mechanical properties of polystyrene and polystyrene Nanocomposites.
104
Table 3-2. Molecular weights of polystyrene and polystyrene nanocomposites.
105
Table 4-1. Advancing contact angles, surface free energies, roughness, XPS analysis and thermal properties of polybenzoxazine/clay
nanocomposites.
List of Schemes
Pages
Scheme 2-1. Intercalation agents for organic modified clays preparation 80 Scheme 2-2. Synthesis of the POSS -Cl compound 81 Scheme 2-3. Synthesis of the C20-4VB and C20-POSS intercalated agents 81
Scheme 3-1. Chemical structures of the intercalated agents used to prepare the modified clays
106
Scheme 3-2. Synthesis of the POSS -Cl compound 107 Scheme 3-3. Synthesis of the C20-POSS intercalated agent 108
Scheme 4-1. Representation of the intercalated agent was inserted into the silicate layers via ion exchange and preparation of
polybenzoxazine nanocomposites by thermal treatment
128
Scheme 5-1. Synthesis of the capping agent of 2-mercaptoethyl methacrylate 146 Scheme 5-2. Representation of the photoluminescence hollow sphere
preparation and temperature responsive.
List of Figures
Pages
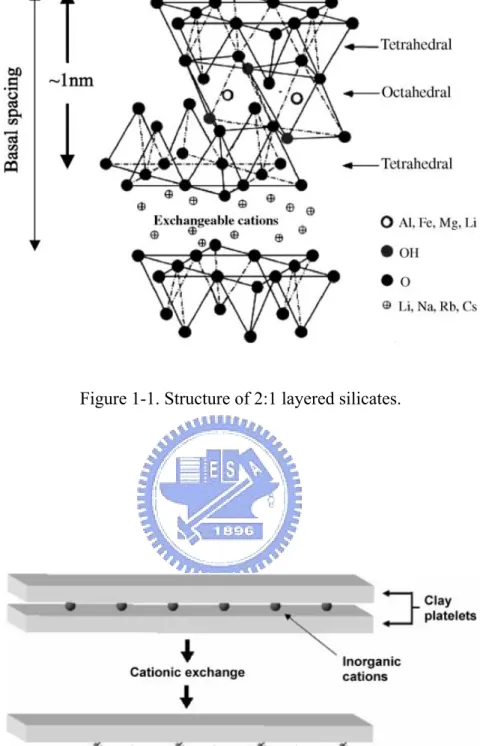
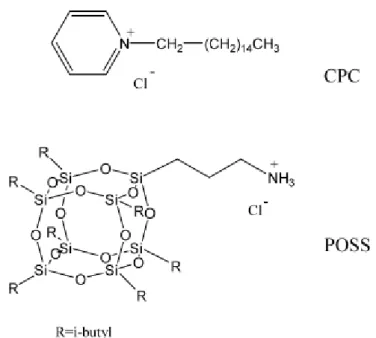
Figure 1-1. Structure of 2:1 layered silicates 46 Figure 1-2. Scheme of effect of cationic exchange on interlayer spacing 46 Figure 1-3. Chemical structures of the surfactants used to prepare the
modified clays
47
Figure 1-4. (a) Chemical structure of organic clay 10A, in which HT is hydrogenated tallow with ~65% C18, ~30% C16, and ~5% C14. (b) Chemical structure of organic clay VB16
47
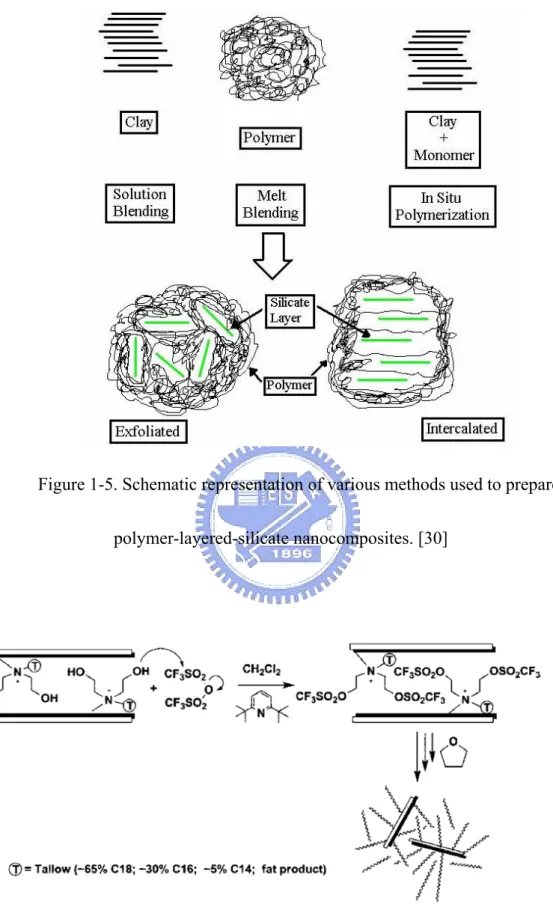
Figure 1-5. Schematic representation of various methods used to prepare polymer-layered-silicate nanocomposites.
48
Figure 1-6. Preparation of polytetrahydrofuran/montmorillonite clay
nanocomposites by in situ cationic ring opening polymerization.
48
Figure 1-7. (a) Azide-functionalized montmorillonite clay and its “Click” reactions with propargyl methacrylate and (b)
Alkyne-Functionalized olytetrahydrofuran.
49
Figure 1-8. The synthesis of the photoiniferter procgress. 49 Figure 1-9. The concept of in situ living polymerization from the
silicateanchored photoiniferter.
50
Figure 1-10. The preparation of block copolymers by sequential addition of monomers.
50
Figure 1-11. Schematically illustration of three different types of thermodynamically achievable polymer/layered silicate nanocomposites.
Figure 1-12. TGA curves for polystyrene, PS, and the nanocomposites. 51 Figure 1-13. Peak heat release rates for polystyrene and the three
nanocomposites.
52
Figure 1-14. PS and PS/clay nanocomposites after dimension stability test. Clay loading is 5 wt % for all nanocomposites.
52
Figure 1-15. Formation of tortuous path in PLS nanocomposites. 53 Figure 1-16. Relative gas permeability versus clay loading for polymer/clay
nanocomposites per the model be Nielsen. The different curves represent aspect ratios of 50, 100, 150, and 200 for series 1–4 respectively.
53
Figure 1-17. Storage modulus of (a) pure PS, (b) PS/MMT-1, (c) PS/MMT-2 and (d) PS/MMT-3.
54
Figure 1-18. Tanδ values of (a) pure PS, (b) PS/MMT-1, (c) PS/MMT-2 and (d) PS/MMT-3.
54
Figure 1-19. (a) Tensile strengths, (b) Young’s modulus and (c) elongations at break of PS/MMT nanocomposites.
55
Figure 1-20. Schematic illustration of formation of hydrogen bonds in N6/MMT nanocomposite.
56
Figure 1-21. Effect of clay content on tensile modulus in case of N6/OMLS nanocomposites prepared via melt extrusion.
56
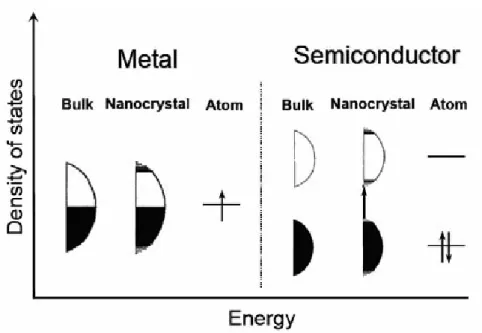
Figure 1-22. Schematic illustration of the density of states in metal and semiconductor clusters.
57
Figure 1-23. Idealized density of states for one band of a semiconductor structure of 3, 2, 1, and “0” dimensions.
57
phase.
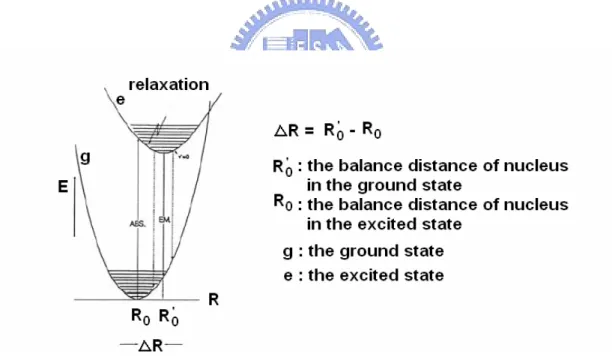
Figure 1-25. Quantum confinement effect of the electrons and the photons. 59 Figure 1-26. Configuration coordiance diagrams of the phosphor. 59 Figure 1-27. Energy transformation diagram of the excitation energy. 60 Figure 1-28. Progress of the relaxation. 60 Figure 1-29. Diagram of the Stokes shift. 61 Figure 1-30. Influence of the different coupling effect on width of the
emission peaks.
61
Figure 1-31. Potential stimuli and responses of synthetic polymers. 62
Figure 1-32. Schematic of ‘smart’ polymer response with temperature. 62
Figure 1-33. Control of micellar states dependent on pH. 62 Figure 2-1. X-Ray diffraction patterns of pure clay, and intercalated clays. 82 Figure 2-2. XRD spectra of the three surfactant-containing nanocomposites
indicating the extent of delamination.
83
Figure 2-3. TEM images of (a) C20, (b) C20-4VB, (c) C20-POSS (low
magnification), and (d) C20-POSS (high magnification)-treated
nanocomposites.
84
Figure 2-4. DSC curves glass transition temperature of (a) PS, (b) the
nanocomposites formed used C20, (c) the nanocomposites formed
used C20-4VB, and (d) the nanocomposites formed used
C20-POSS.
85
Figure 2-5. TGA curves of (a) Pure Clay, (b) C20-POSS/Clay, (c)
C20-4VB/Clay, and (d) C20/Clay.
86
Figure 2-6. (A)TGA and (B) DTG curves of the nanocomposites under a nitrogen atmosphere: (a) pure PS, (b) the nanocomposite formed
with C20, (c) the nanocomposite formed with C20-4VB, and (d)
the nanocomposite formed with C20-POSS.
Figure 2-7. Coefficient of thermal expansion of (a) pure PS, (b) the
nanocomposite formed with C20, (c) the nanocomposite formed
with C20-4VB, and (d) the nanocomposite formed with C20-POSS.
88
Figure 3-1. X-Ray diffraction patterns of pure clay, and intercalated clay. 109 Figure 3-2. XRD spectra of C20-POSS, pure clay, and C20-POSS/Clay. 110
Figure 3-3. XRD spectra of the two surfactant-containing nanocomposites indicating the extent of delamination.
111
Figure 3-4. TEM images of (a) POSS-NH2 and (b) C20-POSS-treated
nanocomposites.
112
Figure 3-5. IR spectra of the two intercalated agent, intercalated clay, and pure clay.
113
Figure 3-6. DSC curves glass transition temperature of (a) PS, (b) the nanocomposites formed used POSS-NH2, and (c) the
nanocomposites formed used C20-POSS.
114
Figure 3-7. TGA curves of (a) pure Clay, (b) POSS-NH2/Clay, (c)
C20-POSS/Clay, (d) pure PS, (e) the nanocomposite formed with
POSS-NH2, and (f) the nanocomposite formed with C20-POSS.
115
Figure 4-1. X-ray diffraction patterns of (a) pure clay, and (b) CPC/clay, (c) PP-a/Clay 3 wt%, (d) 5 wt%, (e) 10 wt%.
129
Figure 4-2. TEM micrographs of the polybenzoxazines (PP-a)
nanocomposites containing 3 wt % clay: (left) low magnification, and (right) high magnification.
130
and (b) Phase image.
Figure 5-1. The 1H NMR spectrum for 2-mercaptoethyl methacrylate. 148 Figure 5-2. FT-IR spectra of the (a) PCL, (b) ZnS/PCL/PNIPAM spheres, and
(c)ZnS/PNIPAM hollow spheres.
149
Figure 5-3. X-ray diffraction patterns of the (a) ZnS nanoparticle and (b) ZnS/PNIPAM hollow spheres.
150
Figure 5-4. TEM image and electron diffraction pattern of the (a) PNIPAM hollow spheres, (b) ZnS/PNIPAM hollow spheres.
151
Figure 5-5. Variation of average hydrodynamic diameters (Dh) vs.
temperature of the ZnS/PNIPAM hollow spheres.
152
Figure 5-6. PLE and PL spectrum of the 0.3-ZnS and 0.6-ZnS nanoparticles. 153 Figure 5-7. Normalized photoluminescence spectra of the 0.3-ZnS/PNIPAM
hollow sphere at different temperature.
有機-無機黏土與量子點奈米複合材
料物理性質之研究
學生:傅懷廣
指導教授:張豐志
國立交通大學應用化學研究所 博士班
摘 要
高分子複合材料一般為有機高分子基材與無機添加物的結合且至少存在於 一維的奈米尺寸的範圍下。添加物從結構上可以分為一維(例如:奈米碳管與纖 維),二維 (片狀的無機材料,如黏土),與三維 (球與量子點)。導入奈米尺寸添 加物高分子上,改善了高分子原本的物理性質。在本篇論文可以分成四個部分, 探討無機的添加物對於高分子複合材料物理性質的影響。 1. 插層劑側鏈的官能基對於聚苯乙烯/黏土奈米複合材料影響 我們利用三種不同插層劑改質的有機黏土藉由乳化聚合製備聚苯乙烯/黏 土奈米複合材料。這些奈米複合材料在黏土含量在 3 wt %時皆達到脫層的結 構。我們所使用的插層劑( C20、 C20-4VB、與 C20-POSS)經由離子交換反應 後成功進入黏土的層間,使親水黏土與疏水高分子有更好的相容性,進一步 的讓改質後的有機黏土均勻分散於高分子基材中並達到脫層的結構。從 X-ray繞射儀 (XRD)、穿透式電子顯微鏡 (TEM) 與傅立葉紅外線光譜儀 (FT-IR) 的結果指出所使用的插層劑有成功的進入到黏土的層間,並成功製備具有脫 層結構的聚苯乙烯/黏土奈米複合材料。在熱性質的測試中 (TGA 與 TMA), C20-POSS/黏土聚苯乙烯奈米複合材料相對於聚苯乙烯下開始產生裂解的溫 度可以提升 25 °C 其熱膨脹係數 (CTE) 最大的降低的量可以達到 40 %。另 外,這些經由改質奈米複合材料的玻璃轉化溫度(Tg)都高於聚苯乙烯。 2. 經由 POSS 的插層劑改質使聚苯乙烯奈米複合材料性質提升 我們使用 POSS-NH2 與 C20-POSS 為插層劑改質黏土並進一步製備 POSS/黏土聚苯乙烯奈米複合材料。X-ray 繞射儀 (XRD) 的結果指出本研究 所使用的插層劑製備的 POSS/黏土奈米複合材料在 X-ray 的圖譜上都沒有繞 射峰出現,此結果表示我們所製備的奈米複合材料皆達到脫層的結構。並進 一步從穿透式電子顯微鏡 (TEM) 直接觀察複合材料的結構型態,從結果指 出黏土均勻分散於聚苯乙烯高分子基材中並達到脫層的結構。對於 C20-POSS/ 黏土奈米複合材料我們導入這些脫層的黏土於聚苯乙烯中可以有效的提升其 玻璃轉化溫度(Tg)、熱裂解溫度 (Td) 與熱膨脹係數 (CTE) 最大的降低的量 可以達到 40 %。 3. 有機奈米黏土在聚氧代氮代苯并環己烷於低表面能材料的影響 我們製備新穎低表面能聚氧代氮代苯并環己烷/有機黏土改質奈米複合 材料。我們使用三種液體的方法計算表面能。CPC/黏土 10%/PP-a 奈米複合
材料經過 200 ℃/4 小時交聯後反應後具有極低的表面能係數 12.7 mJ/m2,甚 至低於我們所熟悉的鐵氟龍材料(22.0 mJ/m2 )。我們使用 X-ray 光電子光譜 (XPS)表示我們所製備的奈米複合材料的表面具有較高的矽含量,表示有機黏 土在製備的過程中優先的存在於最外層的表面。另外,CPC/黏土 10%/PP-a 奈米複合材料的玻璃轉化溫度(Tg)較 PP-a 高 22.6 ℃與熱裂解溫度 (Td)也相 對於 PP-a 提升 31.5 ℃。我們發現這個方法可以製備同時具有低表面能與高 熱穩定性的高分子黏土奈米複合材料。 4. 製備具有刺激-應答硫化鋅/聚異丙基丙烯醯氨中空球 新穎的量子點硫化鋅/聚異丙基丙烯醯氨混成中空球是使用局部自由基 聚合反應製備,在 PCL 奈米球周圍讓異丙基丙烯醯氨與交聯劑 (MBA) 反應 所形成,後進一步的使用酵素 (Lipase PS) 將 PCL 進行生物分解。我們使用 穿透式電子顯微鏡 (TEM)與動態光散射儀 (DLS) 分別有系統的探討所形成 的硫化鋅/聚異丙基丙烯醯氨中空球結構與熱敏感可逆的性質。硫化鋅/聚異丙 基丙烯醯氨中空球具有螢光的性質並在大約 32 o C 有膨脹收縮的特性,符合 於螢光光譜上有些微紅位移的現象出現。
The Study of Organic-Inorganic Clay and Quantum
Dots nanocomposites on Physical Properties
Student:Huai-Kuang Fu
Advisors:Dr. Feng-Chih Chang
Institute of Applied Chemistry
National Chiao Tung University
ABSTRACT
Polymer nanocomposites are commonly defined as the combination of a polymer matrix and additives that have at least one dimension in nanometer range. The additives can be one-dimensional (example include nanotubes and fibers), two- dimensional (which include layered minerals like clay), or three-dimensional (include spherical particles and quantum dots). Nanoscale-filled polymeric systems offer the prospect of greatly improving many of the properties of the polymer matrix. The dissertation was focused on four major subjects: the study of the inorganic additives of polymer nanocomposites on physical properties.
1. Studies on Thermal Properties of PS Nanocomposites for the Effect of
Intercalated Agent with Side Groups
organically modified clays by emulsion polymerization method. These nanocomposites were exfoliated up to 3 wt % content of pristine clay relative to the amount of polystyrene (PS). The intercalated agents, C20, C20-4VB, and C20-POSS intercalated into the galleries
result in improved compatibility between hydrophobic polymer and hydrophilic clay and facilitate the well dispersion of exfolicated clay in the polymer matrix. Results from X-ray diffraction, TEM and Fourier transform infrared spectroscopy indicate that these intercalated agents are indeed intercalated into the clay galleries successfully and these clay platelets are exfoliated in resultant nanocomposites. Thermal analyses of polystyrene-layered silicate nanocomposites compared with virgin PS indicate that the onset degradation temperature ca. 25 °C increased and the maximum reduction in coefficient of thermal expansion (CTE) is ca. 40 % for the C20-POSS/clay nanocomposite.
In addition, the glass transition temperatures of all these nanocomposites are higher than the virgin PS.
2. Properties Enhancement of PS Nanocomposites through the POSS surfactants
The polyhedral oligomeric silisesquioxnae (POSS)-clay hybrids of polystyrene are prepared by two organically modified clays using POSS-NH2 and C20-POSS as
intercalated agents. X-ray diffraction (XRD) studies show that the formation of these POSS/clay/PS nanocomposites in all cases with the disappearance of the peaks corresponding to the basal spacing of MMT. Transmission electronic spectroscopy
(TEM) was used to investigate the morphology of these nanocomposites and indicates that these nanocomposites are comprised of a random dispersion of exfoliated throughout the PS matrix. Incorporation of these exfoliated clay platelets into the PS matrix led to effectively increase in glass transition temperature (Tg), thermal
decomposition temperature (Td) and the maximum reduction in coefficient of thermal
expansion (CTE) is ca. 40 % for the C20-POSS/clay nanocomposite.
3. Effect of the organically modified Nanoclay on Low-Surface-Energy Materials of
Polybenzoxazine
Novel low surface free energy materials of polybenzoxazine/organically modified silicate nanocomposites have been prepared and characterized. The CPC (cetylpyridinium chloride)/clay10%/Poly(3-phenyl-3,4-dihydro-2H-1,3-benzoxazine) (PP-a) possesses an extremently low surface free energy (12.7 mJ/m2) after 4 hrs curing at 200 ℃, even lower than that of poly(tetrafluoroethylene) (22.0 mJ/m2) calculated on the basis of the three-liguid geometric method. X-ray photoelectron spectroscopy (XPS) shows higher silicon content on the surface of nanocomposites than average composition, implying that the clay is more preferentially enriched on the outermost layer. In addition, the glass transition temperature (Tg) of the
polybenzoxazine (PP-a) in the nanocomposite is 22.6 ℃ higher and its thermal decomposition temperature is also higher than the pure PP-a. This finding provides a
simple way to prepare lower surface energy and high thermal stability material.
4. Preparation of the Stimuli-Responsive ZnS/PNIPAM Hollow Spheres
Novel quantum dots ZnS/poly(N-isopropylacrylamide) (PNIPAM) hybrid hollow spheres were obtained by localizing free radical polymerization of NIPAM and crosslinker (MBA) at the peripheral of PCL nanoparticles, followed by biodegradation of PCL with an enzyme of the Lipase PS. The formation of ZnS/PNIPAM hollow spherical structures and the thermo-sensitive reversible properties were systematically investigated by transmission electron microscopy (TEM) and dynamic light scattering (DLS), respectively. The ZnS/PNIPAM hollow spheres possess the photoluminescence properties and a swelling and de-swelling at about 32 oC, which agrees well with the slight red-shift in photoluminescence spectra.
Chapter 1
Introduction of the Organic-
Inorganic
Nanocomposites
Polymer nanocomposites are commonly defined as the combination of a polymer matrix and additives that have at least one dimension in the nanometer range. The additives can be one-dimensional (example include carbon nanotubes and fibres), two-dimensional (which include layered minerals like clay), or three-dimensional (including spherical particles).
1.1 Introduction of polymer/clay nanocomposites
Over the past decade, polymer nanocomposites have attached considerable interests in both academia and industry, owing to their outstanding mechanical properties like elastic stiffness and strength with only a small amount of nanoadditives. The utility of inorganic nanoparticles as additives to enhance polymer performance has been established and now provides additional opportunities for many diverse commercial applications. Low-volume additions (1-10%) of isotropic nanoparticles, such as titania, alumina, and silver, and aniostropic nanoparticles, such as layered silicates (nanoclays) or carbon nanotubes, provide property enhancements with respect to the neat resin that are comparable to that achieved by conventional loadings
(15-40%) of traditional micrometer-scale inorganic fillers. The lower loadings facilitate processing and reduce component weight. Most important though is the unique value-added properties and property combinations that are not normally possible with traditional fillers, such as reduced permeability, optical clarity, self-passivation, and flammability, oxidation, and ablation resistance.
The synthesis and development of polymer/clay nanocomposites have attracted a tremendous amount of interest during the last decade, because these materials exhibit improved properties which are synergistically derived from the two components because of their nanometer-size dispersion, [1–5] as compared to those of the pristine polymer. These improvements include enhanced barrier characteristics, [6] increased (storage and loss) moduli and strengths, [7] high heat distortion temperatures, [8] decreased thermal expansion coefficients, [6 – 9] reduced permeability to gases and liquids, [10] and enhanced ionic conductivity. [11] In the early 1990s, Toyota Central Research Laboratories in Japan reported work on a Nylon-6 nanocomposite, [12] for which a very small amount of nano filler loading resulted in a pronounced improvement of thermal and mechanical properties. We have at our fingertips, however, the ability to change the size, shape, volume fraction, interface, and degree of dispersion or aggregation. Thus, the opportunities may well become limitless when theory and experiment have assembled enough information to guide further
development.
1.1.1 Structure of layered silicates
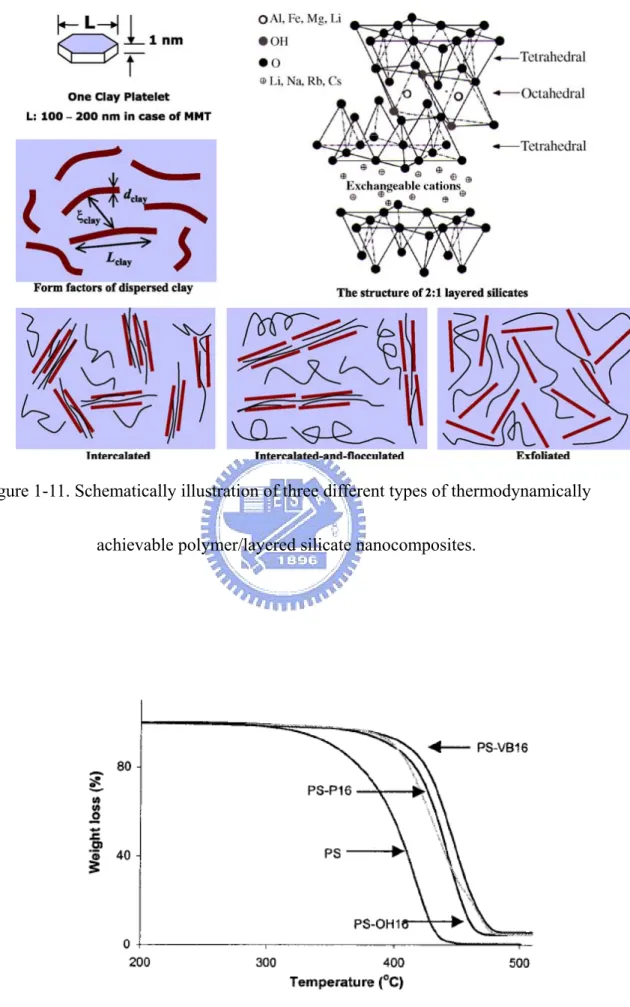
The commonly clays used for the preparation of polymer/layered silicate nanocomposites belong to the same general family of phyllosilicates. Their crystal structure consists of layers made up of two silica tetrahedral fused to an edge shared octahedral sheet of either aluminum or magnesium hydroxide. The layer thickness is ~1 nm and the lateral dimensions of these layers may vary from 30 nm to several micrometres and even larger depending on the particular layered silicate. Stacking of the layers leads to a regular van der Waals gap between the layers called the interlayer or gallery. Isomorphic substitution within the layers (for example, Al+3 replaced by
Mg+2 or by Fe+3, orMg+2 replaced by Li+1) generates negative charges that are
counterbalanced by alkali and alkaline earth cations situated inside the galleries. Details regarding the structure and chemistry for these layered silicates are provided in Figure 1-1.
Montmorillonite is hydrophilic in nature, which hinders the homogeneous dispersion in the organic polymer phase. Ion exchange of the interlayer inorganic cations (Na+,
Ca2+) with organic cation renders the hydrophilic clay surface organophilic. The
with polymers or monomers. [13,14]
1.1.2 Organically modified clays
To improve compatibility with other polymer matrixes, one must convert the normally hydrophilic silicate surface to organophilic, which makes possible intercalation of many engineering polymers. The ammonium cation may have hydrocarbon tails and other groups attached and is referred to as a ‘‘surfactant’’ owing to its amphiphilic nature. The extent of the negative charge of the clay is characterized by the cation exchange capacity, i.e., CEC. Generally, this can be carried out by ion exchange reactions with cationic surfactants including primary, secondary, tertiary and quaternary alkyl ammonium or alkylphosphonium cations, which increase the original clay interlayer spacing and behave as organophilic surfactants (Figure 1-2). The role of alkylammonium or alkylphosphonium cations in the organosilicates is to lower the surface energy of the inorganic host and improve the wetting characteristics with the polymer matrix, and results in a larger interlayer spacing.
Chang and co-workers [15] reported the preparation of two types of nanocomposites formed from cetylpyridinium chloride (CPC)- and aminopropylisobutyl polyhedral oligomeric silsesquioxane (POSS)-treated clays
(Figure 1-3). The PS/clay nanocomposite formed using the CPC-treated clay exhibited no significant improvement in thermal properties. [16-20] The major advantage of choosing POSS molecules is its thermal stability up to 300 oC, higher than the thermal degradation temperatures of most organic molecules. POSS consists of a rigid cubic silica core with 0.53 nm side length, to which organic functional groups can be attached at the vertices for further reactions. POSS derivatives containing amine functional groups can play the role of surfactants for the treatment of clay and the thermal stability of the resulting nanocomposite is enhanced.
Wang [21] used two different organic modifications of the montmorillonite, one contains a styryl monomer on the ammonium ion while the other contains no double bond. A double bond that may be involved in the polymerization reaction is present in the cation of the clay. Polystyrene-clay nanocomposite has been prepared by bulk, solution, suspension, and emulsion polymerization as well as by melt blending. The organic modification as well as the mode of preparation may determine whether the composite is either exfoliated or intercalated. Exfoliation is more likely to occur if the ammonium ion contains a double bond which can participate in the polymerization reaction. However, the mere presence of this double bond is not sufficient to always produce an exfoliated system. This work focused on two organically modified clays, one of which is labeled as VB16, where the ammonium salt contains one long chain,
two methyl groups, and a styryl unit, while the other is labeled 10A, where the ammonium cation contains a long chain, two methyl groups, and a benzyl group. The structures of the ammonium salts used to prepare the clays are shown in Figure 1-4.
1.1.3 Preparation methods of nanocomposites
Polymerization of vinyl monomers intercalating into the montmorillonite (MMT) clay [22] were first reported in literature as early as 1961. The most recent methods to prepare polymer-layered-silicate nanocomposites have primarily been developed by several other groups. In general these methods (shown in Figure 1-5) are able to achieve molecular-level incorporation of the layered silicate (e.g. montmorillonite clay or synthetic layered silicate) in the polymer matrix by addition of a modified silicate either to a polymerization reaction (in situ method), [23-25] to a solvent-swollen polymer (solution blending), [26] or to a polymer melt (melt blending). [27-28] Recently, a method has been developed to prepare the layered silicate by polymerizing silicate precursors in the presence of a polymer. [29]
1.1.3.1 In situ polymerization of click chemistry
Yagci and co-worker report two effective routes for the synthesis of PTHF/clay nanocomposites, namely, (1) in situ cationic ring opening polymerizationCROP and
(2) a method involving “click” chemistry. In the first approach, the nanocomposites have been prepared by the CROP of THF that is initiated in the intercalated layers of the clay. In the second approach, CROP of THF has been performed to produce alkyne-functionalized PTHF and the obtained polymers were subsequently anchored to azide-modified clay layers by a “click” reaction. In principle, this approach can be extended to the combination of azide-modified clay with any other alkyne containing polymers.
For the preparation of PTHF/clay nanocomposites by the in situ polymerization method, the hydroxyl functions of the modified intercalated montmorillonite clay (MMT-(CH2CH2-OH)2) are reacted with trifluoromethanesulfonic anhydride (TfO2),
in the presence of 2,6-di-tertbutylpyridine (DTBP) as proton trap and dichloromethane as solvent, to produce the corresponding triflate ester that is known to be an initiator for the CROP of THF. Then, a large amount of THF monomer is added. [31] After the prescribed reaction time, the process directly leads to the formation of the PTHF/clay nanocomposites, as shown in Figure 1-6.
Figure 1-7 indicated the introduction of azide functionalities on the surface of the silica nanolayers, methanesulfonyl chloride was used to convert the hydroxyl groups into methanesulfonate groups, which were subsequently reacted with sodium azide to yield the desired clay “click” component. Alkyne-functionalized PTHF, the other
“click” component, was prepared by terminating living PTHF chains with propargyl alcohol (Figure 1-7), based on earlier developed synthetic routes for other end-functionalized PTHF systems. [33]
1.1.3.2 Living polymerization
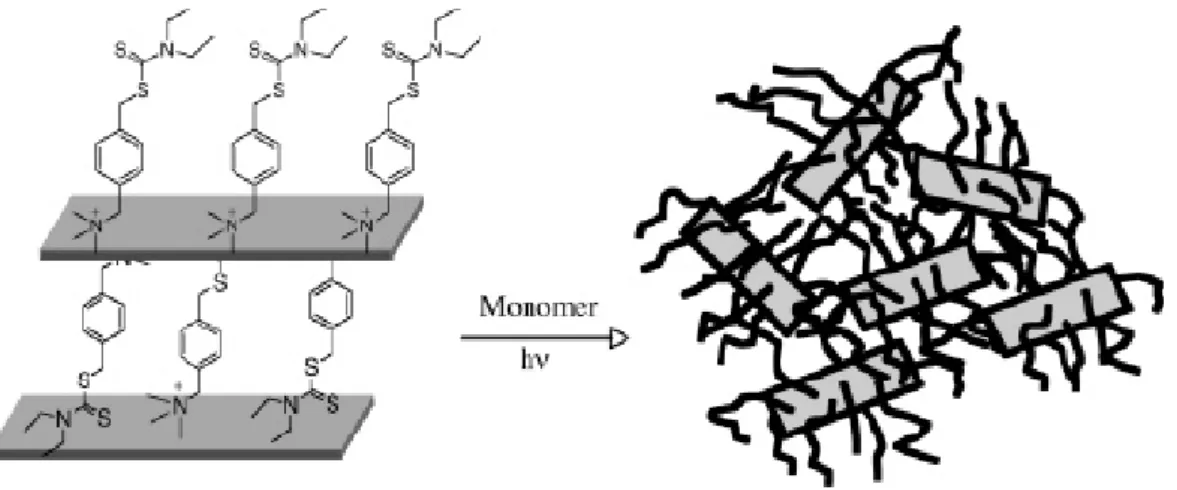
Sogah and co-worker report our preliminary results on the preparation of exfoliated polymer/silicate nanocomposites by in situ polymerization from a silicate-anchored photoiniferter. The method worked reproducibly and is capable of producing nanocomposites of a broad range of silicate loading and polymer molecular weights. Taking advantage of the living characteristic of the process, we also prepared block copolymer/silicate nanocomposites by sequential monomer addition. One principal finding is that exfoliated nanocomposites with very high silicate contents (above 20 wt %) could readily be prepared. This is significant since it will allow the high silicate containing nanocomposites to be used as masterbatches in preparing all kinds of nanocomposites by simple blending without always having to begin from scratch.
The desired photoiniferter must contain a photoactive initiating moiety (in this case, the benzyl dithiocarbamate) capable of effecting living/controlled free radical polymerization of a variety of monomers. For an anchoring site, we chose the
benzyltrimethylammonium moiety because it cannot undergo β-H Hoffman elimination at elevated temperatures unlike most of the current surfactants used in modifying clays. Figure 1-8 shows the synthesis of the photoiniferter from 4-(bromomethyl) benzyltrimethylammonium bromide (1). The displacement of the bromide by sodium N,N-diethyldithiocarbamate occurred in a straightforward manner to give the desired photoiniferter 2 in almost quantitative (98%) yield. The reaction was so clean that the only purification necessary was washing the precipitate with acetone and drying. The incorporation of 2 into the silicate was achieved by simply mixing and stirring an aqueous solution of 2 in a stable dispersion of a commercially available montmorillonite (MMT) having cationic exchange capacity of 92.6 mequiv/ 100 g (Figure 1-9). [34-35]
An important advantage offered by the living polymerizations is the capability to prepare nanocomposites containing block copolymers by sequential addition of monomers (Figure 1-10). In the first trial, PS/silicate nanocomposite containing living PS chain ends was employed to initiate living free radical polymerization of MMA to give Sil-PS-b-PMMA. In a similar manner, PMMA/silicate nanocomposite was employed to initiate living free radical polymerization of styrene to obtain Sil-PMMA-b-PS.
1.1.4 Type of the nanocpmposites
In general, layered silicates have layer thickness on the order of 1 nm and very high aspect ratio (e.g. 10~1000). A few weight percent of layered silicates that are properly dispersed throughout the polymer matrix thus create much higher surface area for polymer/filler interaction as compared to conventional composites. Depending on the strength of interfacial interactions between the polymer matrix and layered silicate (modified or not), three different types of polymer/layered silicate (PLS) nanocomposites are thermodynamically achievable, as shown in Figure 1-11.
a. Intercalated nanocomposites: in intercalated nanocomposites, the insertion of a polymer matrix into the layered silicate structure occurs in a crystallographically regular fashion, regardless of the clay to polymer ratio. Intercalated nanocomposites are normally interlayer by a few molecular layers of polymer. Properties of the composites typically resemble those of ceramic materials.
b. Flocculated nanocomposites: conceptually this is same as intercalated nanocomposites. However, silicate layers are some times flocculated due to hydroxylated edge-edge interaction of the silicate layers.
c. Exfoliated nanocomposites: in an exfoliated nanocomposite, the individual clay layers are separated in a continuous polymer matrix by an average distances that depends on clay loading. Usually, the clay content of an exfoliated nanocomposite is much lower than that of an intercalated nanocomposite.
1.1.5 Properties of nanocomposites
1.1.5.1 Thermal stability and flammability
The thermal stability of polymeric materials is usually studied by thermogravimetric analysis (TGA). The weight loss due to the formation of volatileproducts after degradation at high temperature is monitored as a function of temperature. When the heating occurs under an inert gas flow, a non-oxidative degradation occurs, while the use of air or oxygen allows oxidative degradation of the samples. Generally, the incorporation of clay into the polymer matrix was found to
enhance thermal stability by acting as a superior insulator and mass transport barrier to the volatile products generated during decomposition.
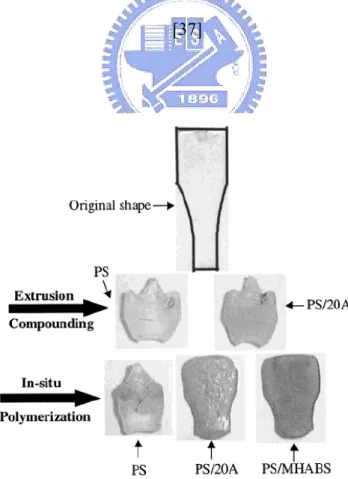
Jin and co-worker investigated thermal property of polymer-clay nanocomposites by TGA and cone calorimetry. [37] The thermal stability of the nanocomposite is enhanced
relative to that of virgin polystyrene and this is shown in Figure 1-12. Typically, the onset temperature of the degradation is about 50 oC higher for the nanocomposites than for virgin polystyrene.
Recently clay nanocomposites were found to impart a substantial level of flame retardancy. The flame retardancy effect appears to originate from the clay’s ability to contribute to char formation. This char layer forms an insulative layer to slow down heat transfer and retards movement of gases to feed the flame. One invariably finds that nanocomposites have a much lower peak heat release rate (PHRR) than the virgin polymer. The peak heat release rate for polystyrene and the three nanocomposites are also shown graphically in Figure 1-13. P16-3 means that the nanocompoite was formed using 3 % of P16 clay with polystyrene. The peak heat release rate falls as the amount of clay was increased. The suggested mechanism by which clay nanocomposites function involves the formation of a char that serves as a barrier to both mass and energy transport. [38] It is reasonable that as the fraction of clay increases, the amount of char that can be formed increases and the rate at which heat is released is decreased. There has been a suggestion that an intercalated material is more effective than is an exfoliated material in fire retardancy. [37]
Dimensional stability is critical in many applications. For example, if the layers of a microelectronic chip have different thermal or environmental dimensional stabilities, then residual stresses can develop and cause premature failure. Poor dimensional stability can also cause warping or other changes in shape that affect the function of a material. Nanocomposites provide methods for improving both thermal and environmental dimensional stability. The possible mechanism by which nanofillers can affect the coefficient of thermal expansion (CTE) of a polymer has also been observed in traditional fillers.
The dimension stability of nanocomposites was studied by Zeng and Lee. [39] Figure 1-14 shows the shape changes of injection molded PS and PS/clay nanocomposites under the aforementioned thermal cycle (50 oC, 1 h; 75 oC, 1 h; 105 oC, 1 h; and 135 oC, 1h). The original sample shape is shown in the first row. Pure PS and the extruded PS/20A (dimethyl dehydrogenated tallow ammonium montmorillonite, 20A) nanocomposite are shown in the second row for comparison. The third row shows the in-situ polymerized pure PS, PS/20A, and PS/MHABS (2-methacryloyloxyethylhexadecyldimethylammonium bromide, MHABS) nanocomposites. All the nanocomposites contain 5 wt % of clay. In the absence of clay, the sample shrank greatly, and the shape became highly irregular. Dimension stability at elevated temperature was improved significantly when 5 wt % of clay was present in the
in-situ polymerized nanocomposites, as shown in the third row. The exfoliate PS/MHABS exhibited the best dimensional stability. After the heating cycle, although the sample shrank to a certain extent, the original shape and surface smoothness remained. It is noteworthy that the PS/20A nanocomposite prepared by extrusion compounding did not show much improvement in dimension stability at elevated temperature, as compared to the in-situ polymerized PS/20A nanocomposite with the same clay content.
1.1.5.3 Gas barrier properties
In many applications the gas barrier properties of polymers is critical. This is especially true in the food packaging industry. In many food packages the oxygen ingress determines the shelf life of the food in the package. For carbonated drinks the egress of carbon dioxide is the issue. It was recognized early in nanocomposite development that the high aspect ratios of clays could impart barrier to the composite. Clays are believed to increase the barrier properties by creating a maze or “tortuous path” (Figure 1-15) that retards the progress of the gas molecules through the matrix resin.
Nielsen [40] proposed a very simple model for the effect of platy materials on relative barrier performance. This model is commonly referred to as the tortuous path model. Figure 1-16 exhibits the effect of aspect ratio and clay loading on
relative gas permeability of a composite utilizing this model. It can be seen that relatively low clay loadings can change the gas permeability greatly. There are a number of nanocomposites that come close to fitting the predictions of this simple model. Lan et al. [41] observed in polyimide nanocomposites that the relative permeability for O2, CO2, and H2O fit the tortuous path model reasonably well but
measurements on ethyl acetate exhibited a very large dependence on relative humidity. The relative permeability of ethyl acetate at 0% RH was 0.19 and at 50% RH it was 0.09. In contrast the pure polyimides more than double its permeability going from 0% to 50% RH. Chaiko and Leyva [42] reported that in a polypropylene wax composite that they observed 62 fold decreases in oxygen permeability at 5% weight loading of clay.
1.1.5.4 Mechanical properties
1.1.5.4.1 Dynamic mechanical analysis (DMA)
Dynamic mechanical analysis (DMA) measures the response of a given material to an oscillatory deformation (here in tension–torsion mode) as a function of temperature. DMA results are composed of three parameters: (a) the storage modulus (G'); (b) the loss modulus (G''); and (c) tanδ; the ratio (G"/G'); useful for determining the occurrence of molecular mobility transitions, such as the glass
transition temperature (Tg). [43]
The cyclic deformation of PS/MMT nanocomposites as a function of temperature was measured by DMA. The temperature dependence of storage modulus and tanδ were shown in Figure 1-17 and 18, respectively. The storage modulus of PS/MMT nanocomposites were greater than that of pure PS and monotonically increased with the clay content in both the glassy and rubbery regions. However, the improvements in the rubbery region were much greater than those in the glassy region. This behavior indicates that the restricted segmental motions at the organic-inorganic interface are due to large aspect ratios of the clay platelets, and the polymer chains were also well confined inside the clay galleries at the nanoscale level. [44,45] The storage modulus of PS/MMT-3 was 1.2 times higher than that of pure PS, which is comparable to the earlier reported data (1.4 times improvement). [44] The T
gs of the nanocomposites
were estimated from the peak values of tanδ, which were shifted towards higher temperature with increasing the clay content. These results indicate that nanoscale clay platelets strongly restrict the polymer segmental motions, resulting in the significant increase in T
g. This improvement in Tg is higher than those of other
researchers even though the smaller clay content was used in this experiment. [46,47] The effects of clay loadings on tensile properties of the PS/MMT nanocomposites are shown in Figure 1-19. The tensile strength and Young’s modulus
were significantly enhanced in the presence of the small contents of clay, while the elongation at break was reduced with increasing the clay content. The increase in tensile strength was attributed to the stronger interfacial adhesion between PS and the clay platelets. However, the enhancement of modulus was reasonably ascribed to the high resistance exerted by the clay platelets against the plastic deformation and the stretching resistance of the oriented polymer backbones in the galleries. The improvement of tensile strength in PS/MMT-3 compared to pure PS was ~47 %, which is greater than the earlier reported value in the literature (~21 %) for PS/MMT nanocomposite with 3 wt% MMT prepared by melt blending. [45] Similarly, the enhancement of Young’s modulus in PS/MMT-3 compared to pure PS was ~25 %, which is much greater than the reported value (7.4 % improvement for PS/MMT nanocomposite with 5 wt% clay prepared by emulsion polymerization). [48] However, the elongations at break were reduced with increasing the clay content. Similar results were earlier reported. For example, the reduction of elongation at break in PS/MMT nanocomposite with 4.4 wt% MMT prepared by melt blending was reported to ~26 %. [44]
1.1.5.4.2 Tensile properties
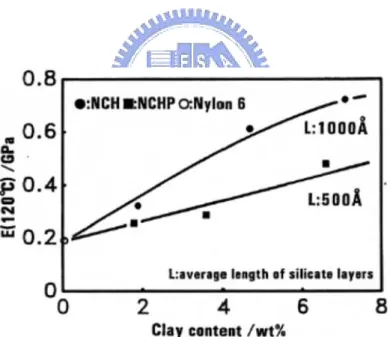
improved when nanocomposites are formed with layered silicates. N6 nanocomposites prepared through the in situ intercalative ring opening polymerization of 1-caprolactam, leading to the formation of exfoliated nanocomposites, exhibit a drastic increase in the tensile properties at rather low filler content. The main reason for the drastic improvement in tensile modulus in N6 nanocomposites is the strong interaction between matrix and silicate layers via formation of hydrogen bonds, as shown in Figure 1-20. In the case of nanocomposites, the extent of the improvement of the modulus depends directly upon the average length of the dispersed clay particles, and hence the aspect ratio. Figure 1-21 represents the dependence of the tensile modulus E measured at 120 °C for exfoliated N6 nanocomposites with various clay content, obtained by the in situ intercalative polymerization of 1-caprolactam in the presence of protonated aminododecanoic acid-modified MMT and saponite. Moreover, the difference in the extent of exfoliation, as observed for N6-based nanocomposites synthesized by the in situ intercalative polymerization of 1-caprolactam using Nat-MMT and various acids, strongly influenced the final modulus of the nanocomposites.
1.2 Introduction QDs nanocomposite
Nanoscience, nanotechnology, and nanobiotechnology (the Nanoworld) would not be as exciting as it is today if semiconductor quantum dots (QDs) and
metal nanoparticles (NPs) did not show size-tunable optical properties.
Coherent advancements in the synthesis and experimental and theoretical understanding of the structural, optical, electronic, and magnetic properties of semiconductor QDs and metal NPs created and strengthened the platform of the Nanoworld. Chemists, physicists, biologists, and technologists then interfaced semiconductor QDs, metal NPs, and their properties with organic, inorganic, and biomolecules/materials. This interfacing emerged into an exciting field of hybrid nanomaterials with potential applications in almost all the branches of science and technology today. The dimension of matter that is important to nanoscience and nanotechnology is typically on the 0.2- to 100-nm scale (nanoscale).
However, from the end of the 20th century through now on, the merge between the “top-down” (physics) and “bottom-up” processes toward the nano-scale territory has become obvious, and the relevant research has attracted much attention in the fields of chemistry, physics, material science and even molecular biology. Nowaday, “nanoscience” is believed to be the most popular terminology worldwide, and its mission may not be fulfilled without an interdisciplinary team work.
In these nanoscale regimes, particle sizes are between atoms and bulk materials, in which particle was close to molecules level. Two major effects are responsible for these size variations in nanocrystal properties. On one hand, in nanocrystals, the number of surface atoms is in a large fraction of the total, namely the surface-to-volume ratio is drastically increased as the size is decreased. On the other hand, intrinsic properties of the interior of nanocrystals are transformed from classical regime to the quantum size effects. Independent of the large number of surface atoms, semiconductor nanocrystals with the same interior bonding geometry as a known bulk phase often exhibit strong variations in their optical and electrical properties with respect to size. [51, 52] These changes arise from systematic transformations in the density of electronic energy levels as a function of the size of the interior, known as quantum size effects. As depicted in Figure 1-21, nanocrystals lie in between the atomic and molecular limit of discrete density of electronic states and the extended crystalline limit of continuous bands. [53, 54] During the past two decades, the ability to control the surfaces of semiconductors with near atomic precision has led to gain detailed insights into the semiconductor structures: quantum wells, wires, and dots. Neglecting for a moment the atomic level structure of the material, it is possible to imagine simple geometric objects of differing dimensionality in a degree of freedom of two, one, and zero, each case being made out of homogeneous semiconductor
material and with perfect surface termination.
Such structures should exhibit idealized variations in density of electronic states predicted by simple “particle in a box” type models of elementary quantum mechanics, with the continuous levels of the 3D case evolving into a discrete state of the zero-dimensional case (Figure 1-23). Recently, substantial progresses have been made in the preparation and characterization of materials consisting zero-dimensional quantum dots, particles with dimensions in the order of a few nanometers called “nanocrystalline materials”.[53-64] Tunable size and shape determining their physical properties like optical and transport properties open exciting possibilities for the creation of new functional materials used in unlimited applications.
1.2.1 Bulk semiconductors
Macrocrystalline semiconductors, if they are free of defects, consist of three-dimensional networks of ordered atoms. The translational periodicity of the crystal imposes a special form on the electronic wave functions. An electron in the periodic potential field of a crystal can be described using a Bloch type wave function (eq. 1-1), where u(r) represents a Bloch function modulating the plane wave φ (kr) of wave vector k.
u(r + n) = u(r) n integer (1-2)
In a bulk semiconductor, the large number of atoms leads to the generation of sets of molecular orbitals with very similar energies, which effectively form a continuum. At 0 K the lower energy levels, or valence band, are filled with electrons, while the conduction band consisting of the higher energy levels is unoccupied. These two bands are separated by an energy gap (Eg), the magnitude of which is a
characteristic property of the bulk macrocrystalline material at a specific temperature. Materials normally considered as semiconductors typically exhibit band gaps in the range of 0.3−3.8 eV, covering an optical response from UV-Vis to higher energy side of the infrared region.
At temperatures above 0 K, electrons in the valence band may receive enough thermal energy to be excited across the band gap into the conduction band. An excited electron in the conduction band, together with the resulting hole in the valence band, forms an “electron-hole pair”. The conductivity (σ) of the semiconductor is governed by the number of electron-hole pairs, the charge carrier concentration (n, normally expressed in terms of the number of particles per cubic centimeter), and their mobility (μ). Thus conductivity can be expressed as the sum of the electrical conductivities of electrons and holes expressed in eq. 1-3, in which q denotes the charge of carrier. In conventional semiconductors, electrons and holes are the charge carriers. At ambient
temperature, they exist in small numbers as compared to those of the conductors. However, it should be noted that the carrier mobilities in semiconductors are substantially larger than that in many conductors.
σ = qneμe + qnhμh (1-3)
The charge carriers in a semiconductor can form a bound state when they approach each other in space. This bound electron-hole pair, known as a Wannier exciton, is delocalized within the crystal lattice and experiences a screened Coulombic interaction. The Bohr radius of the bulk exciton is given in eq. 1-4 expressed as
2 2
1
1
B e ha
e
m
m
ε
∗ ∗⎡
⎤
=
⎢
−
⎥
⎣
⎦
h
(1-4) where ε represents the bulk optical dielectric coefficient, e the elementary charge, andme* and mh* the effective mass of the electron and hole, respectively.
1.2.2
Nanocrystalline semiconductorsTwo fundamental factors, both related to the size of the individual nanocrystal, distinguish their behavior from the corresponding macrocrystalline material. The first is the high dispersity (large surface/volume ratio, vide supra) associated with the particles, with both the physical and chemical properties of the semiconductor being particularly sensitive to the surface structure. The second factor is the actual size of
The absorption and scattering of incident light in larger colloidal particles can be described by Mie’s theory. However the optical spectra of nanocrystalline compound semiconductors [53-62] which show blue shifts in their absorption edge as the size of the particle decreases cannot be explained by classical theory.[66-70] Such size dependent optical properties are examples of the size quantization effect which occurs [65] when the size of the nanoparticle is smaller than the bulk-exciton Bohr radius, aB
(see eq. 1-4), of the semiconductor. Equation 1-5 defines, for a spherical crystallite of radius R, the region of intermediate character between that of a “molecule” and that of the bulk material (l is the lattice spacing)
l << R ≤ aB (1-5)
Charge carriers in semiconductor nanocrystallites are confined within three dimensions by the crystallite. In the case of ideal quantum confinement the wave function in eq. 1-1 has to satisfy the boundary conditions of
ψ (r ≥ R) = 0 (1-6) For nanoparticles the electron and hole are closer together than in the macrocrystalline material, and as such the Coulombic interaction between electron and hole cannot be neglected; they have higher kinetic energy than in the macrocrystalline material. On the basis of the effective mass approximation, Brus showed [57,68,69] for CdS or CdSe nanocrystallites that the size dependence on the
energy of the first electronic transition of the exciton (or the band gap shift with respect to the typical bulk value) can be approximately calculated using
2 2 2 2
1
1
1.8
2
e he
E
R
m
m
R
π
ε
⎡
⎤
Δ ≅
⎢
−
⎥
−
∗
∗
⎣
⎦
h
(1-7)Equation 1-7 is an analytical approximation for the first electronic transition of an exciton, which can be further described by a hydrogenic Hamiltonian,
2 2 2 2 2
2
e2
h e he
m
m
ε
re rh
∧ ∗−
−
Η =
∇ −
∇ −
∗
−
h
h
(1-8) In eq. 1-7 the Coulomb term shifts the first excited electronic state to lower energy, R−1, while the quantum localization terms shift the state to higher energy, R−2. Consequently, the first excitonic transition (or band gap) increases in energy with decreasing particle diameter. This prediction has been confirmed experimentally for a wide range of semiconductor nanocrystallites, [53-62] with a blue shift in the onset of the absorption of light being observed with decreasing particle diameter. Moreover, the valence and conduction bands in nanocrystalline materials consist of discrete sets of electronic levels and can be viewed as a state of matter between that of molecular and the bulk material.Equation 1-7 does not account for a number of other important effects observed in real nanocrystallites, [70] such as the coupling of electronic states and effects attributable to surface structure. Especially, the constants used in the model (the
effective masses and the dielectric constants) are those for macrocrystalline solids. The model is not quantitatively accurate and the corresponding calculations deviate from experimental values, especially for nanocrystallites with a very small size. In such particles the first electronic transition is located in a region of the energy band, in which the normal effective mass approximation is not valid. Although eq. 1-7 is not valid for all types of semiconductors, from a practical point of view, this model is particularly useful and the size-dependent energy shift for a number of nanocrystalline semiconductors can be qualitatively estimated. Furthermore, the model also provides a fundamental understanding of the quantum confinement effects observed in semiconductor nanocrystallites.
1.2.3 Introduction of the II-VI ZnS material
Zinc sulfide (ZnS) with an appearance of yellow-white powders has been utilized extensively as the phosphors. Two structures exist in ZnS materials, one is zinc blend or sphalerite(β-ZnS),the atomic arrangement is cubic structure as shown in Figure 1-24(a), and another is wurtzite(α-ZnS), the atomic arrangement is hexagonal structure as shown in Figure 1-24 (b). In nature, ZnS usually exists in the type of zinc blend, and if the environment temperature is higher than 1020 ℃ it will convert into wurtzite phase. No matter what type it is, the luminescence phenomena are all
observed [71].
The research of ZnS had been begun from 1866 in France. In 1920’s, several reports of influences on the activator (like Cu, Ag) and self-activated luminescence have been discussed. Since 1940, the investigations of the II-VI ZnS-based phosphors are active and abundant. In 1966, an article “100 anniversary of color ZnS” was published to show the importance of ZnS in an international conference. In 1990’s, Bhargava et al. [72] reported the properties of Mn2+ doped ZnS phosphors, and it has
been attracted a lot of attention [73-77]. Till now, the researches of ZnS-based phosphors have been never stopped. The usage of ZnS phosphors in the past time are used as the luminous paint. By adding different activators, ZnS-based phosphors with different emission energies [78] can be applied to many usages as shown in table 5-1. Now, due to the special photoelectric properties, the ZnS-based phosphors are widely used in photoelectric industry like photocatalyst, light emitting diode and high-density optical storage media.
1.2.4 Properties of nanostructure [79-82]
All materials are composed of proper chemical bonds with atoms, including metallic bond, ionic bond, covalent bond, Van der waal’s bond and hydrogen bond. The bonding length is the distance between two atoms as the net interaction force is zero. And the curve integrated by the net interaction force to the atom interval can obtain the lowest potential at this length of bonding. These bonding properties not only correspond to the mechanical properties of the materials but also the thermal properties. Solid status material is not just the agglomeration of atoms; the energy levels of each electron form the bonding orbits and anti-bonding orbits, and the number of orbit increases with the number of chemical bonding. As the number of orbit increases, the difference between the energy levels decreases and results in the continuous energy states. The distribution and value of the solid state energy level are highly related to the species and number of the bonding atoms, and influence the physics or chemical properties such as electric property, optical property, magnetic property and photoelectric properties. Nanostructure is the one-dimensional material with volume lies in 1 to 100 nm, including nanoparticles and quantum dots. In these nanomaterials, the number and distribution of the atoms change rapidly with the decrease in material size. Thus the bonding properties and the energy level properties is quite different from the bluk matrials. There are four effects such as surface effect,
small size effect, quantum size effect and quantum confinement effect listed below.
1.2.4.1 Surface effect
With the scale becomes small, the number of atoms on the particle surface increases. Because of these surface atoms are not completely coordinated, it is unstable and possesses high surface potential, thus, it possesses high chemical activity and easily bonds with other atoms. The activity effect of surface atoms is the major factor to produce the activity of the inert-noble metal catalyst. The number of near atoms on the particle surface is smaller than that inside the particle. With large ratio of the surface area, it will result in the reduction of the bonding length and the variation of the lattice arrangement. Because of the reduction in bonding length, the Curie temperature(Tc)therefore decreases with the smaller particle size. Besides, in tiny
metal particles, because the surface energy increases due to the particle shrinkage, the necessary heat to diffuse atoms is much smaller than the bulk materials. It is the reason why that the melting point of the metal nanoparticles decreases so fast.
1.2.4.2 Small size effect
In order to prevent the motion of dislocations, the decrease in particle size is applied. This method is applied to increase the mechanical intensity of the polycrystal.
In many materials, the σy (or hardness H) increases with the particle size decreased and can be expressed by the Hall-Pectch equation:
σy = σo + Kd-1/2 (1-8)
H = Ho + Kd-1/2 (1-9)
Where, σ0, H0 and K are the constants and d is the average particle diameter. In general, the value of K is positive, and σy or H is linearly proportional to the value of d-1/2. In the nanocrystals, however, the scale is close to the intervals of the near
dislocations, so the relation of the hardness and the particle size can not be explained by the above formula. It has the complex relations of positive K value, negative K value and mixed positive-negative K value. Due to the grain boundaries with great volume ratio in the nanocrystal, the plasticity, strike toughness and break toughness are improved. The high mechanical intensity and the super plasticity precise-ceramics could be obtained by controlling the crystal size at the critical range.
1.2.4.3 Quantum size effect
In the theorem of energy band, the energy levels of metal near the Fermi energy level is a continuous distribution. As the particle size decreases, it becomes to the discrete energy level. Furthermore, the Kubo theorem describes the relation between the interval of electron energy level δ and the diameter (d) of the metal nanoparticle:
3
4
1
3
FE
N
d
δ
=
−
(1-10) Where, N is the total number of the conduction electrons, EF is the Fermi level. Itcould see that the decrease in the particle diameter increases the energy of band gap. This quantum size effect results in the broadening of the energy band gap in the nanoscale semiconductors and the discontinuous energy level of the valence band and the conduction band. With a decrease in the size of the nanoscale semiconductor particle, the blue shift in the absorption spectrum is observed due to the enlargement of the energy band gap. The emission wavelength resulted from the energy band gap in the nanoscale semiconductor shifts to the short wavelength because of the broadening in the energy gap. In other word, the different emission color can be obtained by controlling size of the particles.
1.2.4.4 Quantum confinement effect
According to the Heisenberg uncertainty principle, the actual position and the momentum of an electron or a photon can not be obtained at the same time. If the electron is restricted in a small nanoscale space, the momentum range is wide. And if the momentum range is wide, average energy of the electrons is high. Thus on the boundaries of this range, there exists the phenomenon of quantization jumping, as shown in Figure 1-25. If the particle radius (r) of the nanoscale semiconductor is
smaller than the Bohr radius (aB) of the exciton, the average mean free path of
electron is restricted in a small space, then the electron and hole are easy to be combined to a excition. The absorption energy band of the excition resulted from the overlapping of the electron and hole’s wave functions not only has strong excitionic energy-band-gap absorption coefficient but also has great light emission phenomenon as being excited by light.
1.2.5 Emission theory
Luminescence is defined as a material absorbs the excitation energy, and then electrons transfer from the ground state to the excited state. As electrons return to the ground state and release energy in light, this phenomenon is called luminescence and can be explained by the configuration coordiance diagrams, as shown in Figure 1-26. [83].
When phosphors are excited by the ultraviolet light, part of the ultraviolet light will be reflected by the surface and the other part will be absorbed by the phosphor and transfer into luminescence radiation or the vibration of the lattice, as shown in Fig. 1-27.
The process which an electron absorbs energy, and then transfers from the ground state to the excited state is called excitation. The electron in the excited state
possesses higher energy so it is usually unstable and drives the electron to return to the ground state and release energy. The progress of this energy release is called “Relaxation”. There are two kinds of relaxation, one is radiative relaxation and another is nonradiative relaxation. The energy released in the progress of radiative relaxation is in the form of electromagnative radiation, in a word, it radiates electromagnative wave. When the wavelength of electromagnative wave is located in the range of visible light, we can observe the emission light lucid. And in the nonradiative relaxation, the energy is released in the form of “heat”. This type of relaxation will not emit light. The relaxation progress is shown in Figure 1-28. The relaxation progress can be described simply:
◆ Radiative Relaxation: The excited electron returns to the ground state and emits visible light.
◆ Nonradiative Relaxation: The excited electron returns to ground state and produces heat without emitting light.
According to the theorem of Franck-Condon, the speed of electron transfer is much fast so the distance R in nucleus almost unchanged. If the difference between the balance distance Ro in the ground and the balance distance R’o in the excited
state is ΔR = ( R’o ) - ( Ro ) as shown in Figure 5-5.