ISEE: INTERNET-BASED SIMULATION FOR
EARTHQUAKE ENGINEERING
PART I: THE DATABASE APPROACH
*Yuan-Sen Yang, Shiang-Jung Wang, Kung-Juin Wang,
Keh-Chyuan Tsai and Shang-Hsien Hsieh
National Center for Research on Earthquake Engineering, Taipei, Taiwan ysyang@ncree.gov.tw, sjwang@ncree.gov.tw, kjwang@ncree.gov.tw,
kctsai@ncree.gov.tw, shhsieh@ce.ntu.edu.tw
Abstract
Network technique begins to apply on earthquake engineering experiments to satisfy the potential demands on future structural experiments. An Internet-based environment, named ISEE (Internet-based Simulation for Earthquake Engineering) is being developed for collaborative networked pseudo-dynamic experiments among geographically distributed laboratories. Two approaches, namely, the Database Approach and the Application Protocol Approach, are prototyped to provide different solutions for network communication as well as collaborative framework in the ISEE. This paper is the first part of a two-part paper, which introduces the Database Approach in ISEE employing a database for experimental data exchange and repository, a web service for experiment setup and data sharing, Facility Controllers with tele-operation capability, an OpenSees-based Analysis Engine performing pseudo-dynamic analyses, and a real-time video system capturing and sharing the real-time video images through Internet to interested viewers. A series of networked pseudo-dynamic test examples using the Database Approach shows that the network and data processing costs about 0.2 seconds and 2 seconds per time step, around 20% and 70% of total elapsed time in domestic and transnational experiments, respectively, which is feasible for most of the low-speed pseudo-dynamic experiments.
BACKGROUND
Structural experiment plays an important role in the earthquake engineering research. In view of the continuous changes in structural engineering and the increasing awareness of cost in today’s society, the existing large-sized structural laboratories are gradually becoming incapable of satisfying the various types of demand of the experiments. Besides endlessly increasing the capacity of each laboratory, alternatively it would be more cost effective for different laboratories to collaboratively conduct such experiment. In addition, it would be more productive and can make most out of the experiment resources and results if experts around the world can participate in. Such demand can be
*
This paper is modified from a paper published at the International Workshop on Steel and Concrete Composite Construction (Yang et al., 2003.)
accommodated by the virtual laboratory. In the concept of virtual laboratory, each laboratory sited around the globe with different facilities becomes part of this virtual laboratory and participate jointly in the experiment. The participating researchers or general viewers could concurrently view the experimental results and launch discussions in a timely manner.
Recently, some research efforts have been made on developing the technology of collaborative structural experiments, allowing more than one laboratory can jointly conduct a test involving more than one specimen at different test sites. Japan and Korea have jointly conducted research investigating networked pseudo-dynamic experiments among laboratories in the two countries (Sugiura et al., 1998; Yun et al., 2000; Watanabe et al., 2001). The NEES (Network for Earthquake Engineering Simulation) project, which is initiated by the National Science Foundation of USA, also aims at exploring the tremendous benefits of sharing and integrating laboratory resources, including expensive equipments, experiment data, and simulation codes, via network (NEES, 2003; Mahin, 2002). The need for international collaborative structural experiments has become obvious in recent years. Therefore, the National Center for Research on Earthquake Engineering (NCREE) has launched research work on enhancing its experimental techniques from in-house operations to Internet-based single or multiple test-site collaborations. In addition, NCREE is developing the capability to join with other countries across the globe to perform collaborative experiments.
The key task in this research work is to develop the capability to perform distributed pseudo-dynamic experiments. The capability of performing distributed pseudo-dynamic experiments will be particularly valuable for evaluating the seismic performance of large-scale structure systems or components. It is applicable to slow pseudo-dynamic experiments, which the possible time lag among different laboratories collaboratively performing a distributed pseudo-dynamic experiment is acceptable.
A prototype of an Internet-based cooperative structural experimental environment, called ISEE (Internet-based Simulation for Earthquake Engineering), is constructed as the platform for a distributed pseudo-dynamic experiment. Under ISEE platform, two approaches, namely Database and Application Protocol Approaches have been applied. This paper mainly presents the overview of the Database Approach.
INTRODUCTION TO DATABASE APPROACH
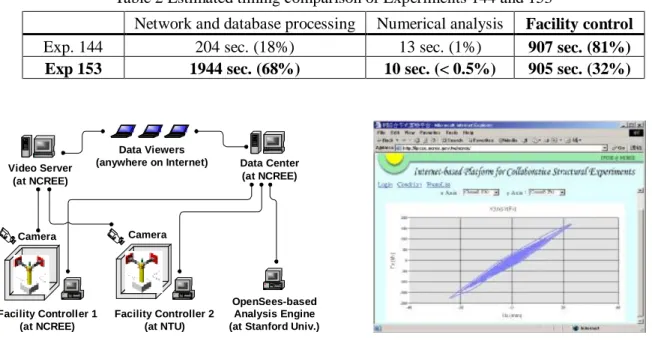
The ISEE framework with the database approach is composed of three major parts: the Data Center, the Facility Controllers, and the Analysis Engine (as shown in Fig. 1). The Data Viewers and the Cameras are accessory parts of the ISEE framework. More detailed discussions on these ISEE parts are given below.
Data Center
The Data Center serves as a data exchange hub and repository in ISEE database approach. All the experiment data and analysis data are gathered to the Data Center during and after a pseudo-dynamic test. The Data Center employs a database server to facilitate exchange of experimental or analysis data among different ISEE parts (or components) that may reside in laboratories at different geographical locations. The Data Center also provides a WWW (World-Wide Web) interface for viewers to browse the experiment data (Fig. 2) or researchers to setup required experimental parameters for collaborative networked structural tests before the experiment starts.
In this work, the Data Center employs the Microsoft SQL Server database and the IIS web server. In addition, for the C++ programs of the Analysis Engine and the Facility Controllers to easily communicate with the Data Center, a C++ class, named SQLAccess, is developed (Hsu, 2002) for incorporation into those C++ programs.
Analysis Engine
The Analysis Engine computes the dynamic responses of a structure by considering both the finite element analytical responses and the real experimental responses of the specimen. In a collaborative pseudo-dynamic test, the Analysis Engine performs a finite element dynamic analysis, in which the resisting forces of one or more elements are obtained from the measured specimen resisting forces in the laboratory. The Analysis Engine sends the computed displacements to the Data Center for sharing with the Facility Controller(s) or Data Viewers.
In this work, the Analysis Engine is based on a finite element analysis program, named OpenSees (OpenSees, 2003), which allows researchers to add new components (e.g., new element types or material models). A new element type, called pseudoGen2, deriving the ‘Element’ class in OpenSees, is implemented and added into the OpenSees framework. The element acts as actual specimen components in the finite element model by exchanging displacement and resisting forces with a Facility Controller through the Data Center. When each pseudoGen2 element is requested to return the resisting forces, it sends the element’s displacements to the Facility Controller through the Data Center, waits for the resisting forces returned from the Facility Controller through the Data Center, and returns it to the OpenSees component which sends the request.
A pseudoGen2 element acts as an actual specimen component in the finite element model by exchanging displacement and resisting forces with a Facility Controller through the Data Center. During each time step of the pseudo-dynamic analysis, the OpenSees calculates a predicted response, including the displacements, velocities, and accelerations of each node. Each pseudoGen2 element is then requested to return the dynamic resisting force in the predicted response. It gets the predicted displacements, sends them to the Data Center (so that the Facility Controller can push the specimen and measure the stiffness resisting forces), and gets the stiffness resisting forces. The dynamic resisting force of the pseudoGen2 is assembled with the stiffness resisting force, inertia forces, and the damping force. The inertia forces and damping forces are calculated by multiplying the acceleration and velocity vectors by the element mass and damping matrices, respectively, read from the user-specified file. The stiffness resisting force is the measured specimen resisting force, which reflects the nonlinear behavior of the specimen. After responding the dynamic resisting force, OpenSees calculates the displacement, velocity, and acceleration response of all nodes in the structures.
The pseudoGen2 supercedes its predecessor, pseudoGen1, to improve the time efficiency on multiple-sited experiments. The major difference between the pseudoGen1 and the pseudoGen2 is how they send the predicted displacements to the Data Center. During a dynamic analysis, the OpenSees queries the element resisting forces element-by-element, which makes all the facility controllers active one-by-one sequentially, and results in longer elapsed time on facility controlling. The pseudoGen2 overcomes the disadvantage by gathering pseudoGen2 elements’ data, sending out once, and receiving once at each time step. The detail description of the difference between pseudoGen1 and pseudoGen2 can be found in Yang et al. (2003) and Tsai et al. (2003,) and is not repeated here.
In this study, the Newmark-based Operator-Splitting (OS) method is employed by the Analysis Engine for the time integration of a pseudo-dynamic experiment. The concept of the OS method (Hughes and Liu, 1978) is to separate the damping and stiffness matrices into the implicit part and the explicit part. In the viewpoint of implementation, the only difference between the Newmark’s method and the OS method is that the latter one considers the nonlinear effects only on the unbalanced force, i.e., the parts in Eq. (1), but not on the effective matrix. In a pseudo-dynamic experiment, the explicit part denotes the nonlinear part of the damping and stiffness matrices of the specimen(s), while the implicit part is the rest of the damping and stiffness matrices. The effective matrix (see Eq. 1) does not change during an analysis. There is no nonlinear iteration solution scheme (such as Newton Raphson’s iteration) used in this work.
{
}
(
[ ]
[ ]
[ ]
)
(
{ }
1{ }
1)
1 2 1 + + − + = +γ∆ +β∆ − ∆ i i I i f ~ p K t C t M a (1) Facility ControllersThe Facility Controller is a software layer that can be used to drive the corresponding experimental facility in the laboratory. In a networked pseudo-dynamic experiment, the Facility Controller gets the displacement data from the Data Center, sends the displacements to the experimental facilities (servo hydraulic actuators), then receives restoring force data and sends them back to the Data Center. The control systems employed in NCREE Lab and NTU Lab are the MTS FlexTest IIm and MTS 407 controllers, respectively.
Network Fault Tolerance
A successful networked pseudo-dynamic experiment relies on network stability. Even a short period of network disconnection during an experiment may cut off the procedure of the experiment. In case of network disconnection during a network pseudo-dynamic experiment, the Analysis Engine and/or all Facility Controllers can not get the data they need, and the experiment will get suspended, even after the network is re-connected. It is not good to re-do a suspended experiment from the beginning if the specimen has been in nonlinearity status which behavior and properties may not be restored. However, typically the network between laboratories is Internet, which connection quality is not the focus of this research. To avoid of the failure of network pseudo-dynamic experiments caused by Internet disconnection, this research focuses on providing fault tolerance mechanism. A network fault tolerance solution is necessary for a network pseudo-dynamic test.
The fault tolerance solution in the Database Approach allows a re-start experiment to link with a previous suspended one. By setting the initial condition (including displacements, velocities, accelerations, material stress-strain histories) to the re-start experiment, we provide a solution so that a broken-off experiment can be followed by a re-start experiment. The initial condition of the re-start experiment is just the final condition of the suspended experiment. After the re-start experiment finishes, a complete experiment result is available by combining the experiment result of the suspended experiment and the re-start experiment.
In this research, pseudoGen2 element type provides a restart function to link with a previous suspended experiment. During a network pseudo-dynamic analysis, the pseudoGen2 elements export the element resisting forces and displacements step-by-step to restart output files, including the data flowing through the Analysis Engine, Data Center, Facility Controller(s), then back to Data Center, and Analysis Engine in each time step. After the data (of resisting force) flows back to the Analysis Engine, the pseudoGen2 elements append the displacements and forces to a restart file. In case of accident network disconnection, the experiment breaks off (see Fig. 3,) say, at the i-th step, the restart
output file would then contain the displacements and forces data of at least the previous (i-1) time steps. Also, the specimens are at the status of the (i-1)-th or the i-th step (depends on where the network disconnection happens.) To restart the suspended experiment, a new restart experiment has to be constructed in the Data Center. In the restart experiment, the Analysis Engine imports resisting forces from the restart output file of the suspended experiment, instead of the Data Center, from the first step through the (i-1)-th step (see Fig. 4.) It is supposed that the analysis result before the (i-1)-th step is exactly the same as those of the previous suspended experiment because the resisting forces fed into the Analysis Engine are exactly the same. After the i-th step, the Analysis Engine begins to send and receive data to Data Center, as it does in a normal experiment, until it completes the experiment. If the network disconnection happens again in a restart experiment, the restart solution can be applied again, until the whole experiment completes.
Other Accessory Parts
Anyone on the Internet can access the experimental data from the Data Center using a Data Viewer (actually a WWW browser, such as Microsoft Internet Explorer or Netscape Navigator) without installing any additional software. The viewers can browse the time history curves of displacements or resisting forces, or the hysteresis loop of the displacements and resisting forces of any specimens of any completed or in-progress experiments using the Database Approach of ISEE (for example, see Fig. 2.) With proper authorization, users can also get the plain numerical data of these displacements and resisting forces data from the Web page. With proper setup of Cameras and the Video Server, users can also see the real-time video images of the experiments. The Video Server also provides a WWW interface to the Data Viewers.
PSEUDO-DYNAMIC EXPERIMENTS USING DATABASE APPROACH
Several networked pseudo dynamic tests have been conducted to investigate the feasibility and efficiency of the proposed ISEE environment. Results of some of these tests can be found in (Tsai et al., 2003). These experiments show that ISEE (for both approaches) can be successfully applied to achieve collaborative networked pseudo dynamic tests on both Intranet and Internet settings.
BRB Frame Tests
In this work, the BRB (Buckling Restrained Braced) frame test is mainly to validate the feasibility of the networked pseudo-dynamic test functions of the prototype ISEE environment. The BRB specimen (settled at NCREE) had been used for evaluating the performance of the BRB components, which is described in other research reports (e.g., Tsai and Huang, 2002), and is not redundantly described in this paper.
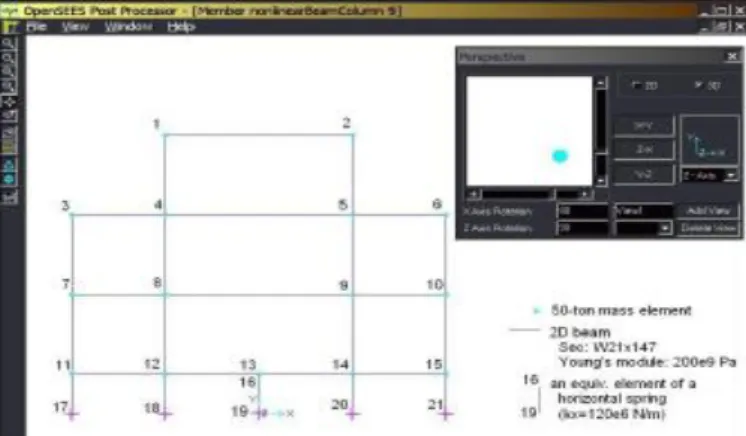
Figures 5 and 6 show the BRB (Buckling Restrained Braced) frame and the network configuration of the frame, respectively. The simulated structure is a 2D 3-bay 5-story building structure, which the BRB frame is conceptually located at the middle bay of the first floor (see Fig. 7.) The OpenSees simulates the structure vibrated by a 10-second ground motion with 0.005 seconds of time intervals. The detail of the numerical model can be found in the Tsai et al. (2003) can is not repeated here. In this test, the Data Center and the Facility Controller are located at NCREE. The Analysis Engine is placed at NCREE and Stanford University (USA) in two tests, respectively.
Figures 8 (a) and (b) show the elapsed time of each time step of the two tests, respectively. We can see there are several unusual peaks. The peaks may be caused by the following reasons:
computing resource of the Data Center. (2) Unknown network lag or instability. DSCFT Tests
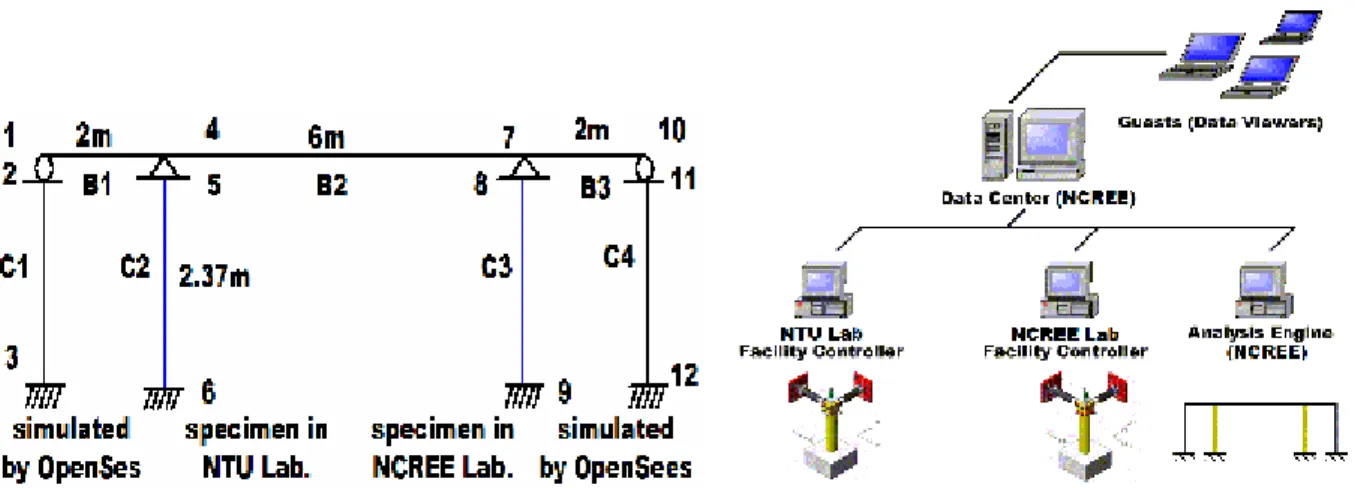
A series of two-sited sub-structural pseudo-dynamic tests were performed in this work to demonstrate the feasibility of the Database Approach in ISEE. The experiments simulate the responses of a four-pier bridge with a series of earthquake inputs. Each earthquake input consists of both X (North-South) and Y (East-West) directions. Three very rigid decks and two side piers (B1, B2, B3, C1 and C4 in Fig. 9) are numerically simulated by linear beam-column elements using the Analysis Engine. The two middle piers (marked C2 and C3 in Fig. 9) are simulated by two reduced-scale physical specimens, which locate at the National Taiwan University laboratory (NTU Lab) and the National Center for Research on Earthquake Engineering laboratory (NCREE Lab), respectively (see Fig. 11.) Figure 10 shows the network configuration of the bridge system.
In the experiments, ground motions along both X and Y acceleration histories are considered. Therefore, each specimen is installed at a corner of the reaction walls, with two actuators along X and Y directions, respectively, so that the specimen of a pier can be controlled (by displacements) and measured (with the resisting) along both the X and Y directions.
The middle span is 6m in length, and the two side spans are 2m in length. The height of each pier is 2.37m. In the longitudinal (NS or X) direction, node 1 and 10 of the bridge superstructure are roller-connected to node 2 and 9 of piers, while node 4 and 7 hinge-connected to node 5 and 8. In the transverse (EW or Y) direction, all 4 columns are hinge-connected to the span. Node 2 and 11 are lumped with a 21.5kN-s2/m mass in Y direction; node 5 and 8 are lumped with a 107.5 kN-s2/m mass in X direction and 86 kN-s2/m mass in Y direction. Vertical applied load on pier C1 and C4 is 211kN and that of pier C2 and C3 is 844kN respectively. These four bridge piers are all double skinned concrete filled steel tube (DSCFT) hollow columns (Tsai et al. 2002). In this experiment, C1 and C4 columns are simulated by using the pseudoGen2 elements developed in the ISEE work; C2 and C3 are DSCFT column specimens with a diameter of 0.5m and 0.3m for outer (5mm thick) and inner shells (3mm thick). Damping ratio is 0.03. Periods of the first and second modes are estimated as 0.75 and 0.53 second in the X and Y directions, respectively. Two intensities of earthquake are considered in the pseudo dynamic test program. The ground accelerations recorded in TCU082 station in the NS direction during the 1999 Chi-Chi earthquake were applied in X direction; while the TCU082 EW accelerations were applied in the Y direction. The time duration is 50 second and the time step is 0.02sec. Four earthquake inputs are used, which have the same patterns (TCU082 in Chi-Chi earthquake) with different PGA. The first level is 20% of the second level. The second level is 50% of exceeding probability in 50 years, which results in the PGAs of 0.0567g and 0.0696g in X and Y directions, respectively. The third level is 10% of exceeding probability in 50 years, which results in the PGAs of 0.173g and 0.209g in X and Y directions, respectively. The fourth level is 2% of exceeding probability in 50 years, which results in the PGAs of 0.216g and 0.262g in X and Y directions, respectively.
Table 1 lists four DSCFT experiments using the Database Approach. These experiments place Analysis Engine at different locations and employ different PGAs of earthquake ground motions. The earthquake inputs of the first two tests can be seen as small perturbations, which the specimens are supposed to keep in linear and elastic. The following four tests use gradually larger earthquake inputs, which is to observe the nonlinear behaviors of the DSCFT columns. This paper does not focus on the nonlinear behaviors of the columns, instead, on the performance and the feasibility of the network
framework. The detail of the nonlinear behavior of the DSCFT columns can be found in Yeh (2003.)
In experiment 153, the Analysis Engine was placed in the Stanford University, USA. As we expected, the network time becomes the major time cost in these international experiments. Comparing to the Exp. 144 (see Table 2,) the experiment 153 costs around 1700 seconds more time cost on network because of the network cost across the Pacific Ocean, that is, 1.7 seconds per time step.
The fault tolerance functionality described above is used in the last three experiments in Table 1. The earthquake input in experiment 155 is small, which we believe the specimen can be seen in linear and elastic, and the specimen restores to its initial condition after the experiment. But in the experiments 156 to 159, we assume that the structure suffers a 150-second earthquake, which is composed of three 50-second TCU082 earthquakes with different amplitudes (see Table 1.) The experiment 156 performs from 0.02 second to 50.0 seconds; experiment 157 performs from 50.2 to 72.0 seconds; the experiment 158 performs from 72.2 to 100.0; while experiment 159 performs from 100.2 to 150.0 seconds. The experiments 157 and 158 split because the experiment 157 broke off at time step 72.0 second due to an unexpected network disconnection. Figure 14 shows the time history of the displacement along the X direction of the experiments 156 to 159.
Large-scale RCS Frame Test
Researchers from the NCREE and Stanford University in US performed a full-scale composite moment frame using the ISEE environment. The test specimen is a three-story three-bay “RCS” moment frame, consisting of reinforced concrete (RC) columns and composite steel (S) beams. Measuring 12 meters tall and 21 meters long, the frame is among the largest frame tests of its type ever conducted (see Fig. 13.) The test is a one-site experiment. The detail of this test is available at a web page on http://rcs.ncree.gov.tw. The three-story prototype structure is designed for a highly seismic location either in California or Taiwan, following provisions for composite structures in the International Building Code 2000. The frame is loaded pseudo-dynamically using input ground motions from the 1999 Chi-Chi and 1989 Loma Prieta earthquakes, scaled to represent 50%, 10%, and 2% in 50-year seismic hazard levels.
Figure 14 shows the network configuration of the RCS test. An Analysis Engine performs a simple 3-DOF dynamic analysis, sends the displacements to, and gets resisting forces from the Data Center. Three actuators is controlled by the Facility Controller, which displacements are computed by the Analysis Engine and flow through the Data Center and the network. Three cameras setup at different places around the frame captures the real-time videos and send them to a video server. The Data Viewers, which can be anyone on the Internet, browse the experiment data through Data Center’s web service, and/or watch the real-time videos through the web service on the Video Server.
The experiment result can be found on the web page at http://rcs.ncree.gov.tw and does not repeat here. The time cost of the network transferring, data processing, or the dynamic analysis is not measured in this experiment.
SUMMARY
This paper introduces the Database Approach in the ISEE framework, which mainly consists of three major parts: Data Center, Analysis Engine, and Facility Controller(s). The Data Center is based on a Microsoft SQL Server and an IIS server. An Analysis Engine for distributed pseudo-dynamic experiments is tested. The Analysis Engine takes the advantage of the OpenSees object-oriented finite
element framework and adds a user-defined element in this study to allow using the measured restoring force of a specimen in a laboratory as its element restoring force. The Analysis Engine and the Facility Controller(s) connect with the Data Center through a C++ class consisting SQL database commands. All these components are integrated together.
Several pseudo-dynamic experiments are performed in this work to validate all components using the Database Approach in ISEE framework, including single-sited and multiple-sited experiments, full-structural and sub-structural pseudo-dynamic experiments, domestic and transnational experiments. The performance of the Database Approach is sufficient for most of the low-speed pseudo-dynamic experiments. In a domestic two-sited 3D pseudo-dynamic experiment (acrossing NTU and NCREE laboratories,) the network and data processing costs less than 20% of total elapsed time, while a transnational counterpart acrossing NCREE and Stanford University costs 70% of total elapsed time.
This research work is under continual development. Future work includes integrating the Database Approach and Application Protocol Approach, strengthening the security management, versatile data browsing and visualization, and domestic and international collaborations among laboratories.
ACKNOWLEDGEMENTS
The authors would like to acknowledge the support from National Science Council, Taiwan ROC. (Project No. NSC 91-2711-3-319-200.) Immense gratitude must be conveyed to Mr. Shih-Chung Kang at Stanford University in USA, who enthusiastically helped the authors to perform international DSCFT tests.
REFERENCES
Hsu, C. W. (2002), “Internet-based Platform for Collaborative Structural Experiments,” Master Thesis, Department of Civil Engineering, National Taiwan University, Taiwan ROC. (in Chinese) Hughes, T. J. R. and Liu, W. K. (1978), “Implicit-Explicit Finite Element in Transient Analysis:
Stability Theory,” Journal of Applied Mechanics, Vol. 45, pp. 371-374.
Mahin, S. (2002), “White Paper: Towards a Vision for the NEES Collaboratory,” NEES Consortium Development Project, Consortium of Universities for Research in Earthquake Engineering, USA. NEES (2003). “Network for Earthquake Engineering Simulation,“ Homepage web site:
http://www.nees.org/
OpenSees (2003), “Open System for Earthquake Engineering Simulation,” Homepage web site: http://opensees.berkeley.edu/
Sugiura, K., Nagata, N., Suzuka, Y., and Watanabe, E. (1998), “Internet Related Structural Testing,” Proceedings of The Eighth KKNN Seminar on Civil Engineering, Singapore, pp. 219-224.
Tsai, K. C., Hsieh, S. H., Yang, Y. S., Wang, K. J., Wang, S. J., Yeh, C. C., Cheng, W. C., Hsu, C. W., and Huang, S. K. (2003), “Network Platform for Structural Experiment and Analysis (I),” Technical report NCREE-03-021, National Center for Research on Earthquake Engineering, Taipei, Taiwan.
Tsai, K.C. and Huang, Y.C. (2002), “Experimental Responses of Large Scale Buckling Restrained Braced Frame”, CEER Report, Center for Earthquake Engineering Research, National Taiwan University, Taipei, Taiwan.
Tsai, K. C. and Yeh, C. C. (2003), “Networked Substructure Pseudo Dynamic Test of Double-Skinned CFT Bridge Piers under Bi-Directional Earthquakes (I),” Technical report NCREE-03-016, National Center for Research on Earthquake Engineering, Taipei, Taiwan. (in Chinese.)
Watanabe, E., Yun, C. B., Sugiura, K., Park, D. U., and Nagata, K. (2001), “On-Line Interactive Testing between KAIST and Kyoto University,” Proceedings of The Fourteenth KKNN Symposium on Civil Engineering, Kyoto, Janan, pp. 369-374.
Yang, Y. S., Wang, S. J., Wang, K. J, Tsai, K. C and Hsieh, S. H. (2003), “ISEE: Internet-based Simulation for Earthquake Engineering Part I: The Database Approach,” Proceedings of the International Workshop on Steel and Concrete Composite Construction, Oct. 8-9, Taipei, Taiwan, pp. 301-310.
Yun, C. B., Lee, I. W., Part, D. U, and Watanabe, E. (2000), “Remote Parallel Pseudo-Dynamic Testing on Base-Isolated Bridge Using Internet,” Proceedings of The Thirteenth KKNN Symposium on Civil Engineering, Taipei, Taiwan, pp. 87-92.
Table 1 Experiment list of the DSCFT Database Approach tests Exp. ID Earthquake PGAs Place of Analysis Engine
144 NS:0.0113g EW:0.0137g NCREE
153 NS:0.0113g EW:0.0137g Stanford University
155 NS: 0.0567g EW: 0.0696g NCREE
156 NS: 0.1730g EW: 0.209g NCREE
157/158* NS: 0.216g EW: 0.262g NCREE
159 NS: 0.173g EW: 0.209g NCREE
* Exp. 157 encountered an accident network disconnection and restarted by Exp. 158
Table 2 Estimated timing comparison of Experiments 144 and 153
Network and database processing Numerical analysis Facility control
Exp. 144 204 sec. (18%) 13 sec. (1%) 907 sec. (81%)
Exp 153 1944 sec. (68%) 10 sec. (< 0.5%) 905 sec. (32%)
Facility Controller 1 (at NCREE) Facility Controller 2 (at NTU) Data Center (at NCREE) Data Viewers (anywhere on Internet) OpenSees-based Analysis Engine (at Stanford Univ.) Camera Camera
Video Server (at NCREE)
Figure 1 Database Approach in ISEE Figure 2 ISEE Web showing real-time experiment data
Facility Controller
Analysis Engine Workstation Data Center
Experiment time Restart output file
Network message passing File I/O
Network disconnection!
Step1 ... Step(i-1) Step i
Facility Controller
Analysis Engine
Workstation Data Center
Experiment time Restart output file
Network message passing File I/O
Step1 ... Step(i-1) Step i Previous
restart file
Figure 3 An experiment encountering an accident network disconnection
Figure 4 A restart experiment completing a previously disconnected experiment
Data Viewers Data Center BRB Frame Facility Controller Analysis Engine Numerical model
Figure 5 The BRB Frame Figure 6 Network configuration of the BRB test
Figure 7 Analysis model of the BRB test (visualized using OSP; http://www.zevent.com)
Elapsed time of each step (Analysis Engine at NCREE)
0.00 0.50 1.00 1.50 2.00 1 201 401 601 801 1001 1201 1401 1601 1801 Time step E la p se d t im e (s ec .) ..
Elapsed time of each step (Analysis Engine at Stanford Univ.)
0.00 1.00 2.00 3.00 4.00 5.00 6.00 7.00 1 201 401 601 801 1001 1201 1401 1601 1801 Time step E la p se d t im e (s ec .) ..
(a) Analysis Engine at NCREE (b) Analysis Engine at Stanford University (USA) Figure 8 Elapsed time of each time step
Figure 9 Geometric configuration of the 4-pier bridge Figure 10 Network configuration of DSCFT tests
(a) In NTU (b) In NCREE
Displacement history (Ux) of Exp. 156 to 159
-100 -80 -60 -40 -20 0 20 40 60 0 50 100 150 Time (sec.) D is p . (m m )
Exp. 156 Exp. 157 Exp. 158 Exp. 159 broke out with an
unknown reason
Figure 11 Installation and section of a DSCFT pier
Figure 12 Time history of the displacement along X of Exps. 156 to 159
Figure 13 RCS Frame in NCREE Figure 14 Network configuration of the RCS test
Analysis Engine Data Center Video Server Facility Controller Data Viewers