Title: Frequent shopping by men and women increases survival in the older Taiwanese population.
YU-HUNG CHANG1, ROSALIND CHIA YU CHEN1, MARK L WAHLQVIST1,2,3, MEEI-SHYUAN LEE1,2
1Division of Health Policy Research and Development, Institute of Population Health Sciences, National Health Research Institutes, Zhunan, Miaoli County, Taiwan, ROC
2School of Public Health, National Defense Medical Center, Taipei, Taiwan, ROC 3Asia Pacific Health and Nutrition Centre, Monash Asia Institute, Monash University, Melbourne, Australia
Word count: 2977 words (excluding title page, licence statement, abstract, references, figures and tables.)
Running heading: Shopping increases survival in the elderly Key words: shopping, mortality, elderly
Corresponding author:
Dr. Yu-Hung Chang, Institute of Population Health Sciences, National Health Research Institutes, 35 Keyan Road, Zhunan, Miaoli county 350 Taiwan, ROC
Abstract
Background: Active ageing is a key to healthy ageing; shopping behaviour is an economically relevant activity of the elderly. Methods: Analysis was based on the NAHSIT 1999-2000 dataset. A total of 1841 representative free-living elderly Taiwanese were selected and information included demographics, socioeconomic status, health behaviours, shopping frequencies, physical function and cognitive function. These data were linked to official death records. Cox proportional hazard models were used to evaluate shopping frequency on death from 1999 to 2008 with possible covariate adjustment. Results: Highly frequent shopping, compared to never or rarely, predicted survival (hazard ratio(HR) = 0.54; 95% confidence interval(CI), 0.43-0.67); with adjustment for physical function and cognitive function and other covariates HR was 0.73 (95% CI, 0.56-0.93). Elderly who shopped everyday have 27% less risk of death than the least frequent shoppers. Males benefited more from everyday shopping than females, with decreased HR 28% versus 23%,
compared with the least. Conclusion: Shopping behaviour favourably predicts survivorship. Highly frequent shopping may favor men more than women. Shopping captures several dimensions of personal well-being, health and security, as well as contributing to the community’s cohesiveness and economy, and may represent or actually confer increased longevity.
Introduction
“Active ageing”, postulated by WHO in 2002, is defined as “the process of optimizing the opportunities of health, participation and security to enhance quality of life when people age”. In this definition, “active” refers to “continuing participation in social, economic, culture, spiritual and civic affairs, not just the ability to be physically active or to participate in labor force”.[1] This highlights the importance of engagement in a variety of activities by ageing people.
The conventional view of health promotion pays attention to physical activities which generate evident health benefits,[2-4] and recommended levels of physical activity have been made for older people.[5] Engagement in social and economic activities in later life also contributes to better health outcomes, including survival.[6-10] Social and economic activities may be as important as physical activities in healthy ageing.
The extent to which the elderly can participate in social and economic activities may be subject to their declining functional abilities, including impaired physical and mental functions, which may adversely affect survival. A higher level of engagement in these activities may improve functional health.[11-12] This raises the question as to whether more engagement in these activities, associated with reduced later mortality, merely reflects better base-line functional health, or alternatively, whether it contributes to survival independently of the contemporary functional status. The relationships of social activities to survival are confounded by functional health,[6, 8, 10] but, for some activities, there remains a significant effect on survival when functional health is taken into account.[6-7, 9-10] There is a question as to which activities benefit health and in which way these might vary in different settings. There is a need to examine associations between specific activities and their health outcomes.[7]
Among these activities, shopping is one with major economic relevance even when most of the aged have left the labor market. Shopping is consumptive insofar as it is intended to make
may spend varying times and monetary resources shopping according to personal and
environmental circumstances. Shopping is generally not a problem for younger elderly but creates difficulties for the very old [13] since those with severe functional limitations are less likely to shop; male elders spend more time shopping than do their female counterparts. [14] Retirees and the unemployed might spend more time in shopping or shop more frequently to avoid purchasing food at high prices.[15] Favourable characteristics of neighbourhood built environments could promote walking activity which is an essential component in shopping among elders.[16]
Shopping activity represents an important part of social and economic life for the aged. Yet its relationship to survival appears not to have been specifically evaluated. We have tested whether shopping activity, measured as frequency, can contribute to prolongation of later life, independent of physical and cognitive functions.[17] It is considered that women and men have different
purposes or patterns in shopping.[18] which might impact on health in different ways. In the present study we investigate gender difference in the relationship between shopping activity and long-term survival.
Methods
Study population
The present study used data from the Elderly Nutrition and Health Survey in Taiwan (NAHSIT Elderly), a nationally representative sample of the free-living elderly (65 and over), conducted in 1999 and 2000. Details of design and sampling for this survey can be found elsewhere.[19] The NAHSIT dataset was linked to 1999-2008 National Death Registration data to determine their survival status. All deaths that occurred between study entry and December 31, 2008 were included. A total of 1937 elderly persons completed the household interview and 1891 had a verifiable national identity number which would allow linkage to the National Death Registry. Thirty-nine, eight and three participants had no shopping data, unlikely response about their means of transport
or incorrect date of death, respectively. This left 1841 eligible participants for analysis. All
participants signed informed consent. The ethics committees of National Health Research Institutes and of Academia Sinica in Taiwan approved the study protocol.
Measurements
Shopping frequency was measured by the following question: “What is the frequency with which you go out shopping?” The response options were “never or less than once a week”, “once a week”, “2 to 4 times a week” and “everyday”.
Cognitive function was measured by the Short Portable Mental Status Questionnaire (SPMSQ) for assessing mental functioning of the elderly.[20] This test included 10 questions dealing with orientation, personal history, remote memory and calculations. A summary score ranged 0-10 can be categorised into: normal mental functioning and mild, moderate and severe cognitive
impairment. It was validated in a Taiwanese population.[21]
Physical function (PF) was measured by the physical functioning subscale of the SF-36 Health Survey in a validated traditional Chinese version.[22] The scale consists of 10 items evaluating inability in basic physical activities including moderate activities, vigorous activities, lifting or carrying, climbing flights, bending, kneeling and stooping, walking, and bathing or dressing. The scale outcomes were transformed into norm-based scores in which a higher score indicates better physical function.[23] We categorised the scores into four groups as <45, 45–53.9, 54–57.9 and 58 in regard to distribution. The categorical levels indicated various extents to which physical function was limited by a responder’s health. In this sample, for example, all of “PF58” were without any limitation in the 10 activities whereas 80% of “PF<45'” reported limitations in at least 7 activities.
Demographic, socio-economic status, and health behaviour variables used in the present study included age, gender, education, ethnicity, perceived financial status, working status, smoking, alcohol drinking and exercise. The number of comorbidities was scored according to the sum of 12
chronic diseases explored at interview to reflect general health status. A question about dinner companions was used as an indicator of social connectedness.[24] Means of transport and residential locality were also taken into account.
Survival time was the interval between the date of interview and the date of death or December 31, 2008 when censored for survivors.
Statistical analysis
All data were weighted to represent the elderly population in Taiwan during 1999-2000. The chi-square tests were used for categorical variables across shopping frequency groups. In multivariable analyses, the Cox proportional hazard models were used to assess the association between
predictors and survival time. In the models we treated those who never shopped or shopped less than once a week as the reference group. The models adjusting for physical function, cognitive function or both, revealed the influences of functional health on the relationship of shopping frequency to survival. Work status, perceived financial status and transport means were employed to adjust for leisure time, purchasing power and travel costs for shopping, respectively. A spurious correlation between shopping frequency and late mortality may occur for those who were very ill and unable to shop. Hence an additional model was created for a sub-sample which excluded participants who had great difficulty in shopping. Finally, the gender-shopping frequency
interaction terms were estimated to explore gender difference in the shopping-survival relationship. Since these models included relevant variables with different numbers of missing values, they had different case numbers. All analyses were performed using SAS statistical software version 9.1.3 and SUDAAN version 10.0 was used to adjust for the design effect of sampling.
Table 1 and Table 2 present demographics, baseline functional status and other study variables, and their distributions across four shopping frequencies. After weighting for representativeness of the participants, nearly half (48%) the elderly were those who never shopped or shopped less once a week, followed by frequent shoppers who shopped two to four times a week (22%) and everyday (17%); the lowest was 13% who shopped once a week. The majority of the study population were those aged less than 75 years (62%), males (54%), financially sufficient (76%), not working (90%), non-alcohol drinkers (74%), non-smokers (62%), and involved in frequent exercise (55%). The most popular transport means for outings was the private vehicle (47%) (Table 1). About one-fourth had the worst physical function status (PF<45) and less than a tenth had moderate and severe cognitive impairment. Deceased participants amounted to 37% during the study period and more than 60% of participants reported up to two chronic diseases. (Table 2).
Higher shopping frequencies (more than once a week) were associated with younger elders, male gender, high school and elementary school education, currently working and retired, dining with friends or neighbors, smoking, frequent exercise, better physical function and cognitive function, traveling by walking (p<0.05) (Table 1 and Table 2). These variables, except dinner companions, were also associated with later mortality (see Supplementary Table 1). They were potential confounders in multivariable analysis. Notably, there were more who had been inactive shoppers among the deceased (59%) and more frequent shoppers among survivors (43%), which indicates an inverse association between shopping frequency and later mortality (Table 2).
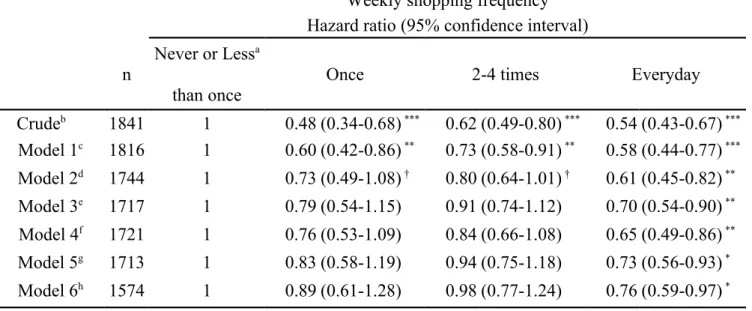
Table 3 shows the Cox models which predict survival time of the participants. Without any adjustment, the crude model shows that shopping once a week (hazard ratio (HR)=0.48; 95% confidence interval (CI), 0.34-0.68), two to four times (HR=0.62; 95% CI, 0.49-0.80) and shopping everyday (HR=0.54; 95% CI, 0.43-0.67) were associated with a lower mortality risk significantly comparing to no shopping activity (p<0.001 for all HRs). Likewise, Model 1 which adjusts for a set of essential covariates revealed that people who shopped more than once every week were at a
lower risk of mortality than those who did not. The lowest risk of mortality is 'everyday' (HR=0.58; 95% CI, 0.44-0.77). When financial status, work status and transport means were included,
'everyday' remains with a low HR of 0.61(95% CI, 0.45-0.82; p<0.01), but HRs for ‘once’ (HR=0.73; 95% CI, 0.49-1.08) and ‘two to four times’ (HR=0.80; 95% CI, 0.64-1.01) become higher and insignificant.
Controlling for physical function leads to an increment in relative risk for everyday shopping from 0.61 in Model 2 to 0.70 in Model 3 (95% CI, 0.54-0.90), whereas controlling for cognitive function results in a smaller increment to 0.65 (95% CI, 0.49-0.86). With adjustment for both functional variables in Model 5, 'everyday' predicts a HR of 0.73 (95% CI, 0.56-0.93) as the risk of death. Finally, in Model 6, which only includes the participants capable of shopping activity without considerable difficulty, daily shopping remains protective against mortality for even these, the healthier elders (HR=0.76; 95% CI, 0.59-0.97).
A gender-shopping frequency joint effect on survival was evident in a model with these interaction terms based on Model 5 (p<0.05). An equivalent model, where eight gender-shopping frequency combined categories were created as predictors, indicated different trends of HRs for males and females, as shown in Figure 1. For males, there was apparently a relative fall in HR to 0.72 with everyday shopping (28% less than inactive shoppers). By contrast, HRs continuously decreased with increased shopping frequencies for women from 0.69 to 0.53 (23% less than inactive shoppers). Despite the gender differences at each shopping frequency, the HR trends seem
downward for both men and women.
Discussion
We explored whether shopping activity could predict long-term survival in an elderly population, and whether the effect would remain when functional limitations were considered. Modeling with different sets of covariates and with subset data demonstrated the robustness of the finding that
highly frequent shopping activity predicts survival among elderly Taiwanese. The desirable effect of shopping activity is likely to benefit from physical and/or cognitive functions which were evaluated in the present study.
In the present study, moderately frequent shoppers (one to four times a week) had a lower risk in mortality than inactive shoppers probably due to better health. Therefore, when physical and cognitive functions were considered, the reduction in mortality associated with shopping activity was diminished. These findings are consistent with those of previous studies.[6-8, 10] Moderate shopping participation may be mainly to do with the purchase of necessities; its restriction could represent compromised function. Moreover, an elder who shops less food would be at risk of poorer diet quality, necessary to maintain health.[25-27] A vicious cycle which involves limited shopping and poor diet could evolve for elders.
Everyday shoppers had a favourable survival even with control for functional health, which implies that greater participation in activities generates more health benefits.[28] It is possible that daily shopping might have a direct impact on survival or enhance socio and psycho-biological pathways which mediate between shopping activity and survivorship, and not only reflect better functional health. Health benefits might be generated through frequent shopping activity in many ways.
Making purchases may not be the main purpose in shopping for elders.[29] This might be reflected in the fact that shopping frequency was not constrained by purchasing power which was measured by perceived financial status (Table 1). Elderly people may window shop, obtain
prescribed drugs, bank, or walk for exercise, seek companionship and avoid loneliness. Fulfillment of these purposes may generate various health benefits. For example, elders may maintain a mall walking routine, perhaps regarded as shopping activity, although more to do with the need to belong to a community or keep physically active in a safe and convenient environment.[30] In shopping venues, socialising with or watching others can provide social and mental benefits.[31] Loneliness
may be ameliorated through relationships away from home in commercial venues which nevertheless provide opportunities for companionship and emotional support.[32] The present study, however, does not assess these roles for shopping and, therefore, cannot assign relative importance to them.
We found gender difference in the relationship between shopping and survival. The population attributable risk for mortality attributed to shopping inactivity as opposed to everyday shopping was 21% for men and 48% for women (data not shown). In multiple regression analysis, the mortality risk of males was reduced by up to 28% with everyday shopping, while it was 23% for females. The non-linear trend for the mortality HR for men to decrease with increased shopping frequency (the upwards relationship contour for men who shopped two to four times a week) may reflect complex shopping-related behaviours. For example, men, who smoke or drink alcohol more than women, might shop for these alone, or look for an excuse to consume them away from home; in these situations there will be competing risks between putatively favourable shopping activity and the adverse consequences of what it may entail. This viewpoint was supported by the findings of our study that current smokers and alcohol drinkers were a higher percentage in the higher shopping frequency groups (two to four times and everyday) than those who were never smokers or habitual drinkers of alcohol (Table 1), and that more men than women consumed cigarettes (men 39% vs. women 3%) and alcohol (men 31% vs. women 5%).
Missing values in multivariable analysis might have challenged the representativeness of our final sample. From the crude model to Model 5(the full model), participants in the analysis fell to 1713 from 1841 due to incomplete questionnaire responses. Compared to the total sample (1937 participants), although those excluded tended to be older elderly, women, have lower education and worse functional status, but there was negligible difference in the demographics or in variables of interest between those included in the full model and the total sample (see Supplementary Table 2).
The sub-sample used in the multivariable models was representative of the total study population and secured the internal validity required.
Study limitations to be canvassed include the interpretation of shopping as a method of social engagement. It correlates with other social activities which have been inadequately documented in our study. However, we have used dining together as a surrogate for non-shopping social activity or networks and adjusted for it. Even so, shopping, as a predictor of survival, would capture various social engagement variables. Further investigation of the shopping-independent and combined effects with a range of societal factors on mortality is warranted.
Another interpretative limitation is that shopping might also improve functional health, but the reverse may also be possible or the link bidirectional. Because these variables, and others at baseline, were cross-sectional, we are unable to explore the question of causality further.
A greater understanding of the psycho-social aspects of shopping would help clarify our findings. Shopping is often for pleasure with the potential to increase psychological wellbeing. Compared to other types of leisure-time physical activity, like formal exercise, which usually requires motivation, and sometimes professional instruction, shopping activity is easier to undertake and maintain. Its informality makes it a more attractive alternative than more prescriptive
approaches to healthy ageing.
What is already known
Physical activities along with engagement in social and economic activities have been recognised as vital for healthy ageing, but few studies have investigated whether there is a link between shopping behaviour and long-term survival among the elderly.
What this study adds
When taking account of cognitive and physical function, the favourable effect remained. Elderly men benefited more from everyday shopping activity than did elderly women.
Acknowledgements
This study was sponsored by the Department of Health and National Health Research Institutes (PH-PP22), Taiwan. The data set was developed by Drs. Wen-Harn Pan and Su-Hao Tu at
Academia Sinica. Y.H. Chang planned the study, supervised the data analysis, and wrote the paper. R. Chen performed all statistical analyses and helped to revise the paper. M. Wahlqvist and M.S. Lee contributed to and revised the manuscript.
Competing interests
No author has any conflict of interest in regard to this paper.
Licence statement
The Corresponding Author has the right to grant on behalf of all authors and does grant on behalf of all authors, an exclusive licence (or non-exclusive for government employees) on a worldwide basis to the BMJ Group and co-owners or contracting owning societies (where published by the BMJ Group on their behalf), and its Licensees to permit this article (if accepted) to be published in Journal of Epidemiology and Community Health and any other BMJ Group products and to exploit all subsidiary rights, as set out in our licence. (http://group.bmj.com/products/journals/instructions-for-authors/licence-forms).
References
1. World Health Organization, and world assembly on ageing. Active ageing: a policy framework. Geneva, Switzerland: World Health Organization 2002:12.
2. Rakowski W, Mor V. The association of physical activity with mortality among older adults in the Longitudinal Study of Aging (1984-1988). J Gerontol 1992;47:122-9.
3. Brown DW, Balluz LS, Heath GW, et al. Associations between recommended levels of physical activity and health-related quality of life. Findings from the 2001 Behavioral Risk Factor Surveillance System (BRFSS) survey. Prev Med 2003;37:520-8.
4. Pate RR, Pratt M, Blair SN, et al. Physical activity and public health: a recommendation from the Centers for Disease Control and Prevention and the American College of Sports Medicine. JAMA 1995;273:402.
5. Nelson ME, Rejeski WJ, Blair SN, et al. Physical activity and public health in older adults: recommendation from the American College of Sports Medicine and the American Heart Association. Circulation 2007;116:1094-105.
6. Glass T, de Leon C, Marottoli R, et al. Population based study of social and productive activities as predictors of survival among elderly Americans. Brit Med J 1999;319. 7. Menec VH. The relation between everyday activities and successful aging: a 6-year
longitudinal study. J Ger Series B: Psycholog Sci Soc Sci 2003;58:74-82.
8. Lennartsson C, Silverstein M. Does engagement with life enhance survival of elderly people in Sweden? The role of social and leisure activities. J Ger Series B: Psycholog Sci Soc Sci 2001;56:335-42.
9. Bennett KM. Low level social engagement as a precursor of mortality among people in later life. Age Ageing 2002;31:165-8.
10. Walter-Ginzburg A, Blumstein T, Chetrit A, et al. Social factors and mortality in the old-old in Israel: the CALAS study. J Ger Series B: Psycholog Sci Soc Sci 2002;57:308-18.
11. Buchman AS, Boyle PA, Wilson RS, et al. Association between late-life social activity and motor decline in older adults. Arch Intern Med 2009;169:1139-46.
12. Fratiglioni L, Paillard-Borg S, Winblad B. An active and socially integrated life style in late life might protect against dementia. Lancet Neurol 2004;3:343-53.
13. Fjellström C, Sidenvall B, Nydahl M. Food intake and the elderly – social aspects. In: Frewer L, Risvik E, Schifferstein H, eds. Food, people, and society: a European perspective of consumers' food choices. Berlin: Springer 2001:197-10.
14. Bennett K. Gender and longitudinal changes in physical activities in later life. Age Ageing 1998; 27:24-8.
15. Aguiar M, Hurst E. Consumption vs. expenditure. J Polit Econ 2005;113:919-948.
16. Li F, Fisher KJ, Brownson RC, et al. Multilevel modelling of built environment characteristics related to neighbourhood walking activity in older adults. Journal of Epidemiology and Community Health 2005;59:558-64.
17. Rowe JW, Kahn RL. Successful Aging. Gerontologist 1997;37:433-40.
18. Campbell C. Shopping, pleasure and the sex war. In: Falk P, Campbell C, eds. The shopping experience. London: Sage Publications 1997:166-76.
19. Pan WH, Hung YT, Shaw SS, et al. Elderly nutrition and health survey in Taiwan (1999-2000): research design, methodology and content. Asia Pac J Clin Nutr 2005;14:203–210. 20. Pfeiffer E. A short portable mental status questionnaire for the assessment of organic brain
deficit in elderly patients. J Am Geriatr Soc 1975;23:433-41.
21. Hsiao SH, Chiu HC, Liu HW. A replication of multidimensionality of Activities of Daily Living (ADL): on the elderly in Southern Taiwan. Kaohsiung J Med Sci 1994;10:449-457. (in Chinese)
22. Lu JF, Tseng HM, Tsai YJ. Assessment of health-related quality of life in Taiwan (I): development and psychometric testing of SF-36 Taiwan version. Taiwan J Public Health 2003; 22:501-511. (in Chinese)
23. Ware JE, Kosinski M, Dewey JE. How to Score Version 2 of the SF-36® Health Survey. Lincoln, RI: QualityMetric Inc. 2000:27-48.
24. Sobal J. Sociability and meals: facilitation, commensality, and interaction. In: Meiselman, HL ed. Dimensions of the meal: the science, culture, business, and art of eating. Gaithersburg, MD: Aspen Publishers 2000:143-60.
25. Lee MS, Lai CJ, Yang FY, et al. A global overall dietary index: ODI-R revised to emphasize quality over quantity. Asia Pac J Clin Nutr 2008;17:82-86.
26. Aparicio Vizuete A, Robles F, Rodríguez-Rodríguez E, et al. Association between food and nutrient intakes and cognitive capacity in a group of institutionalised elderly people. Eur J Nutr 2010;49:293-300.
27. Kart CS, Metress EK, Metress SP. Human aging and chronic disease. Boston, MA: Jones and Bartlett 1992:183-96.
28. Lemon BW, Bengtson VL, Peterson JA. An exploration of the activity theory of aging: activity types and life satisfaction among in-movers to a retirement community. J Gerontol 1972; 27:511-23.
29. Timothy DJ. Shopping tourism, retailing, and leisure. Clevedon, UK: Channel View Publications 2005:15-41.
30. Duncan H, Travis S, McAuley W. The meaning of and motivation for mall walking among older adults. Activ Adapt Aging 1995;19:37-52.
31. Graham DF. Going to the mall: a leisure activity of urban elderly people. Can J Aging 1991; 10:345-58.
32. Rosenbaum M. Exploring the social supportive role of third places in consumers' lives. J Serv Res 2006;9:59-72.
Table 1
Demography, study variables and their distributions by shopping frequencies in NAHSIT 1999-2000 participants. a (n=1841)
Descriptor
Weekly shopping frequency (%)
Pc nb
Less than once
Once 2-4 times Everyday
Total 1841 48.0 13.0 22.3 16.7 Gender <0.001 Male 933 42.5 12.5 24.3 20.7 Female 908 54.4 13.6 20.1 12.0 Age at baseline <0.001 65-69 yrs 606 38.9 16.8 24.8 19.5 70-74 yrs 637 44.0 13.3 26.3 16.5 75-97 yrs 598 58.4 9.8 17.1 14.7 Education 0.004 Illiterate 635 59.3 11.4 17.2 12.1
Elementary school and below 820 40.8 13.3 24.6 21.2
High school 317 38.4 15.4 29.3 16.9
College and above 62 59.6 11.5 15.4 13.6
Ethnicity 0.7
Non indigenous 1652 48.1 12.8 22.4 16.7
Indigenous 187 43.8 20.4 21.8 14.1
Perceived financial status 0.1
Enough or just enough 1242 46.3 14.0 22.9 16.9
Some difficulty 439 48.8 10.9 24.2 16.0 Very difficult 100 58.0 7.4 12.9 21.7 Smoker <0.001 Never 1192 51.3 14.0 21.3 13.4 Former 235 43.1 11.5 21.4 24.0 Current 405 42.3 11.5 25.4 20.9 Alcohol drinker 0.2 No 1344 50.8 12.8 21.1 15.3 Former 124 43.3 13.6 27.1 16.0 Current 369 39.1 14.0 25.1 21.8 Exercise frequently 0.003 No 900 56.6 11.2 17.2 15.0 Yes 939 41.0 14.5 26.5 18.0 Dinner companions <0.001 Self 322 48.6 10.8 20.9 19.7 Spouse 694 39.4 14.4 27.4 18.8
Children and relatives 811 55.2 12.7 18.4 13.7
Friends or neighbors 10 6.5 17.7 57.7 18.1
Transportation <0.001
Private vehicle (motorcycle or car) 888 45.8 15.1 23.9 15.2
Public 418 45.2 17.9 22.4 14.6
Bicycle 161 37.3 12.5 28.5 21.7
Walking 232 33.5 8.1 26.3 32.1
Current work status 0.01
Yes 173 31.7 21.5 29.8 17.1
Retired 1032 46.3 11.5 23.1 19.1
Housewife 531 56.0 13.0 19.8 11.3
Never employed 91 63.5 16.1 9.4 11.1
Duration of observation (median, yrs) 8.5 8.8 8.8 8.8
a % are weighted to reflect their representation in the population.
b Total sample size is 1841; cases with missing values were not included for the relevant variable. c Chi-square test by SUDAAN program.
Table 2
Baseline functional status, comorbidity, survivorship and their distributions by shopping frequencies in NAHSIT 1999-2000 participants. a (n=1841)
Descriptor
Weekly shopping frequency (%)
Pc nb
Less than once
Once 2-4 times Everyday
Physical functioning <0.001 <45 470 70.8 5.7 13.8 9.7 45-53.9 572 45.3 13.1 23.5 18.2 54-57.9 496 38.2 16.6 26.6 18.7 58 271 29.0 19.4 28.5 23.1 SPMSQ <0.001 Normal 1467 41.8 14.4 24.7 19.0 Mild 167 65.2 10.7 14.8 9.4 Moderate 153 79.6 3.8 12.3 4.3 Severe 26 90.6 1.3 2.1 6.0 Number of comorbidities 0.5 0 335 45.9 16.1 17.5 20.5 1-2 840 47.4 13.0 23.9 15.8 3-5 559 49.9 11.8 22.2 16.2 6 107 48.7 10.3 26.6 14.4 Survivorship <0.001 Deceased 683 58.5 9.0 20.0 13.0 Survivors 1158 41.8 15.4 24.0 18.9
Mortality ID per 1000 person-year 63.8 38.4 40.2 35.6
ID, incidence density.
a % are weighted to reflect their representation in the population.
b Total sample size is 1841; cases with missing values were not included for the relevant variable. c Chi-square test by SUDAAN program.
Table 3 The relationships between shopping frequency and risk of death
Weekly shopping frequency
Hazard ratio (95% confidence interval) n
Never or Lessa than once
Once 2-4 times Everyday
Crudeb 1841 1 0.48 (0.34-0.68) *** 0.62 (0.49-0.80) *** 0.54 (0.43-0.67) *** Model 1c 1816 1 0.60 (0.42-0.86) ** 0.73 (0.58-0.91) ** 0.58 (0.44-0.77) *** Model 2d 1744 1 0.73 (0.49-1.08) † 0.80 (0.64-1.01) † 0.61 (0.45-0.82) ** Model 3e 1717 1 0.79 (0.54-1.15) 0.91 (0.74-1.12) 0.70 (0.54-0.90) ** Model 4f 1721 1 0.76 (0.53-1.09) 0.84 (0.66-1.08) 0.65 (0.49-0.86) ** Model 5g 1713 1 0.83 (0.58-1.19) 0.94 (0.75-1.18) 0.73 (0.56-0.93) * Model 6h 1574 1 0.89 (0.61-1.28) 0.98 (0.77-1.24) 0.76 (0.59-0.97) * Hazard ratios were estimated by the Cox proportional-hazards model.
Significance is shown by †P<0.1, * P<0·05, ** P<0·01, ***P<0·001. a Never or less than once as reference group.
b Likelihood ratio 2=59.3 at 3 df, p<0.01.
cAdjusted for gender, age, education, ethnicity, alcohol drinking, smoking, exercise, dinner companions, comorbidity, and region. Likelihood ratio 2=292.9 at 33 df, p<0.01.
dAdjusted by Model 1 covariates plus perceived financial status, work status, and transportation. Likelihood ratio 2=346.4 at 42 df, p<0.01.
eAdjusted by Model 2 covariates plus physical functioning. Likelihood ratio 2=384.4 at 45 df, p<0.01.
fAdjusted by Model 2 covariates plus SPMSQ. Likelihood ratio 2=388.6 at 45 df, p<0.01.
g Adjusted by Model 2 covariates plus physical functioning and SPMSQ. Likelihood ratio 2=412.6 at 48 df, p<0.01.
h Model 5 for a sub-sample which excluded those who were unable to shop due to difficulty. Likelihood ratio 2=273.6 at 48 df, p<0.01.
Figure 1. Hazard ratios for eight gender-shopping categories from the model adjusted by age, education, ethnicity, alcohol drinker, smoker, frequent exercise, region, dinner companions,
perceived financial status, comorbidity, work status, transportation, physical function and SPMSQ. Significance is shown by †P<0.1, * P<0·05, ** P<0·01, ***P<0·001.Interaction of shopping frequency and gender P =0.02