Advance Access publication November 1, 2011
Olfactory Impairment in an Adult Population: The Beaver Dam Offspring
Study*
Carla R. Schubert
1, Karen J. Cruickshanks
1,2, Mary E. Fischer
1, Guan-Hua Huang
3,
Barbara E. K. Klein
1,2, Ronald Klein
1,2, James S. Pankow
4and David M. Nondahl
1 1Department of Ophthalmology and Visual Sciences, University of Wisconsin School of
Medicine and Public Health, 610 Walnut Street, Madison, WI 53726, USA,
2Department of
Population Health Sciences, University of Wisconsin School of Medicine and Public Health, 610
Walnut Street, Madison, WI 53726, USA,
3Institute of Statistics, National Chiao Tung University,
Hsinchu 30010, Taiwan and
4Division of Epidemiology and Community Health, University of
Minnesota School of Public Health, 1300 S. 2nd Street, Minneapolis, MN 55454, USA
Correspondence to be sent to: Carla R. Schubert, 610 Walnut Street, Room 1087 WARF, Madison, WI 53726-2336, USA. e-mail: schubert@episense.wisc.edu
*Preliminary analyses from this research were presented as a poster at the 31st Annual Meeting of the Association for Chemoreception Sciences, 23 April 2009, Sarasota, FL.
Accepted October 4, 2011
Abstract
The objective of this study was to determine the prevalence of olfactory impairment and associated risk factors and the effects of olfactory impairment on dietary choices and quality of life. Odor identification was measured in 2838 participants aged 21– 84 years (mean 49 years) in the Beaver Dam Offspring Study. The overall prevalence of olfactory impairment was 3.8%, increased with age (from 0.6% in those <35 years to 13.9% among those‡65 years) and was more common in men than women. In a multivariate model age (odds ratio [OR] = 1.48, 95% confidence interval [CI] = 1.33, 1.64 for every 5-year increase), nasal polyps or deviated septum (OR = 2.69, 95% CI = 1.62, 4.48), ankle-brachial index < 0.9 (OR = 3.62, 95% CI = 1.45, 9.01), and smoking (women only) (OR = 2.43, 95% CI = 1.19, 4.98 ever smoked vs. never) were associated with an increased odds of olfactory impairment, whereas higher household income, ‡$50 000 versus <$50 000 per year, was associated with a decreased odds of olfactory impairment (OR = 0.48, 95% CI = 0.31, 0.73). Participants with olfactory impairment were less likely to report that food tasted as good as it used to, or that they experienced food flavors the same. There was no association between olfactory impairment and general health-related quality of life, depressive symptoms, or dietary choices. The prevalence of olfactory impairment was low in this largely middle-aged cohort, and some factors associated with olfactory impairment are potentially modifiable.
Key words: epidemiology, olfaction, quality of life, smell disorders
Introduction
The sense of smell is responsible for a number of functions including identification and enjoyment of the flavor of foods and odors as well as recognition of hazards in the environ-ment, such as toxins, smoke, and spoiled food. Impairment of olfactory ability therefore has the potential to diminish enjoyment of food and quality of life, affect food choices and may increase the risk for exposure to environmental haz-ards (Santos et al. 2004). This is of concern because, in the few population-based studies, olfactory impairment has been found to be common, especially in older adults. In a
popula-tion-based study of adults 53 years and older (n = 2491), the prevalence of olfactory impairment was 25% (Murphy et al. 2002). In studies that included younger adults, the prevalence has been only slightly lower; a study in Sweden of adults 20 years of age (n = 1387) and older found a prevalence of 19% with olfactory dysfunction (Bramerson et al. 2004), whereas a study in Germany (n = 1312) found a prevalence of either hyposmia or anosmia to be 22% (Vennemann et al. 2008).
Olfactory testing was done as a part of the Beaver Dam Offspring Study (BOSS), a study of familial and birth cohort ª The Author 2011. Published by Oxford University Press. All rights reserved.
effects on the aging senses in adults aged 21–84 years. The purpose of this paper is to report the prevalence of olfactory impairment across the adult age spectrum in the general pop-ulation, ascertain associated risk factors for impairment, and determine the association of olfactory impairment with food enjoyment, dietary choices, and quality of life.
Materials and methods
The BOSS is a study of age-related sensory disorders in the adult children (aged 21–84 years) of participants in the Ep-idemiology of Hearing Loss Study (EHLS), an ongoing (1993 to present) population-based longitudinal study of hearing, olfaction, cognition, and aging (Cruickshanks et al. 1998). The details of the EHLS and BOSS have been previously reported (Cruickshanks et al. 1998, 2003, 2010;
Zhan et al. 2010). The baseline BOSS examination (n = 3285; 2005–2008) included measures of hearing, vision, ol-faction, taste, cognition and cardiovascular health, ocular images of the retina and lens, and an extensive questionnaire. Study examiners were trained and certified in the data col-lection for all protocols. Written informed consent was ob-tained from participants prior to examination, and the study was approved by the Health Sciences Internal Review Board at the University of Wisconsin.
The San Diego Odor Identification Test (SDOIT) was used to measure olfaction. The SDOIT is a standardized test with good reliability (test–retest agreement of 96% for classifying olfactory impairment; concordance correlation coefficient of 0.85 [95% confidence interval, CI = 0.79, 0.91] for score), has been shown to be comparable to the Brief Smell Identi-fication Test (B-SIT) for classifying olfactory impairment (Krantz et al. 2009), and has been used previously in a large epidemiological study (Murphy et al. 2002; Schubert et al. 2009). The specific SDOIT methods have been previously re-ported (Murphy et al. 2002;Krantz et al. 2009;Schubert et al. 2009;Raynor et al. 2010). The SDOIT consists of 8 common odorants. A picture array with illustrations of all the odorants plus 12 distracters is available to aid in identification. Prior to the test, participants are asked to identify the pictures in the array. Odorants are presented in a random order and in a man-ner that prevents visual cues, with a 45 s lag between presen-tations to minimize adaptation. Participants may say the name of the odorant or point to the picture representing the odorant. If an odor is not identified, the participant is given the correct name of the odorant, and it is presented later in the test sequence to allow for learning of unfamiliar odors. The SDOIT score is the number of odors correctly identified after 2 trials. Olfactory impairment was defined as identifying fewer than 6 of the 8 odorants correctly (Murphy et al. 2002;
Schubert et al. 2009). This definition of olfactory impairment is the same as was used in the EHLS where 95% of the youn-gest age group (age 53–59 years) with no report of recent sinus problems scored 6 or higher on the SDOIT (Murphy et al. 2002). A score less than 6 also corresponds to roughly 2
stan-dard deviations (SDs) below the mean score among the younger participants (21–44 years) in the current study.
Quality of life was assessed using the Medical Outcomes Study Short Form Health Survey (SF-36) (Ware et al. 1993,1994), which was administered by trained interviewers. These 36 questions ascertain function, well-being, disability, and personal evaluation for both physical and mental health. The questions are grouped into 8 domains and 2 summary scores, the Mental Component Scale (MCS) and the Physical Component Scale (PCS) that consolidate the various aspects of quality of life. The scores range from 0 to 100 with higher scores indicating better quality of life. Participants self-completed the Center for Epidemiological Studies Depres-sion Scale (CES-D) for depressive symptoms (Radloff 1977). The CES-D consists of 20 items, which measure depres-sive symptoms. Participants were asked to indicate how often they experienced each symptom in the last week on a 4-point scale (0–3). Higher total scores are indicative of more depres-sive symptoms, and a score greater than 15 is suggestive of mild to moderate depressive symptoms (Radloff 1977).
Two questions were used to assess the impact of olfactory impairment on the enjoyment of food: ‘‘Do foods you eat now taste as good as when you were younger?’’ and ‘‘Do you experience food flavors (e.g., chocolate, vanilla) the same as you used to?.’’ Dietary choices were assessed by 4 questions, ‘‘About how many servings of vegetables do you eat (aside from salad and potatoes)?,’’ ‘‘About how many servings of fruit do you eat (aside from juices)?,’’ ‘‘How often do you add salt to foods?,’’ and ‘‘How often do you add sugar or sugar substitutes to foods or bever-ages?.’’ For all 4 questions, participants were able to choose from a wide range of responses from ‘‘Never’’ and ‘‘less than once a week’’ up to ‘‘4 or more (times) per day.’’ For these analyses, the items were collapsed into 2 categories of ‘‘<1 serving per day’’ and ‘‘1 or more servings per day’’ for veg-etable and fruit intake and ‘‘less than once per day’’ and ‘‘one or more times per day’’ for adding sugar and salt to foods. Other measures obtained relevant to the current research included height, weight, seated blood pressure (Dinamap Procare 120, GE Medical Systems), carotid artery ultra-sound (Bioultra-sound AU4, Esaote North America, Inc.), and supine blood pressures in the brachial, posterior tibial, and dorsalis pedis arteries on the right side obtained with a mercury sphygmomanometer (Diagnostix 972, American Diagnostic Corporation) and Doppler (5.0 MHz, Nicolet Elite, CareFusion Corporation). Height and weight were used to calculate the body mass index (BMI) (weight in kg divided by the height in meters squared), and obesity was defined as a BMI greater than or equal to 30 kg/m2. Hy-pertension was defined as a measured systolic blood pressure greater than or equal to 140 mm Hg, a diastolic blood pres-sure greater than or equal to 90 mm Hg or self-reported physician diagnosed hypertension and taking hypertension medication. The intima plus media thickness (IMT) of the carotid artery was the mean of the wall thickness
measurements obtained on the right and left sides in the dis-tal common and proximal internal carotid arteries and bifur-cation. The ankle-brachial index (ABI) was calculated using the greater of the 2 systolic ankle pressures obtained divided by the systolic brachial pressure, and an ABI < 0.9 was con-sidered abnormal.
Comprehensive information on demographic factors (age, sex, highest level of education achieved, total household income, occupation, and military service), lifestyle and be-havioral factors, olfaction- and taste-related health history, general medical history, and environmental exposures were obtained by questionnaire. Occupation was classified as high risk if the longest held job was in production, farming, or forestry or as a craftsman, operator, fabricator, laborer, or fisherman. A participant was considered to have a nasal condition if they reported ever having nasal polyps or a de-viated septum. Nasal congestion was defined as an upper respiratory infection or sinus problems in the last week or a stuffy nose the day of the examination. Participants self-reported if they had a history of allergies (mold, dust, pollen, animals, or foods) or head injury (concussion, broken nose, skull fracture, or loss of consciousness due to a head injury). Medical history included self-reported physician diagnosed history of cardiovascular disease (myocardial infarction, stroke, or angina), epilepsy, Parkinson’s disease, Alzheimer’s disease, Sjogren’s syndrome, any cancer or treatment for cancer (chemotherapy or head or neck radiation), and med-ication use (statins, nonsteroidal anti-inflammatory medica-tions, or oral steroids). Diabetes was self-reported physician diagnosed or a hemoglobin A1C of 6.5% or greater.
Environmental, lifestyle, and behavioral factors included smoking history (ever smoked 100 cigarettes or more), expo-sure to environmental tobacco smoke at home, work, and in social situations (Nondahl et al. 2005), current home envi-ronment exposures to heating fuel (gas/electric vs. oil or wood) and cooking fuels (gas vs. electric), physical activity (exercise at least once a week enough to work up a sweat), and a history of heavy alcohol use (4 or more drinks per day).
Statistical analyses
Statistical analyses were conducted using SAS (SAS Systems Inc.). The prevalence of olfactory impairment in the popu-lation was assessed, and 95% CIs were calculated using nor-mal approximation where appropriate or the exact binomial method. Potential risk factors for the prevalence of olfactory impairment were tested in age- and sex-adjusted logistic re-gression models with olfactory impairment as the dependent variable. All variables significant at the 0.20 level were then added to a multivariate model, and a backward elimination procedure was used to successively remove variables that were not significant at the 0.05 level nor were confounders. Interactions with gender were explored. The final model was repeated using a generalized estimating equation to adjust for familial correlations. Factors previously associated with olfactory impairment but with too few cases in this cohort to support analyses included Sjogren’s syndrome, Parkinson’s disease, Alzheimer’s disease, epilepsy, chemotherapy, or head and neck radiation. A sensitivity analysis was run on the final model removing participants with these conditions from the model.
Analysis of covariance models were used to assess the rela-tionship between olfactory impairment and mean SF-36 and CES-D scores with olfactory impairment as the predictor and the SF-36 and CES-D scores as the dependent variables. These analyses were repeated using the olfactory score cate-gories of 0–2, 3–5, and 6–8. Contingency tables and the chi-square test for general association were used to initially assess the relationship between olfactory impairment and dietary choices and food enjoyment. These associations were then evaluated in age- and sex-adjusted logistic regression models.
Results
There were 2838 participants, 1293 (45.6%) men and 1545 (54.4%) women who completed the SDOIT. Of the 447 BOSS participants without an SDOIT, 439 had participated in the interview only. Participants were aged 21–84 years
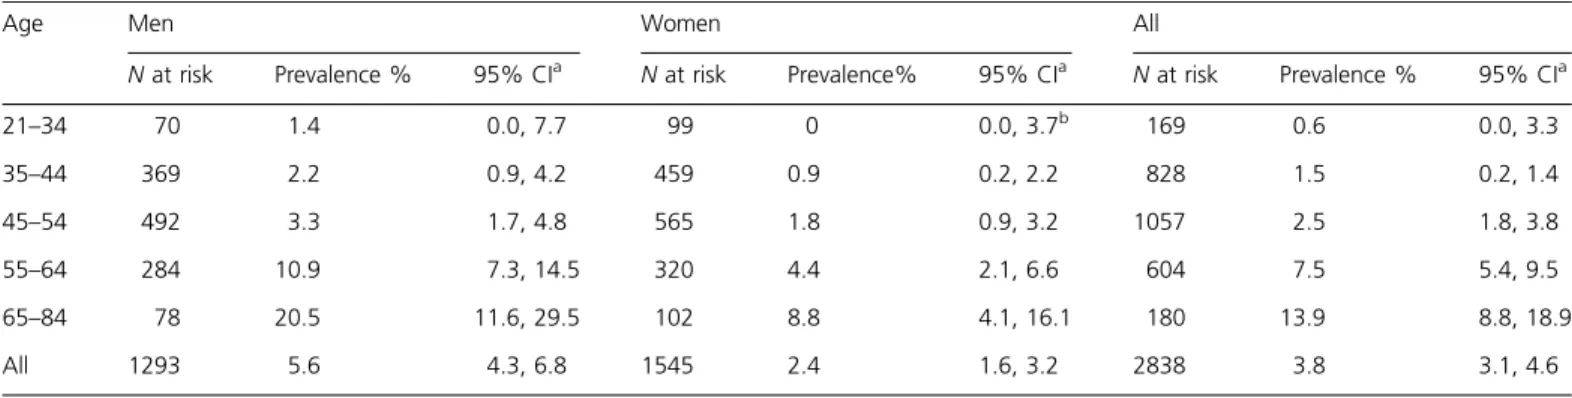
Table 1 Prevalence of olfactory impairment in the BOSS (2005–2008) by age and sex
Age Men Women All
N at risk Prevalence % 95% CIa N at risk Prevalence% 95% CIa N at risk Prevalence % 95% CIa
21–34 70 1.4 0.0, 7.7 99 0 0.0, 3.7b 169 0.6 0.0, 3.3 35–44 369 2.2 0.9, 4.2 459 0.9 0.2, 2.2 828 1.5 0.2, 1.4 45–54 492 3.3 1.7, 4.8 565 1.8 0.9, 3.2 1057 2.5 1.8, 3.8 55–64 284 10.9 7.3, 14.5 320 4.4 2.1, 6.6 604 7.5 5.4, 9.5 65–84 78 20.5 11.6, 29.5 102 8.8 4.1, 16.1 180 13.9 8.8, 18.9 All 1293 5.6 4.3, 6.8 1545 2.4 1.6, 3.2 2838 3.8 3.1, 4.6
a95% CIs calculated using normal approximation or exact binomial method as appropriate. bOne-sided 97.5% CI.
with a mean age of 49 years and 87.7% of the cohort was 35– 64 years of age. The overall prevalence of olfactory impair-ment was 3.8%, increased with age (odds ratio [OR] = 1.55, 95% CI = 1.41, 1.71, for every 5-year increase in age) and was more common in men than women (OR = 2.44, 95% CI = 1.61, 3.68, respectively) (Table 1).
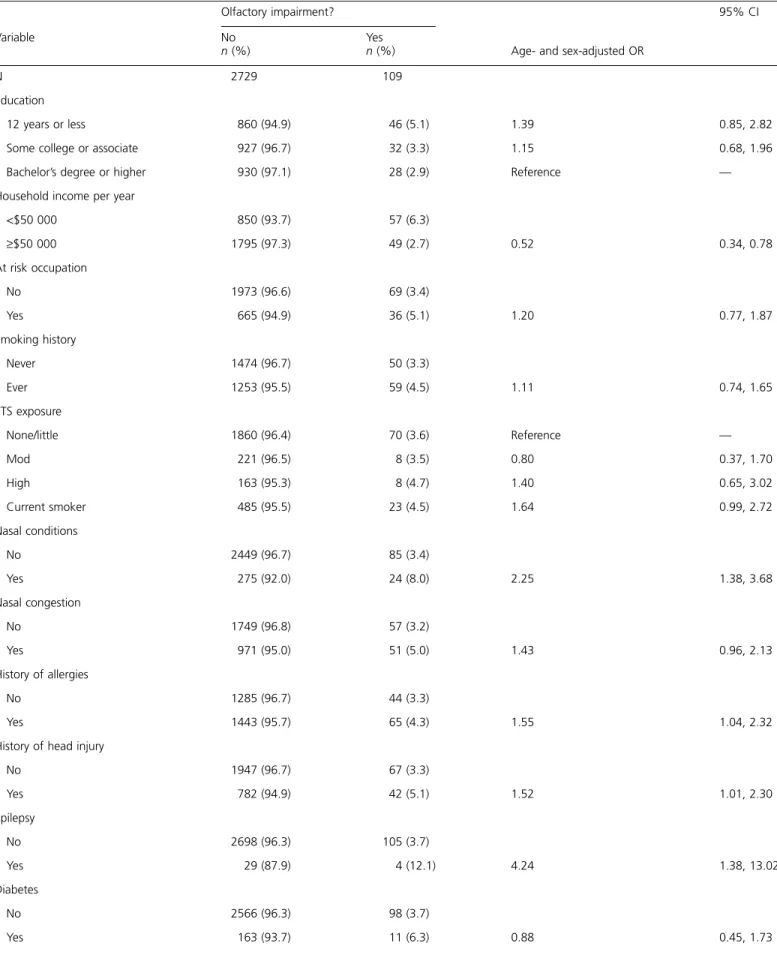
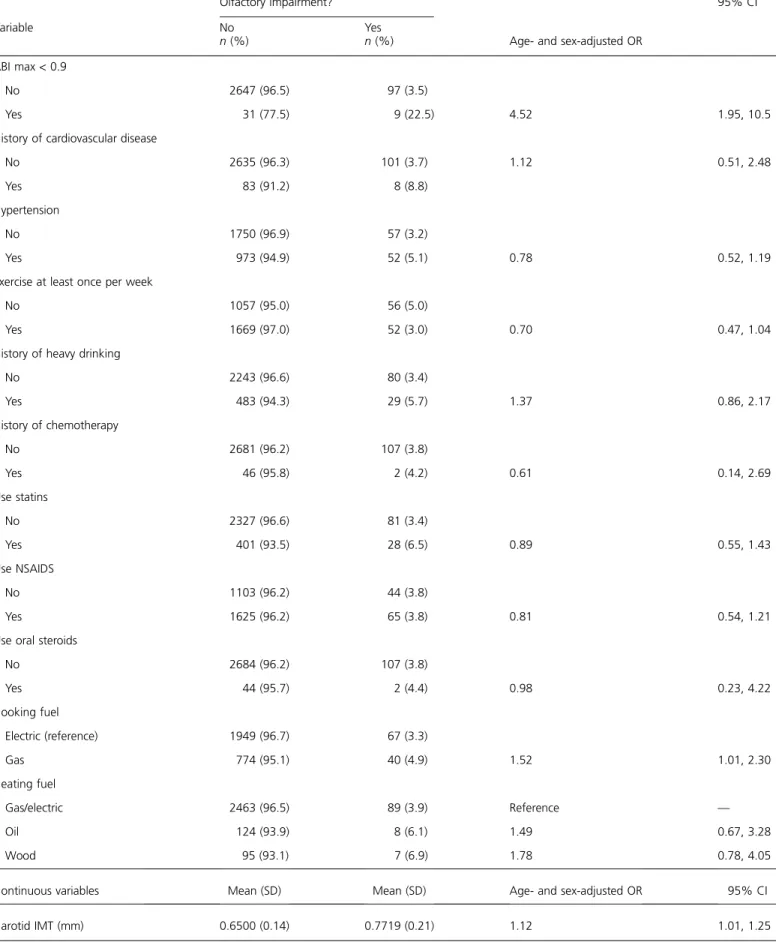
Participant characteristics by olfactory impairment and factors associated with olfactory impairment in age- and sex-adjusted models are shown in Table 2. Household income, nasal conditions, allergies, epilepsy, head injury, ABI, using gas as a cooking fuel, and carotid IMT were all associated with olfactory impairment in age- and sex-adjusted models. In a multivariate model, age (OR = 1.48, 95% CI = 1.33, 1.64 for every 5-year increase), presence of nasal conditions (OR = 2.69, 95% CI = 1.62, 4.48), and an ABI < 0.9 (OR = 3.62, 95% CI = 1.45, 9.01) were associated with an increased odds of olfactory impairment, whereas a household income of $50 000 per year or more was asso-ciated with a decreased odds of olfactory impairment (OR = 0.48, 95% CI = 0.31, 0.73,‡50 vs. <50 k). There was a signif-icant interaction between sex and smoking in the multivar-iate model, and a history of smoking was assocmultivar-iated with an increased odds of olfactory impairment in women only (OR = 2.43, 95% CI = 1.19, 4.98 for ever smoked vs. never in women; OR = 0.64, 95% CI = 038, 1.08 for ever smoked vs. never in men) (Table 3, model 1). A history of head injury, epilepsy, allergies, carotid IMT, and cooking fuel were not significant in the multivariate model. Participants with an abnormal ABI had significantly thicker carotid IMT (IMT = 0.84 mm among those with an ABI < 0.9 vs. IMT = 0.65 mm among those with an ABI ‡ 0.9, P = 0.0005), and the modeling process was repeated excluding ABI. Ca-rotid IMT was significant in the multivariate model (OR = 1.14, 95% CI = 1.01, 1.27, per 0.1 mm increase) when ABI was excluded from the analyses (Table 3, model 2).
The multivariate model was repeated controlling for famil-ial correlations, and the results were the same. A sensitivity analysis was conducted repeating the final multivariate model after excluding participants with epilepsy, Parkinson’s disease, Sjogren’s syndrome, Alzheimer’s disease, history of chemotherapy or cancer, or head and neck radiation for can-cer; the results did not change.
Quality of life and depressive symptoms
No association was found between quality of life as mea-sured by the SF-36 and olfactory impairment. For the summary SF-36 scores, the mean PCS scores were 49.0 and 49.6 (P = 0.47) and the mean MCS scores were 53.4 and 53.9 (P = 0.53) for those with and without olfactory impairment, respectively, in age- and sex-adjusted models. Similar results were obtained for the individual domain scores. Additionally there was no difference in individual domain or summary mean SF-36 scores comparing those who scored 0–2 with those who scored 6–8 or comparing those who scored 3–5 with those who scored 6–8 on the
SDOIT. There was no association between olfactory impair-ment and the report of depressive symptoms. The mean age-and sex-adjusted CES-D scores were 8.5 age-and 8.4 for those with and without olfactory impairment (P = 0.81), respectively. Enjoyment of food
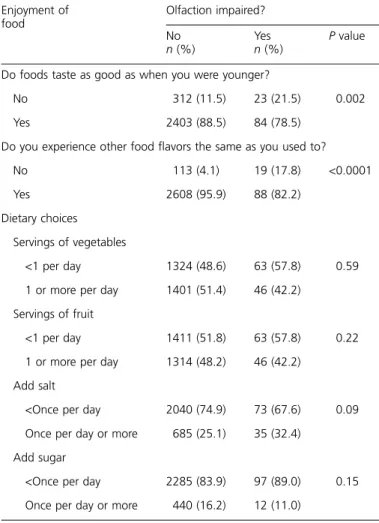
A lower percentage of participants with olfactory impair-ment reported that foods taste as good now as when they were younger as compared with participants without an ol-factory impairment (78.5% vs. 88.5%, respectively; P = 0.002). This association remained after adjusting for age, sex, and smoking (OR = 0.50, 95% CI = 0.30, 0.81). Partic-ipants with an olfactory impairment were less likely to report they ‘‘experience food flavors the same as they used to’’ than participants without olfactory impairment (82.2% vs. 95.9%, respectively; P < 0.0001). This association remained after ad-justing for age, sex, and smoking (OR = 0.21, 95% CI = 0.12, 0.37). Overall, olfactory impairment was not associated with the number of servings of vegetables or fruit eaten or the fre-quency of adding sugar or salt to foods (Table 4).
Discussions
This study of primarily middle-aged adults found the overall prevalence of olfactory impairment to be low at 3.8%. This is not unexpected in this cohort where the majority of partic-ipants were less than 65 years of age. Consistent with other studies, the prevalence of olfactory impairment increased with age, from less than 1% in those under 35 years to 13.9% in those 65 years and older, and was more common in men than women (Murphy et al. 2002;Bramerson et al. 2004; Vennemann et al. 2008). The overall prevalence in BOSS is lower than what was reported in the Skovde (19%) and Dortmund Health (22%) studies, which included similar age ranges (Bramerson et al. 2004;Vennemann et al. 2008). This could be due to differences in the age and gender distribution of the study populations. While neither the Skovde nor Dortmund study reported prevalence levels stratified by age and sex, the Skovde study included a higher percentage over 70 years of age and more of those over 70 years were men, as compared with the BOSS cohort, consistent with a higher overall prevalence of impairment (Bramerson et al. 2004). The mean age of participants in the Dortmund Health Study was slightly higher than in the BOSS (52 vs. 49 years, respectively) (Vennemann et al. 2008). In addition, differences in the methods used to ascertain olfactory dysfunction and severity of dysfunction detected may contribute to the prevalence differences across studies. The Skovde study considered hyposmia to be present if 12 or fewer odors on the 16-item Scandanavian Odor Identifica-tion test were correctly identified and the Dortmund study used 10 or fewer on a 12-item Sniffin’ Sticks test (Bramerson et al. 2004;Vennemann et al. 2008). The prevalence of anos-mia (<9 in Skovde study and£6 in the Dortmund study) was 5.8% and 3.8%, respectively, which are similar to the current
Table 2 Participant characteristics by olfactory impairment
Olfactory impairment?
Age- and sex-adjusted OR
95% CI Variable No n (%) Yes n (%) N 2729 109 Education 12 years or less 860 (94.9) 46 (5.1) 1.39 0.85, 2.82
Some college or associate 927 (96.7) 32 (3.3) 1.15 0.68, 1.96
Bachelor’s degree or higher 930 (97.1) 28 (2.9) Reference —
Household income per year
<$50 000 850 (93.7) 57 (6.3) ‡$50 000 1795 (97.3) 49 (2.7) 0.52 0.34, 0.78 At risk occupation No 1973 (96.6) 69 (3.4) Yes 665 (94.9) 36 (5.1) 1.20 0.77, 1.87 Smoking history Never 1474 (96.7) 50 (3.3) Ever 1253 (95.5) 59 (4.5) 1.11 0.74, 1.65 ETS exposure None/little 1860 (96.4) 70 (3.6) Reference — Mod 221 (96.5) 8 (3.5) 0.80 0.37, 1.70 High 163 (95.3) 8 (4.7) 1.40 0.65, 3.02 Current smoker 485 (95.5) 23 (4.5) 1.64 0.99, 2.72 Nasal conditions No 2449 (96.7) 85 (3.4) Yes 275 (92.0) 24 (8.0) 2.25 1.38, 3.68 Nasal congestion No 1749 (96.8) 57 (3.2) Yes 971 (95.0) 51 (5.0) 1.43 0.96, 2.13 History of allergies No 1285 (96.7) 44 (3.3) Yes 1443 (95.7) 65 (4.3) 1.55 1.04, 2.32
History of head injury
No 1947 (96.7) 67 (3.3) Yes 782 (94.9) 42 (5.1) 1.52 1.01, 2.30 Epilepsy No 2698 (96.3) 105 (3.7) Yes 29 (87.9) 4 (12.1) 4.24 1.38, 13.02 Diabetes No 2566 (96.3) 98 (3.7) Yes 163 (93.7) 11 (6.3) 0.88 0.45, 1.73
Table 2 Continued
Olfactory impairment?
Age- and sex-adjusted OR
95% CI Variable No n (%) Yes n (%) ABI max < 0.9 No 2647 (96.5) 97 (3.5) Yes 31 (77.5) 9 (22.5) 4.52 1.95, 10.5
History of cardiovascular disease
No 2635 (96.3) 101 (3.7) 1.12 0.51, 2.48
Yes 83 (91.2) 8 (8.8)
Hypertension
No 1750 (96.9) 57 (3.2)
Yes 973 (94.9) 52 (5.1) 0.78 0.52, 1.19
Exercise at least once per week
No 1057 (95.0) 56 (5.0)
Yes 1669 (97.0) 52 (3.0) 0.70 0.47, 1.04
History of heavy drinking
No 2243 (96.6) 80 (3.4) Yes 483 (94.3) 29 (5.7) 1.37 0.86, 2.17 History of chemotherapy No 2681 (96.2) 107 (3.8) Yes 46 (95.8) 2 (4.2) 0.61 0.14, 2.69 Use statins No 2327 (96.6) 81 (3.4) Yes 401 (93.5) 28 (6.5) 0.89 0.55, 1.43 Use NSAIDS No 1103 (96.2) 44 (3.8) Yes 1625 (96.2) 65 (3.8) 0.81 0.54, 1.21
Use oral steroids
No 2684 (96.2) 107 (3.8) Yes 44 (95.7) 2 (4.4) 0.98 0.23, 4.22 Cooking fuel Electric (reference) 1949 (96.7) 67 (3.3) Gas 774 (95.1) 40 (4.9) 1.52 1.01, 2.30 Heating fuel Gas/electric 2463 (96.5) 89 (3.9) Reference — Oil 124 (93.9) 8 (6.1) 1.49 0.67, 3.28 Wood 95 (93.1) 7 (6.9) 1.78 0.78, 4.05
Continuous variables Mean (SD) Mean (SD) Age- and sex-adjusted OR 95% CI
Carotid IMT (mm) 0.6500 (0.14) 0.7719 (0.21) 1.12 1.01, 1.25
study suggesting that differences in the severity of dysfunc-tion detected may contribute to the higher overall rates in these studies (Bramerson et al. 2004; Vennemann et al. 2008). Olfactory impairment as measured and defined in the current study may not be detecting mild dysfunction as the prevalence in this study was also similar to the
occur-rence of moderate-to-severe hyposmia on the University of Pennsylvania Smell Identification Test and severe olfactory problems on the Sniffin’ Sticks test (Doty 1995; Hummel et al. 2001).
The EHLS, which also used the SDOIT, found a much higher overall prevalence of olfactory impairment (25%) than the BOSS but that study population was much older (age 53–97 years, mean age 69 years). However, in the youn-gest EHLS age group, 53–59 years, the prevalence was 6.1% as compared with 7.5% in the current study (55–64 years). Both the current study and the EHLS found the prevalence of olfactory impairment was higher in older age groups and increases substantially at approximately age 55–60 years for men and age 65–70 years for women. Although the patterns of increasing prevalence were similar between the studies, the prevalence levels were lower in the BOSS suggesting the prev-alence of olfactory impairment may be decreasing in older adults (Murphy et al. 2002;Schubert et al. 2009).
In this study, some of the factors associated with olfactory impairment (age, sex, nasal conditions, smoking, and income) have been reported previously (Frye et al. 1990; Murphy et al. 2002; Silveira-Moriyama et al. 2010; Schubert et al. 2011) and some have not (ABI and IMT). Several of these associated risk factors may be modifiable. The association between ABI and olfactory impairment, independent of age and smoking, suggests that cardiovascular health may be important for olfactory health. An abnormal ABI is in-dicative of peripheral arterial disease (Newman et al. 1993) and those with this condition likely have atheroscle-rotic changes elsewhere in the body, which could include areas responsible for olfaction. Likewise, when ABI was ex-cluded from the modeling process carotid IMT, a subclinical marker of generalized atherosclerosis, was associated with olfactory impairment. The number of participants in this study with an abnormal ABI was low, and the overall con-tribution to olfactory impairment is comparatively small. However, these results suggest that there may be a relation-ship between vascular and olfactory health. Further research is needed to confirm these findings.
Table 3 Multivariate logistic regression estimates for olfactory impairment
Risk factor Model 1 Model 2
OR 95% CI OR 95% CI
Age, for every 5-year increase 1.48 1.33, 1.64 1.41 1.26, 1.59
Household income‡ $50 000 per year 0.48 0.31, 0.73 0.49 0.32, 0.74
Nasal conditions 2.69 1.62, 4.48 2.66 1.61, 4.41
ABI < 0.9 3.62 1.45, 9.01
Carotid IMT (per 0.1 mm) 1.14 1.01, 1.27
Smoking (ever smoked vs. never smoked)
Women 2.43 1.19, 4.98 2.16 1.08, 4.37
Men 0.64 0.38, 1.08 0.65 0.39, 1.10
Table 4 Enjoyment of food and dietary choices by olfactory impairment
Enjoyment of food Olfaction impaired? No n (%) Yes n (%) P value
Do foods taste as good as when you were younger?
No 312 (11.5) 23 (21.5) 0.002
Yes 2403 (88.5) 84 (78.5)
Do you experience other food flavors the same as you used to?
No 113 (4.1) 19 (17.8) <0.0001
Yes 2608 (95.9) 88 (82.2)
Dietary choices Servings of vegetables
<1 per day 1324 (48.6) 63 (57.8) 0.59 1 or more per day 1401 (51.4) 46 (42.2)
Servings of fruit
<1 per day 1411 (51.8) 63 (57.8) 0.22 1 or more per day 1314 (48.2) 46 (42.2)
Add salt
<Once per day 2040 (74.9) 73 (67.6) 0.09 Once per day or more 685 (25.1) 35 (32.4)
Add sugar
<Once per day 2285 (83.9) 97 (89.0) 0.15 Once per day or more 440 (16.2) 12 (11.0)
Although previous reports in the literature on the associ-ation between income and olfaction are limited ( Silveira-Moriyama et al. 2010), the finding in the current study of less olfactory impairment among those with higher household in-come is consistent with higher socioeconomic status being associated with better health. Income levels have been found to be inversely associated with cardiovascular disease and all-cause mortality (Kaplan and Keil 1993) and, with regards to sensory health, the EHLS found a higher prevalence of hearing loss among those with lower income (Cruickshanks et al. 1998). Those with higher income may have better access to health care, utilize health care at a higher rate, or have healthier lifestyles than those with lower incomes.
Smoking was only significantly associated with olfactory impairment among women in this study. Previous studies have found mixed results between smoking and olfactory impairment but gender differences have not been noted (Frye et al. 1990; Murphy et al. 2002; Bramerson et al. 2004;
Vennemann et al. 2008; Schubert et al. 2011). Frye et al. (1990)found dose-related effects of smoking on odor iden-tification scores among both current and past smokers though only current smokers had higher odds of olfactory dysfunction when compared with never smokers. Likewise, current smokers scored significantly lower on olfactory func-tion tests than those who had never smoked, and pack-years was negatively correlated with olfactory test scores in a small study in Greece (Katotomichelakis et al. 2007). Among pop-ulation-based studies, the EHLS found an increased odds of olfactory impairment among current smokers (vs. never smoked) (Murphy et al. 2002) as did the Dortmund Health Study (Vennemann et al. 2008) but the Skovde study did not (Bramerson et al. 2004).
Increasing age and male gender were associated with olfac-tory impairment in this study as they have been in other stud-ies (Doty et al. 1984;Murphy et al. 2002;Bramerson et al. 2004). Nasal conditions, which included a history of nasal polyps or a deviated septum, were strongly associated with olfactory impairment. These conditions have previously been associated with olfactory impairment in both clinic-based and population-clinic-based studies (Doty and Mishra 2001; Bramerson et al. 2004; Schubert et al. 2011) and may be amenable to treatment.
People often misinterpret a loss or change in food flavors as a problem with their sense of taste not smell (Deems et al. 1991). Olfactory impairment can affect retronasal olfaction, which is the pathway for identifying and discriminating many food flavors. This study found participants with olfac-tory impairment were less likely to report that food tasted as good as when they were younger and flavors were less likely to be the same suggesting olfactory impairment is impacting the taste and enjoyment of food for some people. Although this difference was statistically significant, the number of participants with olfactory impairment who were experienc-ing these changes was low and the majority of those with im-pairment did not report a change in the taste of food or
flavors. There were no associations between dietary choices and olfactory impairment. These results are consistent with the study byStinton et al. (2010)that reported altered olfac-tory function had no influence on taste function. In addition, the decrease in odor identification ability in this study was likely at a subclinical level for many participants who may not have been aware of their impairment. This was noted in the EHLS where the sensitivity of self-reported olfactory impairment was 20% in those who were identified as im-paired by the SDOIT (Murphy et al. 2002). Previous studies that have reported complaints of less enjoyment of food or changes in diet in relation to chemosensory problems have been conducted at smell and taste clinics where people are likely to have more severe impairments (Ferris and Duffy 1989;Mattes et al. 1990).
This study did not find an association between olfactory impairment and quality of life or depressive symptoms. Stud-ies on olfactory impairment and quality of life and depres-sion have had mixed results (Bramerson et al. 2007;Fischer et al. 2009;Smeets and Veldhuizen 2009). Some of these stud-ies have been conducted on patients at smell and taste clinics (Miwa et al. 2001;Temmel et al. 2002;Bramerson et al. 2007) or with known anosmia (Smeets and Veldhuizen 2009). Pa-tients seeking treatment are likely to have more severe symp-tomology and impairment that is affecting their quality of life as compared with participants in a general population study. In addition, the association has been more consistent in those studies using instruments that specifically measure quality of life in areas related to olfaction (eating, safety, per-sonal hygiene, etc.) (Miwa et al. 2001;Temmel et al. 2002) than with instruments such as the SF-36 that measures gen-eral health and well-being (Bramerson et al. 2007;Fischer et al. 2009; Smeets and Veldhuizen 2009). Our results are similar to a study of multisensory impairment and quality of life in the EHLS, which found no association between ol-factory impairment and SF-36 measures (Fischer et al. 2009). There are a few limitations of this study to be noted. Al-though this study was done in a general population cohort, it is not population-based but represents the children of a pop-ulation-based cohort. A food frequency questionnaire, die-tary recall, or food diary was not used for the assessment of dietary choices, and this may have limited our ability to detect small differences in diet between those with and without olfactory impairment. The strengths of this study in-clude a large cohort with extensive information available on potential risk factors including demographic, health, and en-vironmental factors and the measurement of olfaction versus self-report. The SDOIT is a standardized odor identification test with good reproducibility and is comparable to another validated short smell test, the B-SIT, for classifying impair-ment (Krantz et al. 2009). The number of odorants in the SDOIT may limit the ability to detect small decrements in odor identification or to distinguish hyposmia from anos-mia. In addition, the choice of a cut-point for defining im-pairment affects prevalence; changing the cut-point by just
one in either direction would change the prevalence. How-ever, the definition of olfactory impairment used in this study has been previously validated in a large epidemiological study (Murphy et al. 2002) and was approximately 2 SDs less than the mean among younger adults in this study. The SDOIT with its small number of odorants, short admin-istration time, and good reproducibility is well suited for use in epidemiological studies such as this one or as a screening test in clinical settings (Krantz et al. 2009).
Conclusion
In conclusion, the prevalence of olfactory impairment was low in this primarily middle-aged cohort, and many of the factors associated with olfactory impairment are potentially modifiable. Impaired olfaction affected the enjoyment of food for some but was not associated with depression, gen-eral health-related quality of life, or dietary choices in this general population cohort.
Funding
The project described was supported by R01AG021917 (K.J.C.) from the National Institute on Aging, National Eye Institute, and National Institute on Deafness and Other Communication Disorders. The content is solely the respon-sibility of the authors and does not necessarily reflect the of-ficial views of the National Institute on Aging or the National Institutes of Health.
References
Bramerson A, Johansson L, Ek L, Nordin S, Bende M. 2004. Prevalence of olfactory dysfunction: the Skovde population-based study. Laryngo-scope. 114:733–737.
Bramerson A, Nordin S, Bende M. 2007. Clinical experience with patients with olfactory complaints, and their quality of life. Acta Otolaryngol. 127:167–174.
Cruickshanks KJ, Nondahl DM, Tweed TS, Wiley TS, Klein BEK, Klein R, Chappell R, Dalton DS, Nash SD. 2010. Education, occupation, noise exposure history and the 10-yr cumulative incidence of hearing impairment in older adults. Hear Res. 264(1–2):3–9.
Cruickshanks KJ, Tweed TS, Wiley TL, Klein BEK, Klein R, Chappell R, Nondahl DM, Dalton DS. 2003. The 5-year incidence and progression of hearing loss. The Epidemiology of Hearing Loss Study. Arch Otolaryngol Head Neck Surg. 129:1041–1046.
Cruickshanks KJ, Wiley TL, Tweed TS, Klein BEK, Klein R, Mares-Perlman JA, Nondahl DM. 1998. Prevalence of hearing loss in older adults in Beaver Dam, Wisconsin. The Epidemiology of Hearing Loss Study. Am J Epidemiol. 148:879–886.
Deems DA, Doty RL, Settle G, Moore-Gillon V, Shaman P, Mester AF, Kimmelman CP, Brightman VJ, Snow JB. 1991. Smell and taste disorders, a study of 750 patients from the University of Pennsylvania Smell and Taste Center. Arch Otolaryngol Head Neck Surg. 117:519–528. Doty RL. 1995. The smell identification test administration manual. 3rd ed
Haddonfield (NJ): Sensonics Inc.
Doty RL, Mishra A. 2001. Olfaction and its alteration by nasal obstruction, rhinitis, and rhinosinusitis. Laryngoscope. 111:409–423.
Doty RL, Shaman P, Applebaum SL, Giberson R, Siksorski L, Rosenberg L. 1984. Smell identification ability: changes with age. Science. 226:1441–1443. Ferris AM, Duffy VB. 1989. Effect of olfactory deficits on nutritional status.
Ann N Y Acad Sci. 561:113–123.
Fischer ME, Cruickshanks KJ, Klein BEK, Klein R, Schubert CR, Wiley TL. 2009. Multiple sensory impairment and quality of life. Ophthalmic Epidemiol. 16(6):346–353.
Frye RE, Schwartz BS, Doty RL. 1990. Dose-related effects of cigarette smoking on olfactory function. JAMA. 263(9):1233–1236.
Hummel T, Rosenheim K, Konnerth C, Kobal G. 2001. Screening of olfactory function with a four-minute odor identification test: reliability, normative data, and investigations in patients with olfactory loss. Ann Oto Rhinol Laryngol. 110(10):976–981.
Kaplan GA, Keil JE. 1993. Socioeconomic factors and cardiovascular disease: a review of the literature. Circulation. 88:1973–1998.
Katotomichelakis M, Balatsouras D, Tripsianis G, Davris S, Maroudias N, Danielides V, Simopoulos C. 2007. The effect of smoking on the olfactory function. Rhinology. 45:273–280.
Krantz EM, Schubert CR, Dalton DS, Zhong W, Huang GH, Klein BEK, Klein R, Nieto FJ, Cruickshanks KJ. 2009. Test-retest reliability of the San Diego Odor Identification Test and comparison with the Brief Smell Identification Test. Chem Senses. 34:435–440.
Mattes RD, Cowart BJ, Schiavo MA, Arnold C, Garrison B, Kare MR, Lowry LD. 1990. Dietary evaluation of patients with smell and/or taste disorders. Am J Clin Nutr. 51:233–240.
Miwa R, Furukawa M, Tsukatani T, Costanzo RM, DiNardo LJ, Reiter ER. 2001. Impact of olfactory impairment on quality of life and disability. Arch Otolaryngol Head Neck Surg. 127:497–503.
Murphy C, Schubert CR, Cruickshanks KJ, Klein BEK, Klein R, Nondahl DM. 2002. Prevalence of olfactory impairment in older adults. JAMA. 288(18):2307–2312.
Newman AB, Siscovick DS, Manolio TA, Polak J, Fried LP, Borhani NO, Wolfson SK. for the Cadiovascular Heart Study (CHS) Collaborative Research Group. 1993. Ankle-arm index as a marker of atherosclerosis in the Cardiovascular Health Study. Circulation. 88(3):837–845.
Nondahl DM, Cruickshanks KJ, Schubert CR. 2005. A questionnaire for assessing environmental tobacco smoke exposure. Environ Res. 97:76–82. Radloff LS. 1977. The CES-D scale: a self-report depression scale for research
in the general population. Appl Psychol Meas. 1:385–401.
Raynor LA, Pankow JS, Cruickshanks KJ, Schubert CR, Miller MB, Klein R, Huang GH. 2010. Familial aggregation of olfactory impairment and odor identification in older adults. Laryngoscope. 120(8):1614–1618. Santos DV, Reiter ER, DiNardo LJ, Costanzo RM. 2004. Hazardous events
associated with impaired olfactory function. Arch Otolaryngol Head Neck Surg. 130:317–319.
Schubert CR, Cruickshanks KJ, Klein BEK, Klein R, Nondahl DM. 2011. Olfactory impairment in older adults: 5-year incidence and risk factors. Laryngoscope. 121(4):873–888.
Schubert CR, Cruickshanks KJ, Murphy C, Huang GH, Klein BEK, Klein R, Nieto FJ, Pankow JS, Tweed TS. 2009. Olfactory impairment in adults. Ann N Y Acad Sci. 1170:531–536.
Silveira-Moriyama L, Azevedo AMS, Ranvaud R, Barbosa ER, Doty RL, Lees AJ. 2010. Applying a new version of the Brazilian-Portuguese UPSIT smell test in Brazil. Arq Neuropsiquiatr. 68(5):700–705.
Smeets MA, Veldhuizen MG. 2009. Sense of smell disorder and health-related quality of life. Rehabil Psychol. 54(4):404–412.
Stinton N, Atif MA, Barkat N, Doty RL. 2010. Influence of smell loss on taste function. Behav Neurosci. 124(2):256–264.
Temmel AFP, Quint C, Schickinger-Fischer B, Klimek L, Stoller E, Hummel T. 2002. Characteristics of olfactory disorders in relation to major causes of olfactory loss. Arch Otolaryngol Head Neck Surg. 128: 635–641.
Vennemann M, Hummel T, Berger K. 2008. The association between smoking and smell and taste impairment in the general population. J Neurol. 255:1121–1126.
Ware JE, Kosinski M, Keller SD. 1994. SF-36 physical & mental health summary scales: a user’s manual. 5th ed. Boston (MA): Boston Health Assessment Lab, New England Medical Center.
Ware JE, Snow KK, Kosinski M, Gandek B. 1993. SF-36 health survey: manual and interpretation guide. 2nd ed. Boston (MA): The Health Institute, New England Medical Center.
Zhan W, Cruickshanks KJ, Klein BEK, Klein R, Huag GH, Pankow JS, Gangnon R, Tweed TS. 2010. Generational differences in the prevalence of hearing impairment in adults. Am J Epidemiol. 171(2):260–266.