Infrared absorption of C H 3 S O 2 detected with time-resolved Fourier-transform
spectroscopy
Li-Kang Chu and Yuan-Pern Lee
Citation: The Journal of Chemical Physics 124, 244301 (2006); doi: 10.1063/1.2211610 View online: http://dx.doi.org/10.1063/1.2211610
View Table of Contents: http://scitation.aip.org/content/aip/journal/jcp/124/24?ver=pdfcov Published by the AIP Publishing
Articles you may be interested in
Transient infrared spectra of CH 3 SOO and CH 3 SO observed with a step-scan Fourier-transform spectrometer J. Chem. Phys. 133, 184303 (2010); 10.1063/1.3495765
Quenching of highly vibrationally excited pyrimidine by collisions with C O 2 J. Chem. Phys. 128, 054304 (2008); 10.1063/1.2825599
Infrared absorption of gaseous C H 3 O O detected with a step-scan Fourier-transform spectrometer J. Chem. Phys. 127, 234318 (2007); 10.1063/1.2807241
Infrared absorption of C 6 H 5 S O 2 detected with time-resolved Fourier-transform spectroscopy J. Chem. Phys. 126, 134311 (2007); 10.1063/1.2713110
Sequential addition of H 2 O , C H 3 O H , and N H 3 to Al 3 O 3 : A theoretical study J. Chem. Phys. 126, 024309 (2007); 10.1063/1.2409293
Infrared absorption of CH
3SO
2detected with time-resolved
Fourier-transform spectroscopy
Li-Kang Chu
Department of Chemistry, National Tsing Hua University, 101, Section 2, Kuang Fu Road, Hsinchu 30013, Taiwan
Yuan-Pern Leea兲
Department of Applied Chemistry and Institute of Molecular Science, National Chiao Tung University, 1001 Ta-Hsueh Road, Hsinchu 30010, Taiwan; Institute of Atomic and Molecular Sciences, Academia Sinica, Taipei 10617, Taiwan
共Received 14 March 2006; accepted 15 May 2006; published online 23 June 2006兲
A step-scan Fourier-transform spectrometer coupled with a 6.4 m multipass absorption cell was employed to detect time-resolved infrared absorption spectra of the reaction intermediate CH3SO2
radical, produced upon irradiation of a flowing gaseous mixture of CH3I and SO2in CO2at 248 nm.
Two transient bands with origins at 1280 and 1076 cm−1 were observed and are assigned to the SO2-antisymmetric and SO2-symmetric stretching modes of CH3SO2, respectively. Calculations with density-functional theory 共B3LYP/aug-cc-pVTZ and B3P86/aug-cc-pVTZ兲 predicted the geometry, vibrational, and rotational parameters of CH3SO2 and CH3OSO. Based on predicted rotational parameters, the simulated absorption band of the SO2-antisymmetric stretching mode that is dominated by the b-type rotational structure agrees satisfactorily with experimental results. In addition, a band near 1159 cm−1observed at a later period is tentatively attributed to CH
3SO2I. The
reaction kinetics of CH3+ SO2→CH3SO2and CH3SO2+ I→CH3SO2I based on the rise and decay of absorption bands of CH3SO2and CH3SO2I agree satisfactorily with previous reports. © 2006 American Institute of Physics.关DOI:10.1063/1.2211610兴
I. INTRODUCTION
Dimethyl sulfide 共DMS, CH3SCH3兲 is the most
abun-dant natural source of sulfur in the atmosphere.1The oxida-tion of DMS and other reduced sulfur compounds plays an important role not only in the formation of acid rain in the atmosphere but also in the formation of clouds; sulfate par-ticles produced from these oxidation reactions may act as cloud condensation nuclei.2 The methylsulfonyl radical 共CH3SO2兲 has been proposed to be an important
intermedi-ate in the oxidation of reduced sulfur compounds in the atmosphere.3–7CH3SO2might be produced either from
reac-tions of CH3SO with NO2 and O3,4,5 or from isomerization
of CH3SOO that was formed via reaction of CH3S with O2
at low temperature.8 CH3SO2 might also be formed in
reac-tions of OH or O atoms with dimethyl sulfoxide9,10共DMSO兲. Chemically activated CH3SO2 might undergo prompt de-composition to form CH3 and SO2, or become thermalized before proceeding with further reactions.
In the condensed phase, an absorption band with maxi-mum intensity in the range of 327− 350 nm was ascribed to CH3SO2; the wavelength of the maximum depends on the solvent.11,12 Electron paramagnetic resonance共EPR兲 spectra of CH3SO2, produced in solutions via reactions involving
CH3SO2Cl,13 photolysis of methylsulphinate ester,
CH3S共O兲OCH3, and di-t-butyl peroxide,14 or
photoisomer-ization of CH3SOO have been reported;15 observed spectra
and calculations according to the semiempirical intermediate neglect of differential overlap 共INDO兲 model indicate that this radical has a-type structure with the unpaired electron localized on the SO2 moiety.16
In the gaseous phase, both methylsulfonyl radical 共CH3SO2兲 and methoxysulfinyl radical 共CH3OSO兲 were
pro-duced with femtosecond collisional electron transfer and de-tected with variable-time neutralization-reionization mass spectrometry,17 but gaseous CH3SO2or CH3OSO has never
been spectrally characterized. Hence it is desirable to de-velop a detection technique to investigate the spectroscopy and reaction kinetics of gaseous CH3SO2or CH3OSO.
Several theoretical calculations have been performed to predict the energy, geometry, and vibrational wave numbers of CH3SO2 and CH3OSO.4,17–21 Two conformers of
CH3OSO are stable; syn-CH3OSO is more stable than
anti-CH3OSO by ⬃8 kJ mol−1 which is more stable than
CH3SO2by⬃13 kJ mol−1.17
According to calculations, reac-tions of CH3 with SO2 might proceed via three paths: a
nearly barrierless channel to produce CH3SO2and two
chan-nels with barriers ⬃80 kJ mol−1 to produce anti-CH3OSO
and syn-CH3OSO; anti-CH3OSO might readily transform to
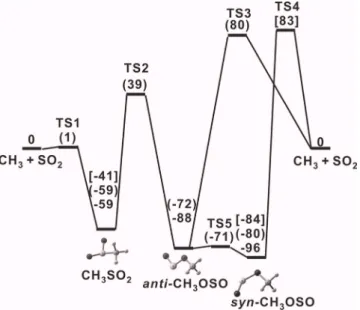
the more stable syn-CH3OSO with a near-zero barrier, as shown in Fig.1. Reaction of CH3with SO2is thus expected
to be an effective method to produce CH3SO2for laboratory
investigations.
We have demonstrated that, by coupling a step-scan Fourier-transform infrared共FTIR兲 spectrometer with a mul-tipass absorption cell, time-resolved infrared absorption a兲Author to whom correspondence should be addressed. Electronic mail:
0021-9606/2006/124共24兲/244301/8/$23.00 124, 244301-1 © 2006 American Institute of Physics
spectra of gaseous reaction intermediates such as ClCO共Ref. 22兲 and ClSO 共Ref.23兲 and species in vibrationally excited states 共HCl*, CH
4
*兲 were recorded.24,25
Here we report an application of a step-scan FTIR spectrometer to record time-resolved infrared absorption spectra of the intermediate CH3SO2from reactions of CH3with SO2.
II. EXPERIMENTS
A White cell with a volume of⬃1600 cm3and an effec-tive path length of 6.4 m共base path of 20 cm兲 serves as the reactor. The housing of the White cell has two rectangular 共3⫻12 cm2兲 quartz windows on the sides to pass the
pho-tolysis laser beam that propagates perpendicular to multi-passing IR beams. The laser beam is multiply reflected be-tween a pair of external rectangular laser mirrors and passes these quartz windows and the White cell after each reflec-tion. A KrF excimer laser 共GAM Laser, EX100H/60兲 oper-ated at 7 Hz with typical output energy of⬃100 mJ pulse−1
at 248 nm and a beam expanded by a telescope to a dimen-sion⬃4⫻1.2 cm2 was employed for photodissociation. The
White cell was placed in the sample compartment of the FTIR spectrometer. A commercial step-scan spectrometer 共Thermo Nicolet, Nexus 870兲 equipped with a fast mercury cadmium telluride共MCT兲 detector 共20 MHz兲 and an external 14 bit digitizer 共Gage Applied Technology, CompuScope 14 100, 108sample s−1兲 was employed for data acquisition.
The position of the moving mirror of FTIR was maintained to within ±0.2 nm at each step in the step-scan mode.26
Techniques for obtaining time-resolved difference ab-sorption spectra with a step-scan FTIR spectrometer are well established.24,27After preamplification, the ac-coupled signal from the MCT detector was further amplified共Stanford Re-search Systems, Model SR560兲 20 times with a bandwidth 100– 1 M Hz before being sent to the external 14 bit digi-tizer, whereas the dc-coupled signal was sent directly to the
internal 16 bit digitizer共2⫻105sample s−1兲 of the
spectrom-eter. Typically, 300 data points were acquired at 1s inte-grated intervals共100 dwells at 10 ns gate width兲 after each laser shot; the signal was typically averaged over 16 laser shots at each scan step. We utilized undersampling to de-crease the number of points in the interferogram, hence the duration of data acquisition, by employing proper optical fil-ters to define a small spectral region. For spectra in the range of 1580– 835 cm−1 at a resolution of 2.0 cm−1, 960 scan
steps were required, and the data acquisition took⬃60 min. To improve further the ratio of signal to noise, we recorded and averaged ten sets of data under similar experimental con-ditions.
A flowing mixture of CH3I / SO2/ CO2 with flow rates FCH3I⬵0.10, FSO2⬵0.34, FCO2⬵20.4 SCCS 共SCCS denotes
cubic centimeter per second at STP兲, and total pressure PT = 297 Torr at 298 K was irradiated at 248 nm. The efficiency of photolysis of CH3I is estimated to be 2% based on its absorption cross section ⬃8⫻10−19cm2molecule−1 at
248 nm.28
CH3I 共99%, Riedel–de Haën兲 and SO2 共99.9%, Mathe-son兲 were used without further purification. CO2 共99.99%兲 was purified by passing it through a trap at 218 K.
III. THEORETICAL CALCULATIONS
We employed theGAUSSIAN 03 program to calculate the energy, equilibrium geometry, harmonic wave numbers, and IR intensities of CH3SO2 and CH3OSO with B3LYP and
B3P86 density-functional theories.29 The B3LYP method uses Becke’s three-parameter hybrid exchange functional with a correlation functional of Lee et al.30,31 The B3P86 method uses Becke’s three-parameter hybrid exchange func-tional with Perdew’s gradient-corrected correlation functional.32 Dunning’s correlation-consistent polarized-valence triple-zeta basis sets, augmented with s, p, d, and f functions 共aug-cc-pVTZ兲 共Refs. 33and 34兲, was applied in all calculations except those for CH3SO2X共X=F, Cl, Br, and
I兲, in which standard 3-21G*basis sets were employed. All
reported energies include vibrational zero-point energy. Ana-lytic first derivatives were utilized in geometry optimization, and harmonic vibrational wave numbers were calculated ana-lytically at each stationary point.
The geometries of CH3SO2 and two conformers of CH3OSO calculated with B3P86/aug-cc-pVTZ are shown in Fig.2; those calculated with B3LYP are similar and are listed parenthetically. The most stable species is syn-CH3OSO with
the terminal O atom on the same side as the methyl group; the SvO bond length of 1.481 Å is greater than the experi-mental value of 1.432 Å of SO2,35 and the S–O bond length
of 1.638 Å is greater than the value of 1.481 Å of SO.36 Similar to previous report using G2共MP2兲/6-31+G共2d,p兲,17
anti-CH3OSO has energy of 8 kJ mol−1 greater than syn
-CH3OSO. Its SvO bond is slightly shorter, whereas its
S–O bond is slightly longer than those of syn-CH3OSO, as
indicated in Figs.2共B兲 and2共C兲.
CH3SO2 is greater in energy than syn-CH3SO2 by
28 kJ mol−1 共B3P86兲 or 37 kJ mol−1 共B3LYP兲; a previous calculation based on the G2共MP2兲/6-31+G共2d,p兲 method
FIG. 1. Potential energy diagram for the reaction of CH3with SO2. Relative energies of isomers of CH3SO2calculated with B3LYP/aug-cc-pVTZ in this work are listed. Energies calculated with the G2共MP2兲 method in Ref.17are listed in parentheses. Energies calculated with the PMP4SDTQ method in Ref.19are listed in brackets.
244301-2 L.-K. Chu and Y.-P. Lee J. Chem. Phys. 124, 244301共2006兲
yielded 21 kJ mol−1.17
The C–S bond length of 1.816 Å pre-dicted with B3P86/aug-cc-pVTZ in this work 关Fig.2共A兲兴 is similar to the value of 1.818 Å of CH3SH.37 The predicted
SvO bond length of 1.467 Å is slightly greater than the experimental value of 1.432 Å for SO2 共Ref. 35兲 and the
value of 1.450 Å predicted for ClSO2.38Previous reports
us-ing smaller basis sets yielded similar results17,19 except that from UHF/ 6-31G共d兲,20
which predicted two eclipsed C–H and S–O bonds rather than staggered C–H and S–O bonds.
Vibrational wave numbers and IR intensities of CH3SO2,
anti-CH3OSO, and syn-CH3OSO predicted with B3LYP and B3P86 methods are compared in TableI. The two most in-tense bands of CH3SO2 predicted with B3P86 共B3LYP兲
methods are at 1262 共1223兲 and 1074 共1044兲 cm−1,
corre-sponding to the SO2-antisymmetric and SO2-symmetric
stretching modes, respectively. Previous calculations using B3LYP/ 6-31+ G共2d,p兲 yielded 1208 and 1021 cm−1,
respectively.17
The wave numbers of the most intense bands of syn-CH3OSO predicted with B3P86 共B3LYP兲 methods are 717 共690兲, 1028 共995兲, 1162 共1136兲, 1166 共1165兲, and 3046共3036兲 cm−1, corresponding to S–O stretching, C–O
stretching, SvO stretching mixed with CH3 wagging,
SvO stretching mixed with CH3 rocking, and
CH3-symmetric stretching modes, respectively. Previous
cal-culations using B3LYP/ 6-31+ G共2d,p兲 yielded 663, 989, 1105, 1165, and 3038 cm−1, respectively.17
The wave numbers of the most intense bands of anti-CH3OSO predicted with B3P86 共B3LYP兲 methods are 742 共715兲, 1046 共1014兲, 1195 共1167兲, and 3031 共3022兲 cm−1,
cor-responding to S–O stretching, C–O stretching, SvO stretch-ing, and CH3-symmetric stretching modes, respectively.
Pre-FIG. 2. Geometries predicted with B3P86/aug-cc-pVTZ and B3LYP/aug-cc-pVTZ methods for CH3SO2共A兲, syn-CH3OSO共B兲, and anti-CH3OSO共C兲. Bond lengths are in Å and bond angles are in degrees. Results from B3LYP are listed parenthetically.
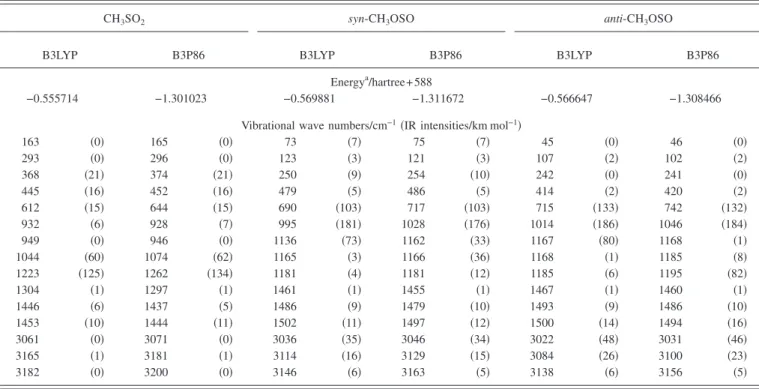
TABLE I. Comparison of energies, harmonic vibrational wave numbers, and IR intensities 共listed in parentheses兲 of CH3SO2, syn-CH3OSO, and anti -CH3OSO calculated with B3LYP and B3P86/aug-cc-pVTZ methods.
CH3SO2 syn-CH3OSO anti-CH3OSO
B3LYP B3P86 B3LYP B3P86 B3LYP B3P86
Energya/hartree+ 588
−0.555714 −1.301023 −0.569881 −1.311672 −0.566647 −1.308466
Vibrational wave numbers/cm−1共IR intensities/km mol−1兲
163 共0兲 165 共0兲 73 共7兲 75 共7兲 45 共0兲 46 共0兲 293 共0兲 296 共0兲 123 共3兲 121 共3兲 107 共2兲 102 共2兲 368 共21兲 374 共21兲 250 共9兲 254 共10兲 242 共0兲 241 共0兲 445 共16兲 452 共16兲 479 共5兲 486 共5兲 414 共2兲 420 共2兲 612 共15兲 644 共15兲 690 共103兲 717 共103兲 715 共133兲 742 共132兲 932 共6兲 928 共7兲 995 共181兲 1028 共176兲 1014 共186兲 1046 共184兲 949 共0兲 946 共0兲 1136 共73兲 1162 共33兲 1167 共80兲 1168 共1兲 1044 共60兲 1074 共62兲 1165 共3兲 1166 共36兲 1168 共1兲 1185 共8兲 1223 共125兲 1262 共134兲 1181 共4兲 1181 共12兲 1185 共6兲 1195 共82兲 1304 共1兲 1297 共1兲 1461 共1兲 1455 共1兲 1467 共1兲 1460 共1兲 1446 共6兲 1437 共5兲 1486 共9兲 1479 共10兲 1493 共9兲 1486 共10兲 1453 共10兲 1444 共11兲 1502 共11兲 1497 共12兲 1500 共14兲 1494 共16兲 3061 共0兲 3071 共0兲 3036 共35兲 3046 共34兲 3022 共48兲 3031 共46兲 3165 共1兲 3181 共1兲 3114 共16兲 3129 共15兲 3084 共26兲 3100 共23兲 3182 共0兲 3200 共0兲 3146 共6兲 3163 共5兲 3138 共6兲 3156 共5兲
aVibrational zero-energy included.
vious calculations using B3LYP/ 6-31+ G共2d,p兲 yielded 689, 1008, 1185, and 3023 cm−1, respectively.17
Predicted displacement vectors 共thin arrows兲 for the SO2-symmetric and SO2-antisymmetric stretching modes of CH3SO2and the associated dipole derivatives共thick arrows兲
are shown in Figs. 3共A兲 and 3共B兲, respectively. The three rotational axes a, b, and c of CH3SO2 are also indicated in
Fig.3as arrows with dashed lines.
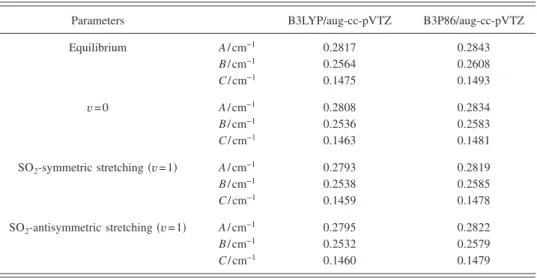
Rotational parameters predicted with B3P86 and B3LYP for the ground state and states vibrationally excited in the SO2-symmetric stretching and SO2-antisymmetric stretching
modes of CH3SO2are listed in TableIIfor comparison. The
difference in predicted geometries using B3LYP and B3P86 results in variations less than 1.9% for rotational parameters of both the ground and the excited states.
IV. EXPERIMENTAL RESULTS AND DISCUSSION A. Photolysis of the mixture CH3I / SO2/ CO2
Because the precursors became highly internally excited upon laser irradiation, we added excessive CO2to thermalize species in the system; absorption of the internally hot parent molecules typically yields upward-pointing features on each side of the downward parent band in the difference
absorp-tion spectra, thus interfering with observaabsorp-tion of nearby ab-sorption features of the species of interest.23 The excess en-ergy of a reaction adduct might also facilitate decomposition, thus hampering its observation.
A representative three-dimensional plot of temporally and spectrally resolved spectra at 10s intervals upon laser irradiation at 248 nm of a flowing mixture of 297 Torr of CH3I / SO2/ CO2 共1.0/3.3/200兲 is shown in Fig. 4共A兲. In these difference spectra, signals pointing upward indicate production, whereas those pointing downward indicate a de-crease in concentration. The consumption of CH3I and SO2 is shown as downward features near 1265, 1235, and 1160 cm−1, respectively. An intense feature near 1280 cm−1
and a weak feature near 1076 cm−1 appeared after
irradia-tion; they increased in intensity, reached maxima near 50s, and decayed afterwards. A band near 1160 cm−1appeared at a later stage of reaction and became prominent after 150s. Spectra integrated over various reaction periods are repre-sented in Fig.4共B兲. The rise and decay of features near 1280 and 1076 cm−1 共marked A1 and A2, respectively兲, and the
rise of the feature near 1160 cm−1 共marked B1兲 are clearly
illustrated.
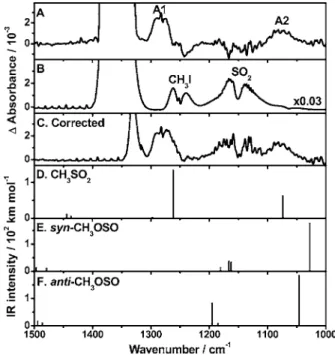
The spectra integrated over 20– 80s intervals in the spectral region of 1000– 1500 cm−1are shown in trace共A兲 of
Fig.5; the spectral region of 1310–1390 is unusable due to saturated absorption of SO2. The two new features at 1280 and 1076 cm−1are marked as A1 and A2. Because part of the
A1 band was subject to interference by weak absorption in the R branch of CH3I near 1265 cm−1, which decreases
slightly upon photolysis, the A1 band appears narrower than its original form. The background spectrum of the flowing mixture is shown in trace共B兲 of Fig.5, in which absorption due to CH3I near 1250 cm−1 is marked; the downward band
near 1240 cm−1in Fig.5共A兲 clearly matches the P branch of CH3I. We corrected for this interference by spectral
strip-ping; the spectrum in Fig.5共B兲 was scaled and added to the spectrum in Fig.5共A兲 in such a way that the P-branch region of CH3I, 1250– 1220 cm−1, became nearly flat. The resultant
FIG. 3. Displacement vectors共thin arrows兲 and vector of dipole derivatives 共bold arrows兲 predicted with the B3P86/aug-cc-pVTZ method for SO2-symmetric stretching共A兲 and SO2-antisymmetric stretching modes共B兲 of CH3SO2. Rotational axes a, b, and c are also shown as arrows with dashed lines.
TABLE II. Comparison of rotational parameters of CH3SO2in ground and vibrationally excited states calcu-lated with B3LYP and B3P86/aug-cc-pVTZ.
Parameters B3LYP/aug-cc-pVTZ B3P86/aug-cc-pVTZ
Equilibrium A / cm−1 0.2817 0.2843 B / cm−1 0.2564 0.2608 C / cm−1 0.1475 0.1493 v = 0 A / cm−1 0.2808 0.2834 B / cm−1 0.2536 0.2583 C / cm−1 0.1463 0.1481 SO2-symmetric stretching共v=1兲 A / cm−1 0.2793 0.2819 B / cm−1 0.2538 0.2585 C / cm−1 0.1459 0.1478 SO2-antisymmetric stretching共v=1兲 A / cm−1 0.2795 0.2822 B / cm−1 0.2532 0.2579 C / cm−1 0.1460 0.1479
244301-4 L.-K. Chu and Y.-P. Lee J. Chem. Phys. 124, 244301共2006兲
spectrum is shown in trace共C兲 of Fig.5; this corrected spec-trum of the A1 band is used for comparison with spectral simulation.
B. Assignment of CH3SO2absorption
The major product on photolysis of CH3I at 248 nm is
CH3;39 further reaction of CH3 with SO2 might form CH3SO2or CH3OSO. SO2has a small absorption cross sec-tion ⬃9⫻10−20cm2 at 248 nm;40
but it does not dissociate because the photodissociation threshold is⬃220 nm.41 Con-sidering that observed transient absorption features near 1280 and 1076 cm−1 共A1 and A2 bands兲 have vibrational
wave numbers similar to observed values of 1309.6 and 1098.2 cm−1 for the SO
2-antisymmetric and SO2-symmetric
stretching modes of ClSO2 isolated in solid Ar,
respectively,38 but smaller than values of 1361.8 and 1151.4 cm−1 for SO
2,42 we believe that they are due to
CH3SO2 rather than to CH3OSO. The latter is expected to
have a spectral pattern distinct from the SO2-symmetric and
SO2-antisymmetric stretching modes.
Quantum-chemical calculations in this work provide fur-ther support for the assignment. IR absorption spectra in the region of 1000– 1500 cm−1 predicted for CH3SO2,
syn-CH3OSO, and anti-CH3OSO with B3P86/aug-cc-pVTZ are
shown as stick diagrams in traces共D兲–共F兲 of Fig.5,
respec-tively; predicted intensities are represented by the height of the sticks. Two most intense bands predicted at 1262 and 1074 cm−1 for CH3SO2 共without scaling兲 fit satisfactorily
with experiments, with deviations of −1.4% and 0.2%, re-spectively. For comparison, previous predictions of vibra-tional wave numbers for the SO2-antisymmetric and
SO2-symmetric stretching modes of ClSO2 are within 1%
共B3P86兲 and 2.8% 共B3LYP兲 of experimental values from the matrix experiment.38The pattern of three intense bands pre-dicted for syn-CH3OSO at 1028, 1162, and 1166 cm−1in this
spectral region and two intense bands predicted for anti -CH3OSO at 1046 and 1195 cm−1 are appreciably different
from our observation.
The direction of the dipole derivative for the SO2-antisymmetric stretching mode and the three principal rotational axes of CH3SO2shown in Fig.3共B兲 indicates that
the associated rotational structure for this vibrational mode is mainly b-type, whereas that for the SO2-symmetric
stretch-ing mode is mainly a-type 关Fig.3共A兲兴.
As derivation of rotational parameters from observed spectra is unlikely with the present spectral resolution, we simulate the band contour to compare with observed spectra. The spectrum of SO2-antisymmetric stretching band was
simulated with theSPECVIEWprogram43using rotational pa-rameters A, B, and C derived from B3P86/aug-cc-pVTZ cal-culations, Jmax= 100, T = 300 K, and a Doppler line shape
with full width at half maximum 共FWHM兲=2.0 cm−1. Al-though rotational parameters predicted with B3P86 differ by 1.9% from those predicted with B3LYP, the ratios of rota-tional parameters of the upper 共v=1兲 and the lower 共v=0兲
FIG. 4. 共A兲 Three-dimensional plot of time-resolved difference absorption spectra upon laser photolysis共248 nm, 7 Hz, 21 mJ cm−2兲 of a flowing mix-ture of CH3I / SO2/ CO2 共1.0/3.3/200兲 at 297 Torr and 298 K. The path length is 6.4 m and the resolution is 2.0 cm−1.共B兲 Spectra integrated for various periods. Downward features are due to destruction of precursors CH3I共1265 and 1235 cm−1兲 and SO2共1160 cm−1兲, whereas upward features A1 and A2 correspond to formation of CH3SO2and the upward feature B1 corresponds to formation of CH3SO2I.
FIG. 5.共A兲 Transient difference absorption spectrum recorded upon 248 nm photolysis of a flowing mixture of CH3I / SO2/ CO2 共1.0/3.3/200兲 at 297 Torr and 298 K; resolution is 2 cm−1and average period is 20– 80s. New features are marked as A1 and A2.共B兲 The background absorption spectrum of the flowing mixture before photolysis.共C兲 The transient spec-trum in共A兲 corrected for interference due to loss of parent molecules; see text.共D兲–共F兲 Stick spectra of CH3SO2, syn-CH3OSO, and anti-CH3OSO, respectively, based on harmonic vibrational wave numbers and IR intensities predicted with the B3P86/aug-cc-pVTZ method.
states are nearly identical for both methods. Simulated a-, b-, and c-type spectra are shown in traces 共A兲–共C兲 of Fig. 6, respectively. The experimental observation shown in trace 共D兲 of Fig. 6 agrees satisfactorily with the b-type contour 关trace 共B兲 of Fig. 6兴; this agreement further supports our assignment of this band to the SO2-antisymmetric stretching
mode of CH3SO2. Keeping values A
⬙
= 0.2834 cm−1, B⬙
= 0.2583 cm−1, C
⬙
= 0.1481 cm−1 for v = 0 and A⬘
= 0.2822 cm−1, B
⬘
= 0.2579 cm−1, C⬘
= 0.1479 cm−1 for v = 1of the SO2-antisymmetric stretching mode of CH3SO2共Table II兲 unaltered in the simulation, a value0= 1280.1 cm−1was
thus derived. Fitting of the SO2-symmetric stretching band was not performed because of its unsatisfactory quality.
C. Possible formation of CH3SO2I
At a later stage of reaction, 100s after photolysis of the flowing mixture of CH3I / SO2/ CO2, a new feature near
1159 cm−1appeared, as marked B1 in Fig.4共B兲. The rise of this feature was accompanied by the decay of CH3SO2,
in-dicating that this feature might be due to secondary reactions of CH3SO2. Because photolysis of SO2 at 248 nm is
negligible,41 the major species upon photolysis of the mix-ture are expected to be CH3, I, and SO2. Two likely products
of possible secondary reactions are therefore CH3SO2I and 共CH3兲2SO2.
Vibrational wave numbers for the SO2-symmetric and
SO2-antisymmetric stretching modes of共CH3兲2SO2were
re-ported to be 1162 and 1354 cm−1, respectively.44The former fits satisfactorily with our observation and the latter was in-terfered with by absorption of SO2 in our experiments.
Vi-brational wave numbers of CH3SO2I are unreported, but wave numbers of the SO2-symmetric stretching bands of
CH3SO2F, CH3SO2Cl, and CH3SO2Br were reported to be
1223, 1190, and 1178 cm−1, respectively,45,46
as listed in TableIII.
Harmonic vibrational wave numbers for the SO2-stretching modes of CH3SO2X 共X=F, Cl, Br, and I兲,
CH3SO2CH3, and CH3SO2 predicted with B3P86/ 3-21G*
are compared with experimental results in Table III. Using the ratios of observed to calculated values for CH3SO2X 共X
= F, Cl, and Br兲, we estimated that the SO2-symmetric
stretching mode of CH3SO2I should lie in the region of
1146– 1167 cm−1, similar to that of共CH
3兲2SO2. Hence,
iden-tifying the carrier of the B1 band by vibrational wave num-bers alone is ambiguous.
The disparate masses of共CH3兲2SO2and CH3SO2I imply
distinctive rotational parameters for these molecules; the former is much lighter, hence should have a bandwidth much greater than that of the much heavier CH3SO2I. Trace共A兲 of Fig. 7 shows a spectrum 共1090–1220 cm−1兲 integrated for
the period of 150– 250s after photolysis. Trace共B兲 of Fig. 7is a simulated SO2-symmetric stretching band of CH3SO2I
using rotational parameters predicted with B3P86/ 3-21G*.
The molecular parameters of CH3SO2I used for simulation
are Jmax= 100, T = 300 K, a Doppler line shape with
FWHM= 2.0 cm−1, A
⬘
= 0.148 52, B⬘
= 0.039 24, C⬘
= 0.038 77, A
⬙
= 0.148 89 cm−1, B⬙
= 0.039 29 cm−1, C⬙
= 0.038 79 cm−1, and
0= 1159 cm−1. According to the
calcu-lated vector of the dipole derivative, the b-type structure dominates. Trace共C兲 of Fig.7shows an experimental spec-trum of 共CH3兲2SO2 in the 1190– 1120 cm−1 region.44 Our
experimental result fits satisfactorily with the simulated spec-trum of CH3SO2I, whereas the absorption band of 共CH3兲2SO2 shows a much greater width than our observed
FIG. 6. Comparison of simulated and observed spectra of the SO2-antisymmetric stretching mode of CH3SO2. Parameters employed in the simulation are T = 300 K, Jmax= 100,0= 1280.1 cm−1, A⬙= 0.2834 cm−1, B⬙= 0.2583 cm−1, C⬙= 0.1481 cm−1, A⬘= 0.2822 cm−1, B⬘= 0.2579 cm−1, and C⬘= 0.1479 cm−1.共A兲 a-type component. 共B兲 b-type component. 共C兲 c-type component.共D兲 Corrected experimental observation shown in trace 共C兲 of Fig.5; the transition is expected to have mainly a b-type component.
TABLE III. Comparison of SO2-antisymmetric and SO2-symmetric stretching wave numbers共in cm−1兲 of CH3SO2X共X=F, Cl, Br, and I兲, 共CH3兲2SO2, and CH3SO2derived from B3P86/ 3-21G*calculations and from experiments.
Calc. Expt. Reference SO2-antisymmetric stretching SO2-symmetric stretching SO2-antisymmetric stretching SO2-symmetric stretching CH3SO2F 1462 1236 1415 共0.968兲a 1223 共0.989兲a 45 CH3SO2Cl 1427 1181 1401 共0.982兲 1190 共1.008兲 45 CH3SO2Br 1414 1174 1391 共0.984兲 1178 共1.003兲 45and46 CH3SO2I 1401 1158 1159 共1.001兲 This work 共CH3兲2SO2 1398 1182 1356 共0.970兲 1165 共0.986兲 44 CH3SO2 1230 1035 1280 共1.041兲 1076 共1.040兲 This work
aRatios of experimental to calculated vibrational wave numbers are listed in parentheses.
244301-6 L.-K. Chu and Y.-P. Lee J. Chem. Phys. 124, 244301共2006兲
value. The B1 band near 1159 cm−1 is hence tentatively as-signed to the SO2-symmetric stretching mode of CH3SO2I.
D. Reaction kinetics of CH3SO2
As can be seen from the three-dimensional plot of Fig. 4共A兲, the intensity of the new feature near 1280 cm−1 共A1
band兲 increases initially, reaches its maximum near 50s, then decays with time. The temporal profile of the A1 band of CH3SO2, integrated over 1280– 1300 cm−1, is shown in
Fig.8共A兲. Fitting the temporal profile of CH3SO2to a simple
model with first-order rise 共k1I兲 and decay 共k1dI 兲 yields k1I =共4.0±0.6兲⫻104s−1 and k
1d
I =共1.2±0.2兲⫻104s−1,
respec-tively.
The rise is associated with the reaction
CH3+ SO2+ M→ CH3SO2+ M , 共1兲 whereas the decay might be associated mainly with the reac-tion
CH3SO2+ I + M→ CH3SO2I + M . 共2兲
Dividing the value of k1I with 关SO2兴=1.55 ⫻1017molecule cm−3yields the bimolecular reaction
coeffi-cient k1II=共2.6±0.5兲⫻10−13cm3molecule−1s−1. The
litera-ture value for the high-pressure limit of k1 is 共2.9±0.5兲 ⫻10−13cm3molecule−1s−1,47
consistent with our observa-tion.
The temporal profile of the B1 band was fitted with a single-exponential rise, shown in Fig. 8共B兲, to yield k2I =共1.3±0.2兲⫻104s−1; the value is similar to k
1d
I , supporting
that the formation of CH3SO2I resulted from the reaction of CH3SO2. Although detailed reaction modeling is unlikely be-cause only limited species were observed in this work, we consider that the proposed mechanism is plausible.
V. CONCLUSION
We employed the step-scan time-resolved Fourier-transform absorption technique to detect the SO2-symmetric and SO2-antisymmetric stretching bands of the transient
spe-cies CH3SO2 upon photolysis of a flowing gaseous mixture
containing CH3I, SO2, and CO2 with the
B3P86/aug-cc-pVTZ method; observed vibrational wave numbers of 1076 and 1280 cm−1and relative IR intensities are consistent with
those predicted for the SO2-symmetric and
SO2-antisymmetric stretching modes of CH3SO2,
respec-tively. Our spectra conform satisfactorily to a simulation based on rotational parameters derived from these quantum-chemical calculations. A band near 1159 cm−1 might be as-signed to the SO2-symmetric stretching mode of CH3SO2I
that was produced at a later stage of the reaction. The tem-poral profile of absorption bands of CH3SO2 and CH3SO2I
provide kinetic information that is consistent with existing data and our proposed mechanism.
ACKNOWLEDGMENTS
We thank V. Stakhursky and T. A. Miller for providing theSPECVIEWsoftware for spectral simulation. National Sci-ence Council of Taiwan 共Grant No. NSC94-2113-M-009-017兲 and National Chiao Tung University supported this work.
1T. S. Bates, B. K. Lamb, A. Guenther, J. Dignon, and R. E. Stoiber, J. Atmos. Chem. 14, 315共1992兲.
2R. J. Charlson, J. E. Lovelock, M. O. Andreae, and S. G. Warren, Nature 共London兲 326, 655 共1987兲.
3S. B. Barone, A. A. Turnipseed, and A. R. Ravishankara, Faraday Dis-cuss. 100, 39共1995兲.
4D. Borissenko, A. Kukui, G. Laverdet, and G. Le Bras, J. Phys. Chem. A
107, 1155共2003兲.
5A. Kukui, V. Bossoutrot, G. Laverdet, and G. Le Bras, J. Phys. Chem. A
104, 935共2000兲.
FIG. 7. Comparison of simulated and observed spectra of the SO2-symmetric stretching mode of CH3SO2I.共A兲 Experimental observation integrated for period of 150– 250s from spectra in Fig.4共A兲. 共B兲 Simu-lated spectrum of CH3SO2I with only the b-type component; rotational pa-rameters are described in the text.共C兲 A previously reported spectrum of 共CH3兲2SO2共Ref.44兲 in the region of 1090–1220 cm−1. The transient ab-sorption band in共A兲 fits better with the simulated spectrum of CH3SO2I in 共B兲.
FIG. 8. Temporal profiles of the A1 absorption band of CH3SO2integrated over 1280– 1300 cm−1共A兲 and the B1 absorption band of CH
3SO2I inte-grated over 1172– 1146 cm−1 共B兲 recorded upon 248 nm photolysis of a flowing mixture of CH3I / SO2/ CO2共1.0/3.3/200兲 at 298 K and 297 Torr. Fitted results are represented with solid lines; see text.
6A. Ray, I. Vassalli, G. Laverdet, and G. Le Bras, J. Phys. Chem. 100, 8895共1996兲.
7N. R. Jensen, J. Hjorth, C. Lohse, H. Skov, and G. Restelll, J. Atmos. Chem. 14, 95共1992兲.
8A. A. Turnipseed, S. B. Barone, and A. R. Ravishankara, J. Phys. Chem.
96, 7502共1992兲.
9S. P. Urbanski, R. E. Stickel, and P. H. Wine, J. Phys. Chem. A 102, 10522共1998兲.
10V. Riffault, Y. Bedjanian, and G. Le Bras, J. Phys. Chem. A 107, 5404 共2003兲.
11T. E. Eriksen and J. Lind, Radiochem. Radioanal. Lett. 25, 11共1976兲. 12C. Chatgilialoglu, D. Griller, and M. Guerra, J. Phys. Chem. 91, 3747
共1987兲.
13A. G. Davies, B. P. Roberts, and B. R. Sanderson, J. Chem. Soc., Perkin Trans. 2 1973, 626.
14C. Chatgilialoglu, B. C. Gilbert, C. M. Kirk, and R. O. C. Norman, J. Chem. Soc., Perkin Trans. 2 1979, 1084.
15M. D. Sevilla, D. Becker, and M. Yan, Int. J. Radiat. Biol. 57, 65共1990兲. 16C. Chatgilialoglu, B. C. Gilbert, and R. O. C. Norman, J. Chem. Soc.,
Perkin Trans. 2 1980, 1429.
17A. J. Frank and F. Turecek, J. Phys. Chem. A 103, 5348共1999兲. 18R. J. Boyd, A. Gupta, R. F. Langler, S. P. Lownie, and J. A. Pincock, Can.
J. Chem. 58, 331共1980兲.
19S. R. Davis, J. Phys. Chem. 97, 7535共1993兲. 20M. L. McKee, Chem. Phys. Lett. 211, 643共1993兲.
21S. M. Resende and F. R. Ornellas, J. Braz. Chem. Soc. 13, 565共2002兲. 22S.-H. Chen, L.-K. Chu, Y.-J. Chen, I-C. Chen, and Y.-P. Lee, Chem. Phys.
Lett. 333, 365共2001兲.
23L.-K. Chu, Y.-P. Lee, and E. Y. Jiang, J. Chem. Phys. 120, 3179共2004兲. 24J. Eberhard, P.-S. Yeh, and Y.-P. Lee, J. Chem. Phys. 107, 6499共1997兲. 25Y.-J. Chen, L.-K. Chu, S.-R. Lin, and Y.-P. Lee, J. Chem. Phys. 115,
6513共2001兲.
26E. Y. Jiang, Spectroscopy共Eugene, Or.兲 17, 22 共2002兲.
27W. Uhmann, A. Becker, C. Taran, and F. Siebert, Appl. Spectrosc. 45, 390共1991兲.
28O. V. Rattigan, D. E. Shallcross, and R. A. Cox, J. Chem. Soc., Faraday Trans. 93, 2839共1997兲.
29M. J. Frisch, G. W. Trucks, H. B. Schlegel et al.,
GAUSSIAN 03Revision A.7, Gaussian Inc., Pittsburgh, PA, 2003.
30A. D. Becke, J. Chem. Phys. 98, 5648共1993兲.
31C. Lee, W. Yang, and R. G. Parr, Phys. Rev. B 37, 785共1988兲. 32J. P. Perdew, Phys. Rev. B 33, 8822共1986兲.
33T. H. Dunning, Jr., J. Chem. Phys. 90, 1007共1989兲.
34D. E. Woon and T. H. Dunning, Jr., J. Chem. Phys. 98, 1358共1993兲. 35M. H. Sirvetz, J. Chem. Phys. 19, 938共1951兲.
36K. P. Huber and G. Herzberg, Constants of Diatomic Molecules, Molecu-lar Spectra and MolecuMolecu-lar Structure IV共Van Nostrand Reinhold, New York, 1979兲.
37R. W. Kilb, J. Chem. Phys. 23, 1736共1955兲.
38M. Bahou, S.-F. Chen, and Y.-P. Lee, J. Phys. Chem. A 104, 3613 共2000兲.
39R. R. Williams, Jr. and R. A. Ogg, Jr., J. Chem. Phys. 15, 696共1947兲. 40K. Bogumil, J. Orphal, T. Homann et al., J. Photochem. Photobiol., A
157, 167共2003兲.
41W. B. DeMore, S. P. Sander, D. M. Golden, R. F. Hampson, M. J. Kurylo, C. J. Howard, A. R. Ravishankara, C. E. Kolb, and M. J. Molina, Chemi-cal Kinetics and PhotochemiChemi-cal Data for Use in Stratospheric Modeling 共Jet Propulsion Laboratory, Pasadena, CA, 1997兲.
42L. S. Rothman, C. P. Rinsland, A. Goldman et al., J. Quant. Spectrosc. Radiat. Transf. 60, 665共1998兲.
43V. Stakhursky and T. A. Miller, 56th OSU International Symposium on Molecular Spectroscopy, Columbus, OH, 2001 SpecView: Simulation and Fitting of Rotational Structure of Electronic and Vibronic Bands, http://www.chemistry.ohio-state.edu/~vstakhur
44NIST/EPA Gas-Phase Infrared Database, NIST Standard Reference Data-base 35, U.S. Department of Commerce, National Institute of Standards and Technology, Gaithersburg, MD, 2004.
45G. Geiseler and B. Nagel, J. Mol. Struct. 16, 79共1973兲.
46B. Ballesteros, N. R. Jensen, and J. Hjorth, J. Atmos. Chem. 43, 135 共2002兲.
47F. C. James, J. A. Kerr, and J. P. Simons, J. Chem. Soc., Faraday Trans. 1 69, 2124共1973兲.
244301-8 L.-K. Chu and Y.-P. Lee J. Chem. Phys. 124, 244301共2006兲