Left ventricular mass and correlated atherosclerotic risk factors in
young adolescents: report from Chin-Shan community
cardiovascular study in Taiwan
Kuo-Liong Chien
a, Fung-Chang Sung
b, Hsiu-Ching Hsu
a, Ta-Chen Su
a,
Yuan-Teh Lee
a,*
aDepartment of Internal Medicine, National Taiwan Uni6ersity Hospital,7Chung-Shan S. RD, Taipei100, Taiwan, ROC bCollege of Public Health, National Taiwan Uni6ersity, Taipei, Taiwan, ROC
Received 8 September 1999; received in revised form 15 May 2000; accepted 17 June 2000
Abstract
Various subclinical disease indicators can be used as an early stage marker of atherosclerosis. Left ventricular (LV) mass has been related to cardiovascular morbidity and mortality. The distribution of LV mass in Chinese is rarely studied and nothing is known about its relationships with various atherosclerotic risk factors in young teenagers, in particular, aspects of lipid profiles. We performed a community-based survey of 523 males and 555 females, aged 12 – 15, in Chin-Shan, a suburb area near Taipei, Taiwan. LV mass was calculated from the Penn convention. Normalized LV mass by height with power of 2.7 was defined. LV mass and normalized LV mass were significantly greater in males than in females. There were significant positive correlation coefficients between LV mass and age, blood pressure, body mass index, low density lipoprotein cholesterol (LDL-C), apolipoprotein (Apo) B, fasting insulin levels and significant negative correlation coefficients between LV mass and high density lipoprotein cholesterol (HDL-C) and Apo A1 level in both genders. Multiple linear regression models showed gender and body mass index (BMI) were important factors associated with LV mass or normalized values for adolescents. Age and systolic blood pressure were also significant predictors of LV mass, but not of normalized LV mass values. LV mass values were found to be negatively associated with HDL-C values at marginal statistically significant level. Age and BMI are the most significant factors of echocardiographic LV mass distributions in young adolescent in Taiwan. LV mass may also be associated with atherosclerotic risk factors. © 2001 Elsevier Science Ireland Ltd. All rights reserved.
Keywords:Left ventricular mass; Lipid; Risk factors; Population-based
www.elsevier.com/locate/atherosclerosis
1. Introduction
Prospective studies have recognized that high blood pressure and obesity are related to the degree of aortic atherosclerosis [1]. The clustering of atherosclerotic risk
factors in early adult life is associated with cardiovascu-lar disease in middle-aged men [2]. There are conflicts about early onset of atherosclerosis in children. As fatalities due to cardiovascular disease rarely happened in the children and young adults, it is hard to define atherosclerotic risk patterns for children in tissue stud-ies. From the postmortem studies, the characteristics of atherosclerotic lesions in adolescents are similar to that for adults [3,4]. Dyslipidemia, such as high low density lipoprotein cholesterol (LDL-C) and low high density lipoprotein cholesterol (HDL-C) are significantly asso-ciated with the severity of the lesion in children and early adulthood [2,5]. Yet, it is of interest to associate dyslipidemia with left ventricular (LV) mass in the population at risk of cardiovascular diseases.
Abbre6iations:Apo, apolipoprotein; BMI, body mass index; HDL-C, high density lipoprotein cholesterol; IVS, interventricular septum; LDL-C, low density lipoprotein cholesterol; LV hypertrophy, left ventricular hypertrophy; LV mass, left ventricular mass; LVIDD, left ventricular internal dimension of end-diastole phase; PWT, posterior wall thickness; RWT, relative wall thickness; WHR, waist-to-hip ratio.
* Corresponding author. Tel./fax: + 886-2-23959911.
E-mail address:[email protected] (Y.-T. Lee).
0021-9150/01/$ - see front matter © 2001 Elsevier Science Ireland Ltd. All rights reserved. PII: S 0 0 2 1 - 9 1 5 0 ( 0 0 ) 0 0 5 7 9 - 7
LV hypertrophy, determined by echocardiography, has been recognized as being strongly associated with cardiovascular diseases [6,7]. The Framingham Heart Study found a six to eight-fold increased risk of cardio-vascular events for individuals with LV hypertrophy in adults [8]. Previous studies had reported that, in young adolescents, LV hypertrophy was associated with higher blood pressure, obesity and genders [9]. Echocar-diogrphy has been recommended as the screening tool for LV hypertrophy [10 – 14]. To the best of our knowl-edge, little has been documented about the relationships between lipid profiles and echocardiographic LV mass in the young population.
Morbidity and mortality from cardiovascular dis-eases in Taiwan are uprising, especially in coronary heart disease [15]. In clinical setting, some of atheroscle-rotic risk factors have developed in young adults with the advance of Taiwan’s economic growth and the westernized life style. This study was designed to exam-ine patterns of atherosclerotic risk factors, especially lipid profiles, and to interpret their associations with echocardiographically determined LV mass for young adolescents in Chin-Shan community, Taiwan.
2. Methods and materials
2.1. Study design and population
Since 1990, we have established the Chin-Shan com-munity cardiovascular cohort (CCCC) study and aimed to conduct the longitudinal investigation on cardiovas-cular diseases in Taiwan [16,17]. In 1997, we extended a further survey to include adolescents in the only middle school from this community. Letters describing the purpose of the study were first sent to the parents of those households with children. All the 1124 students, aged 12 – 15, in this middle school were invited for participation. A clinic was set up at the middle school in an education hall by the study team consisting of four cardiologists and five assistant nurses. Study activ-ity was performed daily, class by class, on weekdays for 3 months. A total of 1078 students (96% response rate) received complete blood and echocardiographic mea-surements eligible for data analysis. The rest of 46 students were excluded because of poor echocardio-graphic images. Trained cardiologists took standardized clinical examinations to assess the status of anthropo-metric measurements. A self-administered questionnaire was used for collecting every subject’s basic demo-graphic data, dietary behavior, history of smoking and socioeconomic status of the respective family. Physical examination and 12-lead electrocardiogram were then performed by one of the cardiologists. The student was seated comfortably with the arm supported and posi-tioned at the level of heart, and the measurements were
taken with the arm after10-min rest. When measuring blood pressure, the bladder was inflated quickly, and was deflated 2-mmHg every second, and the disappear-ance of Korotkoff phase V sound was recorded as diastolic pressure. Two blood pressure readings were taken separately by 5 min apart. The average of the two blood pressure readings was used for data analyses. 2.2. Laboratory tests
A blood sample was drawn after a 12-h overnight fast. The serum samples were immediately refrigerated and transported to the National Taiwan University Hospital within 6 h and stored at − 70°C for batch assay. Standard enzymatic methods were used to deter-mine serum cholesterol and triglyceride (Merck 14354 and 14366, respectively). HDL-C level was measured in the supernatant after precipitating with magnesium chloride phosphotungstate reagents (Merck 14993). The LDL-C content was measured as ‘total cholesterol mi-nus cholesterol in the supernatant’ by precipitation method [18,19], since the HDL-C was precipitated us-ing heparin/citrate reagent (Merck 14992). Apolipo-protein (Apo) A1 and B concentrations were measured by turbidimetric immunoassay using commercial kits (Sigma). Blood samples for glucose analyses were drawn into glass test tubes each containing 80 mol/l fluoride/oxalate reagent. After centrifugation at 4°C, 1500 × g for 10 min, glucose levels were measured on supernatant by enzymatic assay (Merck 3389 commer-cial kit, Germany) in an Eppendorf 5060 autoanalyzer. Plasma insulin level was determined using the ELISA method in which a reagent kit supplied by the Dako Co. was employed. The assay did not measure intact proinsulin, and provided specificity of insulin assay [20]. The level of minimal detection of insulin was 0.02 mU/ml, with CV of 5.0%.
2.3. Echocardiographic measurements
All echocardiographic studies were made with com-mercially available echocardiographs (HP2500) equipped with each a 2.5/2.0-MHz phase-array trans-ducer and a VHS videotape recorder. All subjects were lying in the left lateral decubitus position to assure the standardized measurement. Observers were not aware of the participant’s cardiovascular status during the procedure of echocardiographic examinations and all pictures were taken at the end of expiratory phase.
A two-dimensional parasternal long-axis view of LV was obtained to adjust M-mode cursor position perpen-dicular to the interventricular septum and posterior wall of LV at the mitral valve chordal level. M-mode measurements were obtained from the long-axis view of LV according to the standard procedure recommended by the American Society of Echocardiography. Gain
control was adjusted to optimize the recording of the endocardial and epicaridal surface and to ensure a continuous line at end diastole and end systole phase [21].
2.4. Determination of LV mass
The LV measurements included the interventricular septal thickness at end diastole (IVS), the posterior wall thickness at end diastole (PWT), as well as the LV internal dimension at end diastole (LVIDD) and end systole (LVIDS). LV mass was calculated from the Penn convention, according to the equation of De-vereux and Reichek [11], which was slightly different than measurements based on the American Society of Echocardiography.
LV mass = 1.04{(IVSD + LVPWD + LVEDD)3
− (LVEDD)3} − 13.6 g.
Normalized LV mass values were calculated by one allometric value height of power 2.7, suggested by de Simone et al. [7], to control for body weight and reduce variability among population. Relative wall thickness was defined as two times LV PWT divided by LV end-diastolic internal dimension.
2.5. Reliability study of intra- and inter-rater 6ariability
A sub-sample of 15 participants was selected to receive echocardiography by the four physicians to estimate the inter-observer variability of measurement parameters. The intra-class correlation reliability was calculated by a simple replication one-way analysis of variance test [22]. The values of correlation reliability were between 0.70 and 0.85 in the various measurements.
2.6. Statistical analysis
We first compared distributions of LV mass and normalized LV mass values by gender. Means and S.D. were presented for various continuous anthropometric and atherosclerotic risk factors. Because of skewed distributions, we analyzed triglyceride and fasting glu-cose levels using the logarithm transformation and their geometric means. Mean values were compared between genders using Students’s t-test for continuous variables. Pearson correlation coefficients were calculated to de-tect the relationships between echocardiographic parameters and various risk factors, and Fisher’s Z-tests were used to detect the significance level of vari-ables for each gender. We used multiple linear regression models to estimate the parameters and re-lated S.E. of various atherosclerotic risk factors on the outcome of LV mass, with or without normalized
val-ues, respectively. The most suitable models were chosen by Mallows’ Cp statistics to select risk factors [23]. The Cp statistic is an estimate of the standardized total mean squared error of estimation for the current data-set, and the subset models with small Cp and close to the numbers of parameters are best fitted model. Mal-lows’ Cp statistic was considered the most favored criterion for subset size selection [24]. P-values less than 0.05 were significant. All data analyses were performed using the SAS [25].
3. Results
The basic anthropometric risk profiles are presented by gender in Table 1. Males and higher systolic and diastolic blood pressure, waist-to-hip ratio (WHR) and higher fasting glucose levels than females. Lipid profi-les, including total cholesterol, tiglyceride, LDL-C, Apo B and fasting insulin levels were higher in females than in males. The prevalence of hyperglycemia, defined as fasting glucose greater than 126 mg/dl, was significantly higher in boys than in girls (11.8 vs. 8.0%, respectively, 2-test P value = 0.009, data not shown).
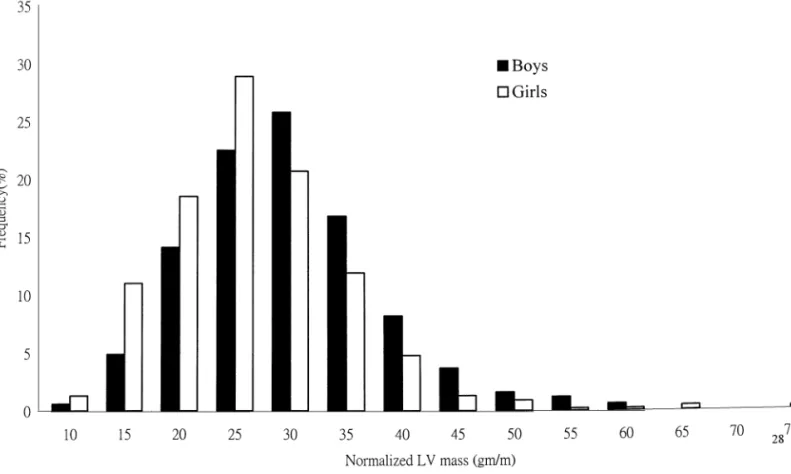
Table 2 shows the echocardiographically determined LV mass and related measurements for both genders. LV mass and normalized LV mass were significantly higher in males than in females, as were IVS, PWT and LVIDD values. However, females had higher relative wall thickness (RWT) than males. When gender-specific normalized LV mass was plotted in graph, the distribu-tion showed higher values for boys than for girls after the summit of frequency (Fig. 1).
The Pearson’s correlations coefficients showed signifi-cant positive correlations between LV mass and age, blood pressure, body mass index (BMI), WHR, triglyc-eride, LDL-C, Apo B, and fasting insulin levels, and significant negative correlations between LV mass and HDL-C and Apo A1 level for both genders (Table 3). The correlations found, albeit significance, were gener-ally modest. Most of these correlation coefficients re-mained significant for normalized LV mass.
When a multiple linear regression model was applied to predict LV mass values, Mallows’ Cp criteria was used to select the most parsimonious model (Table 4). After adjusting for other variables, LV mass for girls was 24.8 g lower than that for boys. BMI was also a significant variable predicting both LV mass and nor-malized values. Age and systolic blood pressure were significant in predicting LV mass, but not normalized LV mass values. HDL-C levels had the effect of lower-ing LV mass values at a modest significance level, while LDL-C levels had a marginal significant positive effect on LV mass. The adjusted R2 values by selected
vari-ables in the best-fitted model were 0.354 in LV mass and 0.230 in normalized LV mass (data not shown).
4. Discussion
The results clearly demonstrated several atheroscle-rotic risk factors, such as age, sex, BMI, blood pressure and lipid profiles, on the echocardiographically deter-mined LV mass for adolescents. To the best of our knowledge, this is the first report of the distribution and its associated factors of LV mass for community-based Chinese adolescents.
Age has a strong and persistent effect on LV mass throughout life. The associations between LV mass and gender or age have been well-established [26 – 29]. There are gender differences on LV mass during adolescents with respect to blood pressure and body size [26]. These effects were clearly demonstrated in our Chin-Shan young adolescents. All studies as mentioned have the implication that age is influential on LV mass at an early age. Furthermore, LV mass is greater in men than in women in adults, after controlling for age, BMI,
blood pressure, and lipid profiles [27 – 29]. Etiologically, increasing sympathetic activity or sex hormone effect was assumed to be crucial for the difference of LV mass between genders [30]. It is of value to note that increas-ing sympathetic nerve activity in males and adiposity in females as plausible explanations for LV hypertrophy [31].
The index of obesity, such as high body mass index and WHR, has been related to increased LV mass in adult population [27,32,33]. Kono et al. also have found obesity is closely related to LV mass in Japanese children [34]. In our study, obesity is an independent predictor of LV mass. Obesity had its pathophysiologi-cal mechanisms, such as hemodynamic and sympa-thetic, on the development of hypertension and LV hypertrophy [35]. It is particularly associated with dys-lipidemia and insulin resistance syndrome. Thus, the clusterings of metabolic risk factors increase the likeli-hood of cardiovascular events.
Table 1
Differences between boys and girls in basic anthropometric and atherosclerotic risk factorsa
Variable Boys (n = 523) Girls (n = 555) P value
Mean S.D. Mean S.D. Age (years) 14.4 1.00 14.4 0.97 0.920 0.0001 107.5 12.2 103.1 11.4 SBP (mmHg)*** 0.023 66.2 8.2 65.0 8.3 DBP (mmHg)* 0.192 3.1 19.6 BMI (kg/m2) 19.4 3.2 0.05 0.0001 WHR*** 0.78 0.06 0.74 Cholesterol (mg/dl)*** 157.5 27.8 165.6 29.6 0.0001 31.3 78.0 0.0004 33.5 70.9 Triglyceride (mg/dl)*** 0.705 45.5 10.9 45.8 9.8 HDL-C (mg/dl) 65.5 26.1 LDL-C (mg/dl)*** 74.1 27.9 0.0001 Fasting glucose (mg/dl)*** 112.2 16.4 108.7 14.2 0.0002 Apolipoprotein A1 (mg/dl) 110.1 18.0 110.8 18.7 0.563 11.8 44.8 0.0001 12.0 41.2 Apolipoprotein B (mg/dl)*** 7.73 6.79 Insulin (mu/ml)* 8.25 4.60 0.014 4.175 0.404 Triglyceride (mg/dl)†*** 4.287 0.362 0.0001 0.118 0.0001 Fasting glucose (mg/dl)†*** 4.713 0.122 4.681 1.81 0.57 Insulin (mu/ml)†*** 1.98 0.49 0.0001
aS.D., standard deviation; †, geometric mean; SBP, systolic blood pressure; DBP, diastolic blood pressure; BMI, body mass index; HDL-C,
high-density-lipoprotein cholesterol; LDL-C, low-density-lipoprotein cholesterol; WHP, waist-to-hip ratio; *, PB0.05; **, PB0.01; ***, PB0.001. Table 2
Echocardiographically determined LV mass and associated measurements in study adolescents by gender (n = 1078)a
Boys (n = 523)
Variable Girls (n = 555) P value
Mean S.D. Mean S.D. 123.0 28.30 LV mass (g)*** 38.20 98.90 0.0001 8.40 29.00 32.50 8.20 Normalized LV mass (g/m2.7)†*** 0.0001
Interventricular septum thickness (mm)* 7.57 1.19 7.38 1.27 0.013
7.54
LV posterior wall thickness (mm)* 7.70 1.34 1.24 0.035
45.24
End-diastolic internal dimension (mm)*** 4.37 41.20 3.78 0.0001
34.3 6.65
Relative wall thickness (%)††*** 36.9 7.13 0.0001
a†, LV mss normalized by allometric parameter of height, with power of 2.7; ††, relative wall thickness — two times LV posterior wall
Fig. 1. The distribution of sex-specific normalized LV mass in the study population (n = 1078). Table 3
Pearson correlation coefficients between LV mass and demographic and atherosclerotic risk factors in study adolescents by gender (n = 1078)a
Girls (n = 555)
Variable Boys (n = 523)
Normalized LV mass LV mass Normalized LV mass LV mass
0.16*** 0.32*** 0.05 Age (years) 0.10* SBP (mmHg) 0.33*** 0.18*** 0.17*** 0.13** 0.13** 0.13** 0.11* DBP (mmHg) 0.29*** 0.48*** 0.47*** 0.43*** BMI (kg/m2) 0.54*** 0.19*** 0.17*** 0.19*** WHR 0.19*** 0.06 Cholestero (mg/dl) 0.02 0.05 0.08 Triglyceride (mg/dl) 0.19*** 0.14** 0.09* 0.10* −0.18*** −0.16*** −0.17*** −0.21*** HDL-C (mg/dl) LDL-C (mg/dl) 0.15*** 0.14** 0.18*** 0.17*** 0.04 0.03 0.05 Fasting glucose (mg/dl) 0.09* 0.09* 0.06 −0.12** Apolipoprotein A1 (mg/dl) −0.15*** 0.11* 0.10* 0.11* Apolipoprotein B (mg/dl) 0.07 0.13** 0.77 0.08* Triglyceride (mg/dl) 0.19*** 0.04 0.04 0.64 Fasting glucose (mg/dl) 0.10* 0.11* 0.10* 0.08 Insulin (mu/ml) 0.13** Insulin (mu/ml) 0.11* 0.10* 0.12** 0.10*
a†, Geometric mean; abbreviation — BMI, body mass index; WHR, waist-to-hip-ratio; HDL-C, high-density-lipoprotein cholesterol; LDL-C,
low-density-lipoprotein cholesterol; Lp(a). ApoA1, apolipoprotein A1; ApoB, apolipoprotein B; *, PB0.05; **, PB0.01; ***, PB0.001. Hypertension was found to be strongly associated
with LV mass reported elsewhere [28,36 – 38]. Increased vascular tone and arterial wall stiffness due to hyper-tension may place a greater load on the heart. In Chin – Shan adolescents, 1.0 mmHg increase in systolic blood pressure may increase LV mass by 0.18 g. LV
hypertrophy can regress if blood pressure is controlled. Strategies on blood pressure management are undertak-ing at this community.
In this study, we have attempted to define the rela-tionships between various lipid profiles and LV mass. Indeed, this relation between normal LV mass and lipid
Table 4
The most parsimonious models selected by Mallows’ Cp criteria to predict left ventricular mass and normalized left ventricular mass in the study adolescentsa
Variable LV mass Normalized LV mass
Parameter S.E. P value Parameter S.E. P value
Intercept −19.11 16.16 0.238 13.56*** 2.22 0.0001 −24.84*** 1.83 0.0001 Sex (girls/boys) −3.407*** 0.459 0.0001 – – – 0.0001 0.917 4.363*** Age (years) 0.029 0.081 0.178*
Systolic blood pressure (mm/Hg) – – –
0.318 4.517***
Body mass index (kg/m2) 0.0001 1.129*** 0.077 0.0001
HDL-C (mg/dl) −0.141† 0.088 0.111 −0.047† 0.024 0.052
LDL-C (mg/dl) 0.063† 0.033 0.059 – – –
0.101
– –
Cholesterol (mg/dl) – 0.014 0.008
a†, 0.05BPB0.1; *, PB0.05; **, PB0.01; ***, PB0.001. The adjusted variables were included sex, age, systolic and diastolic blood pressure,
BMI, cholesterol, triglyceride, HDL-C, LDL-C, Apo A1, Apo B, fasting glucose, and insulin levels.
levels is weak. Only marginally significant levels showed in HDL-C and LDL-C. The roles of HDL-C in the pathogenesis of atherosclerosis have been shown in several studies [39,40], including a Chinese population [41]. It was implied that adolescents with low HDL-C and high LDL-C levels tend to have high LV mass values. Metabolic disorder such as insulin resistance syndrome is assumed alternatively to associate with dyslipidemia and LV hypertrophy. Triglyceride, Apo A1 and Apo B, on the other hand, did not have any significant association with LV mass in the fitted linear model. It was possibly due to the shared effects of other variables, especially such as obesity, age and blood pressure.
Fasting hyperinsulinemia, a marker for atheroscelerosis, has been associated with LV hypertro-phy [37,42]. Lind et al. [37] have demonstrated the relation to LV wall thickness and to LV mass, but not to LV mass index. In this study, we did not find this association for adolescent. Hyperinsulinemia, per se, is probably not a determinant for LV mass among youth. The normalized LV mass by allometric parameter of height, with power of 2.7, was one choice for adjusting LV mass [7]. Several other anthropometric variables such as body surface area and height are also indices of LV mass in adult population [28]. In adolescent popula-tion, normalizing height with power 2.7 may be more suitable [7]. Sex and BMI are the only significant parameters which influence normalized LV mass. The normalization procedure by height seemed to decrease the effects of age and blood pressure on LV mass.
This study was a cross-sectional study based on community middle school students. The results may not be generalized to all adolescents in Taiwan nor ex-tended to other Chinese populations. This study was highly appraised for its remarkable response rate through the enthusiastic cooperation among commu-nity leaders and school teachers. The data excluded for analysis was minor and would not affect causal
infer-ence. The potential bias in this study is rather minimal. It is worthwhile to mention that this study has shown LV hypertrophy is associated with atherosclerotic risk factors in youth, especially with various lipid risk fac-tors. Thus life style modifications, such as weight reduc-tion, good dietary behavior and physical activity, should be started at childhood for the primary preven-tion of cardiovascular diseases and to prevent further cardiovascular events.
Acknowledgements
We thank cardiologists at National Taiwan Univer-sity Hospital, Yu-Jenn Huang and Ching-Chu Chien for their assistance in this study. The study was partly supported by the Power Development Foundation of Taiwan Power Company and National Science Council ( cNSC 83-0412-B002-064) in Taiwan.
References
[1] Berenson GS, Wattigney WA, Tracy RE, et al. Atherosclerosis of the aorta and coronary arteries and cardiovascular risk fac-tors in persons aged 6 – 30 years and studied at necropsy (The Bogalusa Heart Study). Am J Cardiol 1992;70:851 – 8.
[2] Mahoney LT, Burns TL, Stanford W, et al. Coronary risk factors measured in childhood and young adult life are associ-ated with coronary artery calcification in young adults: the muscatine study. J Am Coll Cardiol 1996;27:277 – 84.
[3] Kwiterovich PO, Jr. Prevention of coronary disease starting in childhood: what risk factors should be identified and treated? Coron Artery Dis 1993;4:611 – 30.
[4] PDAY Research Group. Relationship of atherosclerosis in young men to serum lipoprotein cholesterol concentrations and smoking. A preliminary report from the pathobiological determi-nants of atherosclerosis in youth (PDAY) research group. J Am Med Assoc 1990;264:3018 – 24.
[5] Kwiterovich PO, Jr. Detection and treatment of elevated blood lipids and other risk factors for coronary artery disease in youth. Ann New York Acad Sci 1995;748:313 – 30.
[6] Levy D, Garrsion RJ, Savage DD, Kannel WB, Castelli WP. Left ventricular mass and incidence of coronary heart disease in an elderly cohort the Framingham heart study. Ann Intern Med 1989;110:101 – 7.
[7] de Simone G, Daniels SR, Devereux RB, et al. Left ventricular mass and body size in normotensive children and adults: assess-ment of allometric relations and impact of overweight. J Am Coll Cardiol 1992;20:1251 – 60.
[8] Kannel WB, Levy D, Cupples LA. Left ventricular hypertrophy and risk of cardiac failure insights from the Framingham study. J Cardiovasc Pharmacol 1987;10(Suppl. 6):s135 – 40.
[9] Goble MM, Mosteller M, Moskowitz WB, Schieken RM. Sex differences in the determinants of left ventricular mass in child-hood. The Medical College of Virginia Twin Study. Circulation 1992;85:1661 – 5.
[10] Reichek N, Devereux RB. Left ventricular hypertrophy: relation-ship of anatomic echocardiographic and electrocardiographic findings. Circulation 1981;63:1391 – 9.
[11] Devereux RB, Reichek N. Echocardiographic determination of left ventricular mass in man anatomic validation of the method. Circulation 1977;55:613 – 8.
[12] Levy D, Anderson KM, Savage DD, Kannel WB, Christiansen JC, Casrelli WP. Echocardiographic detected left ventricular hypertrophy: prevalence and risk factors the Framingham heart study. The Framingham heart study. Ann Intern Med 1988;108:7 – 13.
[13] Koren MJ, Devereux RB, Casale PN, Savage DD, Laragh JH. Relation of left ventricular mass and geometry to morbidity and mortality in uncomplicated essential hypertension. Ann Intern Med 1990;114:345 – 52.
[14] Savage DD, Garrison RJ, Kannel WB, Levy D, Anderson SJ, Feinleib M, Casrelli WP. The spectrum of left ventricular hyper-trophy in a general population sample: the Framingham study. Circulation 1987;7(Suppl. 1):I26 – 33.
[15] Chien KL, Lee WC, Sung FC, Lin RS, Lee YT. The mortality pattern of acute myocardial infarction by gender in Taiwan, 1974 – 1993. J Formosan Med Assoc 1998;97:309 – 14.
[16] Chien KL, Lee YT, Sung FC, Hsu HC, Su TC, Lin RS. Hyperinsulinemia and related atherosclerotic risk factors in the population at cardiovascular risk: community-based study. Clin Chem 1999;45:838 – 46.
[17] Chien KL, Lee YT, Sung FC, Su TC, Hsu HC, Lin RS. Lipoprotein (a) level in the population in Taiwan: relationship to sociodemographic and atherosclerotic risk factors. Arteriosclero-sis 1999;143:267 – 73.
[18] Lopes-Virella M, Stone P, Ellis S, Colwell JA. Chesterol determi-nation in high-density lipoproteins separated by three different methods. Clin Chem 1977;23:382.
[19] Wieland H, Seidel D. A simple specific method for precipitation of low density lipoproteins. J Lipid Res 1983;24:904 – 9. [20] Walford S. Insulin measurement. Pract Diabetes 1989;6:56 – 8. [21] Schieken RM, Clark WR, Mahoney LT, Lauer RM. Measure-ment criteria for group echocardiographic studies. Am J Epi-demiol 1979;110:504 – 14.
[22] Fleiss JL. The Design and Analysis of Clinical Experiments. New York: Wiley, 1986:1 – 432.
[23] Mallows CP. Some comments on Cp. Technometrics 1973;15:661 – 75.
[24] Raawlings JO. Model development: selection of variables. In: Pacific G, editor. Applied Regression Analysis: a Research Tool. California: Wadsworth & Brooks/Cole Advanced Books & Soft-ware, 1988:168 – 91.
[25] SAS Institute Inc. SAS/STAT User’s guide, Release 6.03 edition. Cary, NC: SAS Institute Inc., 1988.
[26] Himmelmann A, Svensson A, Hansson L. Influence of sex on blood pressure and left ventricular mass in adolescents: the hypertension in pregnancy offspring study. J Hum Hypertens 1994;8:485 – 90.
[27] Reaven JGM, Lithel H, Landsberg L. Hypertension and associ-ated abnormalities: the role of insulin resistance and the sympa-thoadrenal system. New Engl J Med 1996;334:374 – 81. [28] Liebson PR, Grandits G, Prineas R, Dianzumba S, Flack JM,
Cutler JA, Grimm R, Stamler J. Echocardiographic correlates of left ventricular structure among 44 mildly hypertensive men and women in the treatment of mild hypertension study (TOMHS). Circulation 1993;87:476 – 86.
[29] Marcus R, Krause LK, Weder AB, Dominguez-mejia A, Schork NJ, Julius S. Sex-specific determinants of increased left ventricu-lar mass in the Tecumseh blood pressure study. Circulation 1994;90:928 – 36.
[30] Krumhold HM, Larson M, Levy D. Sex differences in cardiac adaptation to isolated systolic hypertension. Am J Cardiol 1993;72:310 – 3.
[31] Marcus R, Krause LK, Weder AB, Dominguez-mejia A, Schork NJ, Julies S. Sex-specific determinants of increased left ventricu-lar mass in the Tecumseh blood pressure study. Circulation 1994;90:928 – 36.
[32] Lauer MS, Anderson KM, Levy D. Separate and joint influences of obesity and mild hypertension of left ventricular mass and geometry: the Framingham, heart study. Am J Cardiol 1992;19:130 – 4.
[33] Messerli FH, Sundgaard-Rise K, Reisin ED, et al. Dimorphic cardiac adaptation to obesity and arterial hypertension. Ann Intern Med 1983;99:757 – 61.
[34] Kono Y, Yoshingaga M, Oku S, Nomura Y, Nakamura M, Aihoshi S. Effect of obesity on echocardiographic parameters in children. Int J Cardiol 1994;46:7 – 13.
[35] Hammond IW, Devereux RB, Alderman MH, Laragh JH. Rela-tion of blood pressure and body build to left ventricular mass in normotensive and hypertensive employed adults. J Am Coll Cardiol 1988;12:996 – 1004.
[36] Hypertension Detection and Follow-up Program Cooperative Group. Five-year findings of the hypertension detection and follow-up program prevention and reversal of left ventricular hypertrophy with antihypertensive drug therapy. Hypertension 1985;7:105 – 12.
[37] Lind L, Andersson PE, Andren B, Hanni A, Lithell HO. Left ventricular hypertrophy in hypertension is associated with the insulin resistance metabolic syndrome. J Hypertens 1995;13:433 – 8.
[38] Messerli FH, Schmieder R. Left ventricular hypertrophy a car-diovascular risk factor in essential hypertension. Drugs 1986;31(Suppl. 4):192 – 201.
[39] Austin MA. Plasma triglyceride and coronary heart disease. Arterioscler Thromb 1991;11:2 – 14.
[40] Tanne D, Yaari S, Goldbourt U. High-density lipoprotein cholesterol and risk of ischemic stroke mortality. A 21-year follow-up of 8586 men from the Israeli Ischemic Heart Disease Study. Stroke 1997;28:83 – 7.
[41] Lien WP, Lai LP, Shyu KG, Hwang JJ, Chen JJ, Lei MH, Cheng JJ, Huang PJ, Tsai KS. Low-serum, high-density lipo-protein cholesterol concentration is an important coronary risk factor in Chinese patients with low serum levels of total choles-terol and triglyceride. Am J Cardiol 1996;77:1112 – 5.
[42] Sasson Z, Rasooly Y, Byesania T, Rasooly I. Insulin resistance is an important determinant of left ventricular mass in the obese. Circulation 1993;88:1431 – 6.