Analysis of the Influence of Joint Operation of
Shihmen and Feitsui Reservoirs on Downstream
Flood Peaks for Flood Control
Chung-Min Tseng, Ming-Chang Shieh, Chao-Pin Yeh, Jun-Pin Chow, Wen Sen Lee
Abstract
The Tamsui River Basin covers the Greater Taipei Metropolitan Area, which is the most important economic center in Taiwan. Shihmen Reservoir and Feitsui Reservoir are located in the upper reaches of Tamsui River, play an important role for regulate the water use and flood control in the basin.
During flood events, release of floodwaters from Shihmen and Feitsui reservoirs is necessary due to excessive inflows. Since Tamsui River is a tidal river, downstream tide changes need to be considered to avoid disastrous water levels caused by released discharges and simultaneous tidal water flows into the estuary. The joint operation of the two reservoirs has an absolute impact on the safety of the river downstream.
In this study, we took real typhoon events as examples, based on actual rainfalls, reservoir release and tidal changes, used a 1-D numerical river flow model to simulate the unsteady river dynamics of Tamsui River. The goal was to understand the interaction between the two reservoirs’ joint operation and the tide. The impact on water levels and flows in Tamsui River is used do draw conclusions for future flood control operations.
Keywords: Joint operation for flood control, tidal river, disastrous water levels, numerical river model
1 General Introduction
1.1 Basin Overview
The Tamsui River Basin is located in the northern part of Taiwan, has a length of about 159 kilometers and a drainage area of about 2,726 square kilometers. There are three major tributaries in the upper reaches of Tamsui River: Dahan River, Xindian River and Keelung River. The Tamsui River Basin is shown in the left side of Figure 1.
The annual average rainfall in the Tamsui River Basin is about 2,400 mm. This is mainly due to the plum rain season in spring, heavy rains in the typhoon season in summer, and the northeast monsoon in winter. The Tamsui River is a tidal river, tides are mainly semidiurnal. During the typhoon period, under the conditions of low air pressure and strong winds near estuary, storm surges happen to affect the river’s water level.
Shihmen Reservoir and Feitsui Reservoir are located in the upper reaches of Dahan River and Xindian River, respectively. These reservoirs do not only regulate the water use in Greater Taipei and its surrounding areas, they also play an important role for flood control. The maximum design discharges of Shihmen Reservoir and Feitsui Reservoir are 13,800 CMS and 9,870 CMS, respectively. The historical maximum discharges are 8,476 CMS and 3,320 CMS, respectively.
1.2 Flooding Issues
Tamsui River passes through Keelung City and Greater Taipei (New Taipei City and Taipei City). The latter basin plain is a highly developed metropolitan area. With a population of more than 6.5 million, it is the most important economic center in Taiwan. Due to the limited urban space, the floodplains are highly utilized, with many parking lots and leisure parks built (see Figure 1). People can enter these facilities via evacuation gates or over dike roads. If a flood may threaten the safety of floodplains during a flood period (water level is higher than “flood warning”), authorities are in charge to announce evacuation warnings to people via messages and vehicles in the floodplains. They then close evacuation gates and dike roads.
Reservoir release during flood periods cause downstream water levels to rise. Since both Shihmen and Feitsui Reservoir are located in the upper reaches of Tamsui River, the joint operation of both reservoirs has an absolute impact on the downstream river. In addition, downstream tide changes must be considered to avoid disastrous water levels caused by released discharges and simultaneous tidal water flows into the estuary.
Since the river and the reservoirs each belong to different management agencies, the three parties need to cooperate in estimating flood extents and taking relevant measures before a flood incident happens. Tamsui River Basin is under the jurisdiction of the 10th River Management Office, Shihmen Reservoir is controlled by the Northern Region Water Resources Office, and Feitsui Reservoir is governed by Taipei City.
The purpose of this study is to simulate the unsteady river dynamics of Tamsui River by using a 1-D numerical river flow model. The goal is to understand the interaction between the two reservoirs’ joint operation and the tide, this study provides a reference for relevant authorities concerning future flood control operations.
2 Models and Tools
2.1 Rainfall-Runoff Model
In order to reflect the influence of rainfall runoff on the river flows during a flood period, a tank model was used to simulate the runoff of catchment areas. According to the description of Sugawara (1995), a tank model for simulating surface and subsurface flows of a catchment during a flood event can be composed of two tanks. Precipitation is put
into the upper tank, and the outputs from its side outlets are the calculated surface runoffs. Outputs from the lower tank represent intermediate runoff and baseflow.
2.2 1-D River Flow Model
1-D free surface flows are described by the de Saint-Venant equations (Chow,1988): Continuity equation: s l o
h
Q
b
q
q
t
x
(1) Momentum equation: 2 2 l l o oQ Q
Q
Q
h
gA
gA
q V
q V
t
x
A
x
K
(2)Where Q is the discharge (L3/T), h is the water level (L), bs is the storage width (L), A is
the cross-sectional area (L2), β is the Boussinesq coefficient, g is the gravitational acceleration (L/T2), K is the conveyance (L3/T), ql and qo are the lateral inflow and
outflow per unit length along the channel (L2/T), respectively, Vl and Vo are the respective
velocities of the lateral inflow and outflow in the direction of the channel flow (L/T). Using finite differences to discretize equations (1) and (2), the river’s water levels and discharges are obtained by numerically solving the resulting nonlinear algebraic equations using iteration (e.g. Picard iteration).
Reservoir releases become upper boundary conditions in the river flow model. The rainfall-runoff model calculates time series for each catchment area’s runoff, used as lateral inflows (see equations (1) and (2)) for the river, or as upstream boundary for tributaries without reservoir. The downstream boundary is the estuary tidal water level. 2.3 User Interface for Decision Support
The 10th river management office has developed a user interface for decision support that obtains river flow model results for flood events quickly. "Decision support" uses the latest river cross-sectional data and model parameters to simulate various hydrological conditions, mainly based on the specific geographical characteristics of Tamsui River, varying rainfall distribution and the numerous expert decision support functions designed for the operation of flood control facilities. It can provide a variety of scenarios for different rainfall predictions, tide water level changes, reservoir flood discharge operations, etc. The user interface is shown in the right side of Figure 1.
3 Scenarios based Simulation Strategy
The time of the reservoir’s peak release is often an issue concerning the downstream of Tamsui River. The local government or the public often recognize the rising water level in the river during a flood event to be caused by reservoir release times matching the time of the high tide in the estuary. In order to understand the above issue, this study used typhoon Megi in 2016 and typhoon Soudelor as simulation events.
The path and the related spatial average rainfall observed in the Tamsui River Basin are shown in Figure 2, with typhoon Megi on the left and typhoon Soudelor on the right. The average cumulative rainfall in the whole basin was 318 mm in Megi and was 235mm in Soudelor. Typhoon Megi mainly affected the Tamsui River Basin on 09/27 and typhoon Soudelor did on 08/08. In these two typhoon, several water level stations exceeded the flood warning water level. The release flows of Shihmen and Feitsui Reservoirs are presented in Figure 3.
Eight scenarios were designed to explore the impact of different reservoir peak release times on downstream river water levels. In the simulated scenarios, rainfall and estuary tide water levels are observed data. Each simulation scenario is set to keep the time series pattern of the Shihmen Reservoir release, but move it in time, such that the peak release time meets (1) the high tide level, (2) the low tide level, (3) the zero-tide level while rising tide and (4) the zero-tide level while falling tide (Figure 4). All above-mentioned scenarios for Shihmen Reservoir are combined with two conditions for release flows of Feitsui reservoir: (a) outflows based on actual release flow data and (b) assuming there is no release at all. The scenario structure is shown in Figure 5.
4 Simulation Results and Discussion
Since the Taipei Bridge water level station located near the center of Taipei is affected by the tidal wave of Tamsui River, by all flows in the upper reaches, and by the releases from both reservoirs, this study mainly uses the Taipei Bridge as a point of discussion.
4.1 Simulation Analysis Typhoon Megi
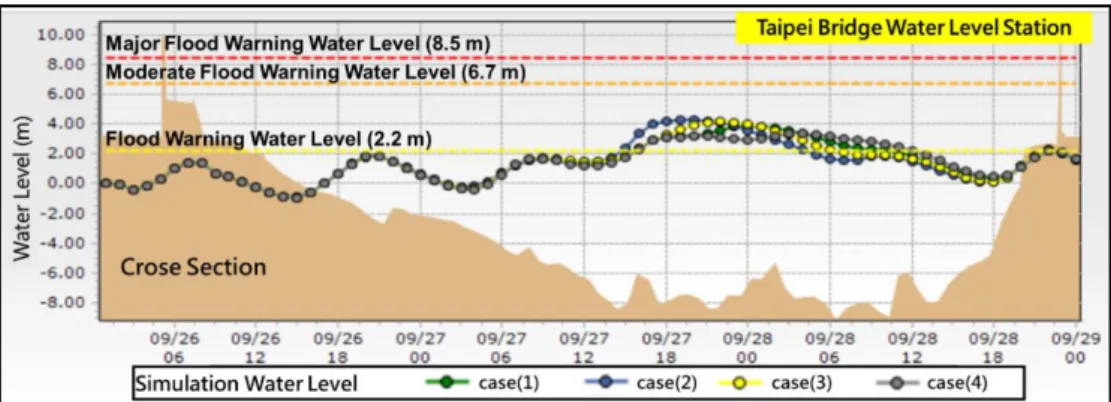
The simulation water level results of cases (1) to (4) at Taipei Bridge are shown in Figure 6. The horizontal axis is time, the vertical axis is water level (m), and the background map is the river cross section. The flood peak occurrence time and the peak value for the simulated cases (1) to (4) are summarized in Table 1. Case (2) obtains the highest peak water level at Taipei Bridge: Setting the peak release time of Shihmen Reservoir to the time of the low tide (at 9/27 14:00), the maximum water level at Taipei Bridge (4.28 m) will occur 6 hours later (9/27 20:00). It seems that the reservoir release flows downstream and meets the rising tide flowing into the estuary; therefore, Taipei Bridge has the highest simulated water level in case (2). When the Shihmen Reservoir peak release time is the same as the time of the high tide level (case (1)) or the zero-tide level with falling tide
(case (4)), the simulated peak water levels at Taipei Bridge are below 4.0 m. Furthermore, case (2) not only has the highest simulated peak water level, but also exceeded the flood warning water level 1 hour earlier than other scenarios (see Figure 6).
Cases (5) to (8) were simulated with no release of Feitsui Reservoir. The simulation results at Taipei Bridge are shown in Figure 7. The simulated water level trends of cases (2) and (6) are similar, peak water levels occur at the same time, and their magnitude only differs by 0.04 m. Differences of simulated water levels become more obvious during the falling part of the flood. Because of the relatively low release of Feitsui Reservoir during this event, and the fact that the actual reservoir release began to exceed 500 cms at 9/27 21:00, i.e. after the Shihmen Reservoir peak release, there is no significant impact of Feitsui Reservoir before the peak water level occurs, it only affects flood levels afterwards. 4.2 Simulation Analysis Typhoon Soudelor
In this study, the event typhoon SOUDELOR in 2015 was simulated as well. Results are shown in Figure 8 and Table 2. It can be seen that the highest peak water level (5.92 m) simulated at Taipei Bridge is the result of case (4), where the Shihmen Reservoir peak release time matches the time of the zero-tide level while falling tide. When the Shihmen Reservoir peak release time meets the time of the low tide (case (2)), there is a minimum simulated peak water level (5.21 m). Case (2) exceeds the flood-warning water level earliest, and case (4) touched the flood-warning water level latest, the difference between the two case spans over 5 hours (see Fig. 8).
5 Summary
Simulation results for the events typhoon Megi in 2016 and typhoon Soudelor in 2015 show that the same simulation case got completely different impacts water levels at Taipei Bridge in both events, as shown in Table 3. For typhoon Megi, case (2) has the highest simulated water level, and case (4) has the lowest, indicating that case (4) may be a preferred reservoir release operation. However, simulation results for typhoon Soudelor were just opposite, with case (2) having the lowest and case (4) having the highest simulated water level. The same reservoir operation strategies may lead to different impacts on the downstream river in different situations. Differences in the results between the events Megi and Soudelor may be mainly due to tributary flows and the nonuniform distribution of rainfall.
Therefore, when administration authorities perform reservoir flood operations based on the dam safety as a prior concern, it is not possible to determine flood release timing and operation only by tidal changes. It is still necessary to consider combined instantaneous rainfall distribution and the current situation of the river basin using appropriate tools. Flood control for Tamsui River is the responsibility of the 10th River Management Office. The impact analysis under different reservoir release conditions using river flow
simulation is an important duty during a flood period; it will provide a feedback to reservoir administration authorities and give a reference for flood control operations. It also can be a reference for decision makers during a flood.
6 Reference
American Society of Civil Engineers. (1996). “Hydrology Handbook”, second Edition, ASCE Manual and Reports on Engineering Practice No. 28, New York.
Chow, V.T.; Maidment, D.R.; Mays, L.W. (1988). Applied Hydrology. McGraw-Hill Series in Water Resources and Environmental Engineering. McGraw-Hill: New York.
Sugawara, M. (1995). Chapter 6: Tank Model. In Singh, V.P. (ed.) Computer models of watershed hydrology. Wat. Resour. Publ., Colorado, USA, 165-214.
The 10th River Management Office of Water Resources Agency. (2018). Flood Early Warning and Flood Control Integration Project under the Jurisdiction of the Tenth River Management Office in 2018. Taiwan.
Table 1: Simulation results at Taipei Bridge for cases (1) to (4) of 2016 typhoon Megi
Scenario SM peak release time
(A)
Peak water level (m)
Peak water level time (B) Time difference (B)-(A) Case (1) 9/27 21:00 3.84 9/28 00:00 +3 hrs. Case (2) 9/27 14:00 4.28 9/27 20:00 +6 hrs. Case (3) 9/27 18:00 4.18 9/27 22:00 +4 hrs. Case (4) 9/28 00:00 3.39 9/28 03:00 +3 hrs.
Table 2: Simulation results at Taipei Bridge for cases (1) to (4) of 2016 typhoon Soudelor
Scenario SM peak release time
(A)
Peak water level (m)
Peak water level time (B) Time difference (B)-(A) Case (1) 8/8 04:00 5.82 8/8 09:00 + 5 hrs. Case (2) 8/7 22:00 5.21 8/8 10:00 +12 hrs. Case (3) 8/8 01:00 5.39 8/8 10:00 + 9 hrs. Case (4) 8/8 08:00 5.92 8/8 11:00 + 3 hrs.
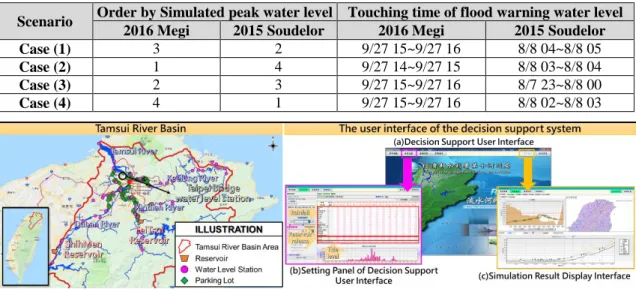
Table 3: Comprehensive comparison of simulated flood peak water levels at Taipei Bridge
Scenario Order by Simulated peak water level Touching time of flood warning water level
2016 Megi 2015 Soudelor 2016 Megi 2015 Soudelor
Case (1) 3 2 9/27 15~9/27 16 8/8 04~8/8 05
Case (2) 1 4 9/27 14~9/27 15 8/8 03~8/8 04
Case (3) 2 3 9/27 15~9/27 16 8/7 23~8/8 00
Case (4) 4 1 9/27 15~9/27 16 8/8 02~8/8 03
Figure 2: The path and spatial average rainfall in the Tamsui River Basin, where left side is typhoon Megi in 2016 and right side is typhoon Soudelor in 2015
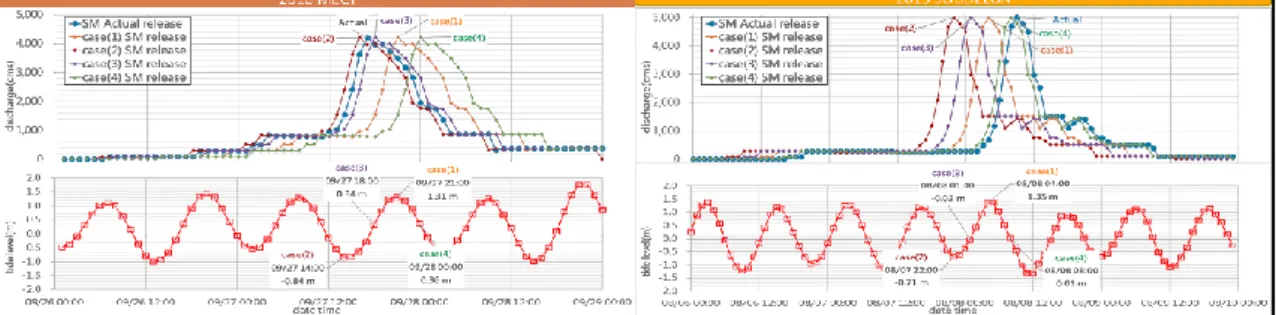
Figure 3: Outflow of the two reservoirs during typhoon Megi in 2016 and typhoon Soudelor in 2015
Figure 4: Four cases and observed case for Shihmen Reservoir’s release operation (top) and corresponding downstream tide water levels (bottom)
Figure 6: Water levels of cases (1) to (4) simulated for the typhoon MEGI event 2016
Figure 7: Water levels of cases (2) and (6) simulated for the typhoon MEGI event 2016
Figure 8: Water levels of cases (1) to (4) simulated for the typhoon SOUDELOR event 2015
7 Authors
Chung-Min Tseng (corresponding Author) Ming-Chang Shieh
Chao-Pin Yeh Jun-Pin Chou
The 10th River Management Office, Water Resources Agency, Taiwan Wen Sen Lee : Manysplendid Engineering Consultants Co., Ltd Email: wslee@manysplendid.com