CIRCUITS SYSTEMS SIGNAL PROCESS VOL. 19, NO. 3, 2000, PP. 171-186
APPLICABILITY OF
PHASE-LOCKED LOOP TO
TRACKING THE RHYTHMIC
ACTIVITY IN EEGS*
Pei-Chen Lo I a n d Yu-Yun L e e 1
Abstract. Conventional methods of spectral analysis are based on mathematical or nu- merical algorithms applied to digitized signals. This paper discusses the applicability of the phase-locked loop (PLL) approach for tracking electroencephalogram (EEG) rhythmic bands (delta, theta, alpha, or beta). The use of the PLL for frequency tracking should also aid the development of online EEG interpretation and screening based on frequency characteristics when the PLL is realized by hardware. As a result, two factors in the applicability of the PLL are: (1) translation of the EEG spectrum to a higher-frequency band by a single-sideband (SSB) modulation scheme, and (2) the narrowband spectral feature of the EEG--a small difference between two major frequencies. The PLL output is further quantized according to the EEG rhythmic bands. Our analysis shows that the integrated system is capable of tracking the EEG rhythmic patterns.
Key words: EEG rhythmic bands, PLL, SSB modulation, meditation EEG.
1. Introduction
The tracing o f human brain waves (an electroencephalogram, or EEG) was dis- covered in 1924 by Hans Berger. Berger discovered that the tracings on his record- ing paper were not entirely random; rather they displayed certain periodicities and regularities. After intensive research for several decades, the E E G has proved to be very useful, especially in the evaluation of epilepsy and sleep disorders [6]. It is now used routinely in clinics and operating rooms for the diagnosis o f certain types o f nervous-system disorders. In addition, some particular frequency corn-
* Received July 20, 1999; revised January 5, 2000 and February 23, 2000.
This work was supported by the National Science Council of Taiwan, Republic of China, under grant NSC87-2213-E-009-128.
1 Department of Electrical and Control Engineering, National Chiao Tung University, 1001 Ta-Hsueh Road, Hsinchu, Taiwan, Republic of China. E-mail for Pei-Chen Lo: [email protected] E-mail for Yu-Yun Lee: [email protected]
172 Lo .AND LEE
ponents of the EEG have been found to be correlated with different physioiogJca.~ states [2].
For clinical and scientific purposes, it is necessary to be able to characterize and quantify the EEG features. Frequency is one of the important features of EEG waveforms. EEG frequencies are conveniently classified into four rhyth- mic ranges: d e l t a ( f < 4 H z ) , t h e t a ( 4 H z < f < 8 H z ) , a l p h a ( 8 Hz _< f < 13 Hz), and beta (13 Hz < f ) [6]. The rapid growth in signal processing techniques and computer-based methods for waveform characterization facilitates the spectral analysis of electrophysiological signals. A number of methods have been proposed to characterize the spectral features of EEGs. Most methods are mathematical or numerical approaches developed in the field of digital signal processing. For instance, the short-time Fourier transform (STFT) provides a way of decomposing a time-varying signal into equal frequency bands [1! to characterize the nonstationary frequency spectra. The parametric model (e.g, autoregressive model) makes it possible to obtain spectral estimates of high res- olution and statistical significance from short data segments [8]. The period- amplitude analyses [5], [ 12], [19] use numerous algorithms (e.g., zero-crossings, peak detection, wave-shape characterization) to detect the elementary patterns and quantify the fundamental frequencies. In addition, a number of faust-growing methods [3], [10], [15], [16], [21], [23] recently have caught the attention of EEG researchers. These methods are mostly designed as a sophisticated numerical approach to analyzing the spectral features of digital EEG signals.
This study was intended to quantify and track the time-varying rhythmic pattern of EEGs based on the well-known circuit model: the phase-locked loop (PLL). The aim is to develop a real-time automatic system for EEG interpretation based on its rhythmic feature (delta, theta, alpha, or beta band). EEG monitoring based on EEG rhythmic band analysis is useful in prognosis [10]. Changes in the EEG power spectrum also reveal different levels of alertness [15]. The PLL has wide applications in the communications area, including the frequency synthesizer as well as frequency and phase modulation and demodulation [9], [13], [18], [20], [24]. Its ability to extract the time-varying frequency information arouses cur attention. However, the PLL is mostly employed m a high-frequency and nar- rowband situation; that is, one in which the frequency spectrum of the signal can be characterized by one high-frequency component dominating ever the others at a given time instant. The EEG is a multicomponent and low-frequency signal. To adapt the PLL for use as the EEG rhythm tracking system, a straightforward idea is to translate the EEG frequency spectrum to the high-frequency baud by single-sideband (SSB) modulation. The reason for employing the SSB modula- tion scheme, instead of deuble-sideband (DSB) modulation, is to avoid the false frequency components resulted from a doubling of the bandwidth.
This research work is focused on the design and application of analog PLLs, though the rapid progress of digital technology has stimulated the development of digital PLLs [7]. In EEG recording, electrical interference and biological
APPLICABILITY OF PLL TO TRACKING EEG RHYTHM 173
artifacts are likely to occur, resulting in a severely contaminated EEG segment. One consideration in using the analog PLL is that it might be designed as a real-time, prescreening tool to exclude the contaminated segments prior to digitization and storage in the computer. In addition, the results may provide an online fast reference. It is not the first attempt to investigate the applicability of PLL to EEG event detection. Johns et al. [14] have introduced the idea of applying the PLL to EEG frequency demodulation and dominant-frequency tracking. Yet they converted the EEG signal into a constant-amplitude square wave of time-varying frequency, in order to eliminate the undesirable effect of changes in the input amplitude. Afterwards, another paper presented their work of applying the PLL approach to detect sleep spindles in EEGs [4]. In their work, the PLL was applied to the raw EEG without modulation to the high-frequency range. This work, however, was intended for exploring the ability of PLL in tracking the four popular EEG rhythmic ranges, with the EEG premodulated to the higher-frequency band. The major advantage of EEG premodulation is that the PLL performs better in a high-frequency environment--there is a smaller spurious-frequency (double-frequency) component and a higher tracking speed.
In this paper, the authors do not go into details of the fundamental theory of the PLL, which has been well documented [9], [24]. Instead, the behavior of the PLL in a multifrequency environment is particularly emphasized. This paper first presents the limitation of the PLL on tracking the dominant frequency in a multifrequency environment. In Section 2, the authors analytically derive the equation of state trajectory for the input composed of two frequency components of equal magnitude. Section 3 evaluates the performance of the PLL on tracking the dominant frequency (the frequency component having the largest power) of a signal composed of two major frequency components. Section 4 presents the strategy involved in the design and implementation of the integrated system. The experimental results of applying the PLL to the SSB-modulated EEG are pre- sented in Section 5. Conclusions are drawn in Section 6.
2. State trajectory analysis for input composed of two frequencies
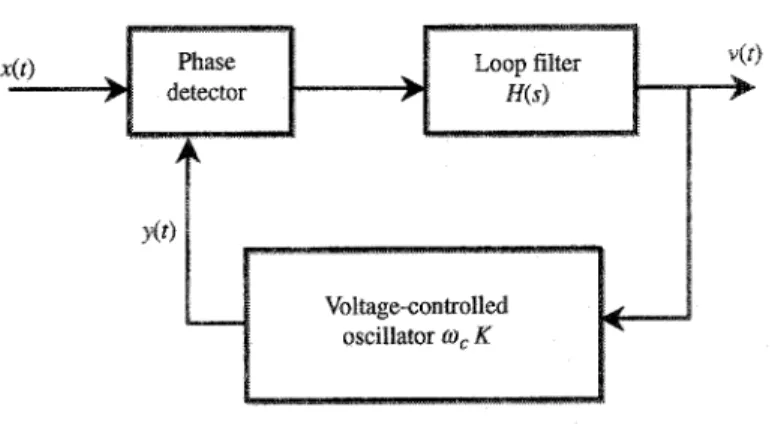
Synchronization is the main function of the PLL. The PLL has become increas- ingly popular due to its ease of alignment and efficient operation in the presence of noise. Its block diagram is shown in Figure 1. Its output is different for different applications. For example, the output is
y(t) (an
oscillatory signal) when the PLL serves as a synchronizer. On the other hand, the output isv(t)
(a frequency) when the PLL is used in the Doppler radar system. In our application,v(t)
is the output to be observed because it carries the information of the instantaneous dominant frequency of a signal.174 Lo AND LEE
x(0
Y '>I [
..........U ~ ... '--;oltage-controlled - ~ _ _
Figure 1. Block diagram of the phase-locked loop (PLL).
The loop filter
H(s)
needs to be designed according ~.o the characteristics of input signals. In addition, design of the loop filter determines the overall system performance. A satisfactory performance indicates a small steady-state error and a fast response. In general, the phase detector (PD) consists of a multiplier and a lowpass filter in the analog model, and is an exclusive OR (XOR) gate in the digi- tal model. In this study, an analog PLL model was applied. The voltage-controlled oscillator (VCO) adjusts its output frequency according to the magnitude of its inputv(t). The
quiescent frequency of the VCO(Wc)
Ls selected to be as close as possible to the incoming frequency. The VCO sensitivity (K), in combination with the gain ofH(s),
adjusts the lock-in frequency range of the PLL. Increasing the product K 9 IN[ enlarges the lock-in frequency range.The PLL operates in the way that the VCO tracks the frequency and phase of the incoming signal. A detailed discussion of the operation can be found in [9}, [24]. To investigate the feasibility of applying the PLL to an EEG involving multifrequency components, we first examine how the PLL performs on. an input signal
x(t)
of which two significant frequency components dominate. Let the system's state variable be the phase errore(t).
The plot ofde(t)~dr
versuse(t)
(the state trajectory) can be used to illustrate the stability of a PLL system. Note that the
stability
here indicates the status of the system at which the PLL is capable of tracking the incoming frequency (or, the PLL is in frequency lock). To derive the equation of state trajectory, the magnitude of the two frequency components is assumed to be equal. For components of unequal magnitude, the analytical, mathematical relation describing the state trajectory is inaccessible due to the highly nonlinear operation in the PLL. In such a case, the authors evaluate the performance in a numerical way, as shown in the next section. The nonlinear model in Figure 1 is applied in the computer simulation of the PLL operation. For simplification, let the loop filter be an ideal lowpass filter with gain M.Consider
APPLICABILITY OF P L L TO TRACKING E E G RHYTHM 175
which results in
A W l + AW2 t COS . (2.2)
x(t) = 4 s i n Wct +
2
2
Hence, the incoming phase function
O(t)
is Ao91 + Ao92O(t) =
t.
(2.3)2 Note that the output of the VCO is
y(t)
= cos(wct + O(t)), (2.4)where the phase function O(t) is related to the input voltage
v(t)
byfo'
g(t) =
KvO:)
d r + g(0).
(2.5)
Thus,
x(t)y(t)
= sin(2wct+ &wit + O(t)) +
sin(Awlt -g(t))
+ sin(2wct + Aoo2t + O(t)) +
sin(Aw2t -O(t)).
(2.6)The output of the ideal lowpass filter becomes
v(t) = M
[sin(Awlt -- 0(t)) + sin(Aw2t -- 0(t))]= 2Msin (AWl +
2
Aro2 t
- - O ( t ) ) c ~
Aw2t)
\
= 2 M s i n ( O ( t ) - O ( t ) ) c o s ( A W l
-2 Aw2t ) .
(2.7)Define the phase error as
fo'
e(t) = O(t) - O(t) = O(t) -
K v ( r ) d r - 0(0). (2.8)Accordingly,
d
d
d
(A~Ol-t, oo2t]
-dTe(t) = -~O(t) - Kv(t) = -dgO(t) - 2 K M
sin(0(t) - 0(t))cos2
/
_ AWl +2 Aw2 2 K M cos (AeOl -_~
Aw2t) sin(e(t)).
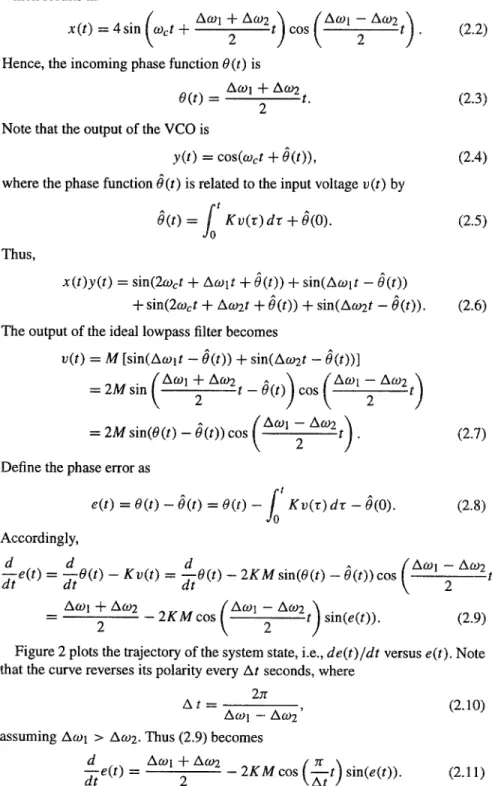
(2.9)Figure 2 plots the trajectory of the system state, i.e.,
de(t)/dt
versuse(t).
Note that the curve reverses its polarity every At seconds, where2n
A t = ~O.) 1 _ AO)2 , (2.10)
assuming ACOl > Aw2. Thus (2.9) becomes
a , d A('O1 + ACO2 2 ( z r ) &7 t
176 Lo AND LEE
de(t)
dt t I + - A t ~ ; 7 - ' ~ \ \ /~ ~ - ' ~ , ~ " , , / / , f - ' - - - , , \ ,~Aw~ + a o) 2 9 / ~ t . - - - - -, . . . . - - -. . . . - , ) '
9 4 4 " - - , / \ / ,. , " \ A t " - ~ "" ~ " ' " " " t 1 +Figure 2. Evolution of the state trajectory of the PLL in the time interval: t I < t < t! + At, given that the input is composed of two frequency components of equal magnitude. The five curves correspond to the state trajectories at t = t I (- ), t I + At~4 ( ... ), t 1 + At/2 (horizontal line), t I + 3At/4 ( . . . ), and tl + &t ( . . . ).
For instance, the state trajectory reverses its polarity every A t = 0.2 second if the difference between the two frequencies is 5 Hz (e.g., two original frequencies o f 4 Hz and 9 Hz). The evolution of the state trajectory is illustrated in Figure 2. According to (2.11), the trajectory at a given time instant is illustrated by the
sine waveform scaled by - 2 K M cos ( ~ t ) = - 2 K M cos(5sr t), with the baseline
moving A ~ 13St) upward. Let the solid curve be the trajectory at t =
2 %'--
n t
tl = I . At (l: an even integer) so that cos (Z7 l) = 1. After & t / 4 seconds, the trajectory becomes the dotted curve with the same polarity, yet oscillating
range, scaled by c o s ( ~ 7 (tl + .~!)) 0.707. The amplitude decreases until t =
q + A t / 2 , at which the trajectory becomes a flat, horizontal line. Afterwards, the trajectory starts reversing its polarity. The trajectory at t = q + At is the phase- reversed (negative) version of that at t = ti. The reversal of polarity significantly affects the output o f the PLL. The effect of reversal of polarity is briefly illustrated below.
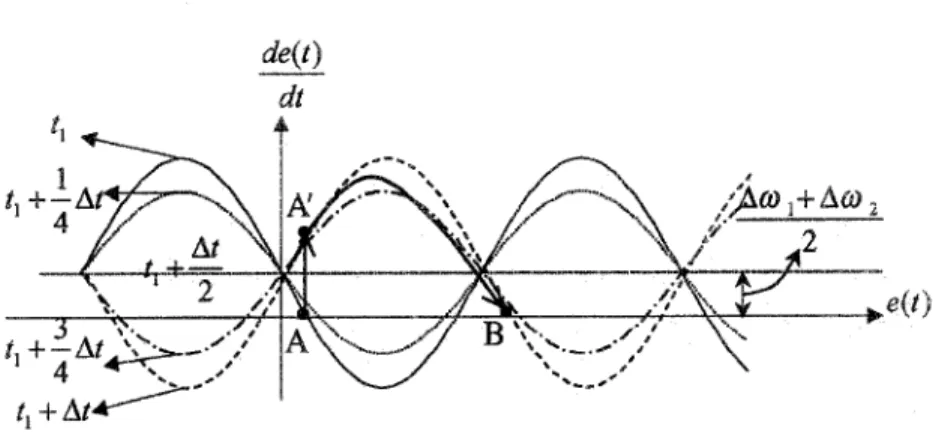
Consider that, at time t = tl, the PLL is in its steady state indicated by point A in Figure 2. The pattern o f d e ( t ) / d t versus e(t) varies with time. After At seconds, the trajectory completely reverses its polarity, which flips the steady- state point A to an unsteady point Aq The system state then moves to a new steady point B. This pattern of evolution repeats on and on, following each reversal of
polarity of the d e ( t ) / d t versus e(t) trajectory. Thus the phase error function jumps
every A t ( = 0.2) second and increases indefinitely (the e(t) curve in Figure 3,
which is modulated by 2st in computation). And the output v(t) (Figure 3) of the
P L L is a periodic pulse train with a fundamental frequency 1 / A t ( = 5) Hz; ke.,
the difference between two input frequencies. Note that the steady value of v(t)
indicated by the horizontal dashed line is in proportion to a<o~+A~ (13st rad/s, 2 or 6.5 Hz).
A P P L I C A B I L I T Y OF P L L T O T R A C K I N G E E G R H Y T H M I 7 7 e(t)(radian) t
J i
v(t)(IIz) 6.5-S
At=0.2 sec I I ~ 9 | ri
L ! ! I I ! I I I I I I I ~ t ~ tFigure 3. The phase error function e(t) and the output of the PLL v(t) for an input composed of two frequency components (4 Hz and 9 Hz) of equal magnitude.
3. Operation and behavior of PLL for multifrequency input
When the PLL is applied to detection of the dominant frequency in a multi- frequency input signal, its performance is affected by the magnitude ratio of the dominant frequency component to the secondary frequency component as well as the difference between these two frequencies. Increasing the magnitude ratio enhances the capability of successfully tracking the dominant frequency. To investigate the effect of these two factors, the authors analyze the output v(t) of the PLL given that the input is
x ( t ) = sin(2rrflt) + m sin(2Jrf2t), (3.1) where 0 < m < 1 is the magnitude of the secondary component, and the frequen- cies f l and f2 are the dominant and the secondary frequencies, respectively. The value of m gives the magnitude ratio of the secondary to the dominant frequency component. Note that the analytical derivation in Section 2 does not apply to the
178 LO AND LEE
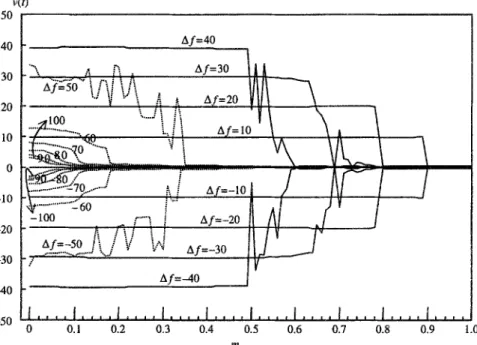
case ofm #- 1. For a signal composed of two frequencies with unequal magnitude, it is difficult to analytically derive the system equation. Accordingly, we exper- imented with the conditions for different m's directly by computer simulation of the PLL operation. Consider that the quiescent frequency is t,000 Hz and the bandwidth of the loop filter is 50 Hz. Figure 4 illustrates the dependence of the PLL output (i.e., the frequency being tracked) on the magnitude of m and f l , given that f2 = 1,000 Hz and the dominant frequency [I = 900, 9t0, 920 . . . 1100 Hz. The strategy is designed to simulate the PLL operation. Hence, fl and f2 represent the frequency components after upper-sideband (USB)-SSB modulation. The true values of the original EEG frequencies do not actually play a key role in the performance analysis because they can be modulated (frequency- shifted) by the carrier frequency. It is the frequency difference A f ( = f t f2) that determines the PLL performance. The vertical axis represents the PLL output, which is expressed as the amount of deviation from the quiescent frequency. As illustrated in Figure 4, the range of m ensuring desired performance increases with the decreasing &fl. In other words, the PLL is capable of identifying the domi- nant frequency from the composite signal with a small frequency deviation even if the secondary frequency component has a magnitude comparable to that of the dominant frequency. For I Af] = 10, the PLL can successfully track the frequency component with largest magnitude (outpm of PLL = + t 0 when f l = 1.0 t0 Hz) for m up to 0.9. Note that the PLL fails when [Afl > 50 (fl _> 1,050 Hz or f l < 950 Hz) because the bandwidth of the loop filter is 50 Hz. The PLL performance out of the operating range is illustrated by a group of five pairs of curves rapidly converging to zero at small m (dotted curves in Figure 4).
To demonstrate how the PLL tracks the dominant frequency, Figure 5 dis.- plays the result for tracking a simulated time-varying, two-component signal,
A sin(2reflt) + B sin(2zrf2t), where the parameters (A, f l , B, f2) vary every second as follows:
(1.0, 15 Hz, 0.7, 1t Hz) -+ (1.0, t0 Hz, 0.8, 11Hz) --+ (1.0, 6 Hz, 0.8, 1~ Hz) (0.5, 6 Hz, 0.8, 11 Hz) --> (1.0, 3 Hz, 0.7, 9 Hz).
The carrier frequency O)c used to generate the USB-SSB signal is COc = 2zr 5,000 rad/s, the same as the quiescent frequency of the VCO. In spite of the periodic sharp negative peaks, the PLL output tracks the dominant frequency well As addressed in Section 2, a periodic pulse train is embedded in the PLL output when tracking a signal composed of two frequencies (Figure 3). The effect can be further improved by applying a lowpass filter (generally, a moving averager). Note that, at t = 3 s, the amplitude of the first component ( f l = 6 Hz) is reduced by one-half, which makes the PLL track f2 ( = 11 Hz) because A < B and f2 becomes dominant.
APPLICABILITY OF P L L TO TRACKING E E G RHYTHM 179 v(t) 5O 40 30 20 10 0 -10 -20 -30 -40 -50 . .. A f=40 ;;
/'!
,~I--30 IAA
~7--~0 ~ i [~i ~ /\
Illll - " - X
.
'-.' v " \ A ~,
~e2o
YV~ \
~ , 1 0 0 ".-.~ i i i v ~ , , . ' t ... ".. o ~ i i ,V= ~o ~ ~ . - ~ r ... ] ... . i ... : / -Ar~""-
_~::: ... =-:.o ...
~...i
~'.r;-~~
/
IV
9II./L_J
Af=-40 ] V1
.J . . . . I . . . . I . . . . I . . . . I . . . . I . . . . I . . . . I . . . . I , , , I . . . . 0 0.1 0.2 0,3 0.4 0.5 0.6 0.7 0.8 0.9 1.0 mFigure 4. Dependence of the PLL performance on the magnitude ratio m and the dominant frequency fl (the secondary frequency f2 = 1,000 Hz). Consider the dominant frequency fl = 900, 910, 920 . . . 1, 100 Hz. The vertical axis represents the PLL output, expressed as the amount of deviation from the quiescent frequency.
4. Design and implementation of the PLL system
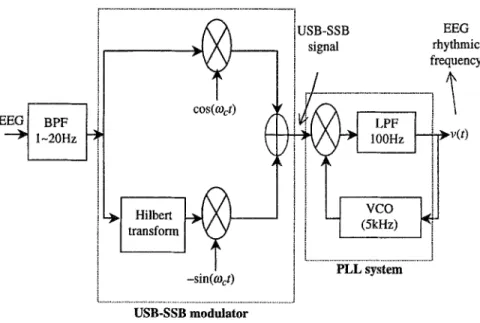
This study investigates the applicability o f the P L L to E E G dominant frequency tracking. Therefore, the entire system is implemented by software simulation on a Pentium 66. As addressed in Section 1, the P L L cannot properly operate in the low-frequency environment because at lower frequencies the lowpass filter in the phase detector (Figure 1) cannot successfully remove the double-frequency com- ponent in (2.6). Hence, a high-frequency carrier is used to translate the E E G spec- trum from its fundamental frequency band to a higher frequency band. Note that the amplitude modulation scheme translating the fundamental band of the E E G spectrum to a high-frequency band causes doubling of the bandwidth because the negative half-frequency band in the original E E G spectrum is translated to the positive frequency axis. To avoid interference from the doubling o f the frequency spectrum, the USB-SSB modulation scheme is employed. To generate the USB- SSB signals, the phase-shift method based on a Hilbert transform is applied [22]. The overall system is diagrammed in Figure 6. The carrier frequency COc used to generate the USB-SSB signal is the quiescent frequency of the VCO, where COc = 2Jr 9 5 , 0 0 0 rad/s. The loop gain is 100. The E E G signal is preprocessed
180 Lo AND LEE 20 1 5 - - w a 1 0 - - J IJ t! ~, t I I 1 I i I I m 5 - - - ~J d I~ !J I11 0 1 2 3 4 5 t (seconds)
Figure 5. The result for tracking a simulated time-varying, two-component signal: A sin(2Jrfv ) + B sin(2zrf2t), where the parameters (A, f l , B, f2) vary every second.
by a ban@ass filter with passband 1-20 Hz to remove the dc and high-frequency components which substantially affect the PLL performance. We design a finite impulse response FIR filter (length = 101) to realize the process of the Hilbert transform, by assuming the ideal frequency response:
- j , w > O (4.1)
H ( j w ) = j, o 9 < 0 .
The loop filter of the PLL is a lowpass filter with a bandwidth of 100 Hz. Its output represents the information of instantaneous dominant frequency being detected in EEG.
5. A p p l i c a t i o n o f P L L to S S B - m o d u l a t e d E E G
According to the simulation and analysis performed in Section 3, A f and m are the determinant factors in the applicability of the PLL system to EEG frequency tracking. Thus the authors first analyze the possible range of A f and m in the EEG. By analyzing the Fourier spectra of 4,000 EEG segments of 2-s duration, the average of A f is 4.1 Hz with a deviation of 3.7 Hz. The average o f m is 0.83
APPLICABILITY OF PLL TO TRACKING EEG RHYTHM t81 ... i 9[ Hilbert transform cos(%t) i -sin(ogct) i USB-SSB EEG ! signal rhythmic frequency ... !
vc--T
i i (5kHz) ~ ' ~ i1 I -2 ... J PLL system l t ... J USB-SSB modulatorFigure 6. Block diagram of the entire system: the USB-SSB modulator and PLL system.
with a deviation of 0.13. As illustrated in Figure 4, the capability of the PLL to detect the dominant frequency fl increases with decreasing I Afl. Considering the case of IAfl = 10 Hz, for example, the PLL can successfully detect the dominant frequency for the magnitude ratio m up to 0.9. The preceding analysis shows that the spectral feature ( A f and m) of the EEG fails within the acceptable range of performance. As a consequence, the PLL is feasible for tracking the dominant frequency of EEGs.
Figure 7 displays the result of analyzing a 30-s EEG sequence recorded from channel Pz, using the linked MS1-MS2 (mastoid electrodes [17]) as the common reference site. The 30-s tracing is divided into three segments of 10 s each. The EEG was recorded from a normal subject during restful alert states with eyes closed. The PLL output may provide a practical tool for online interpretation as the EEG rhythmic patterns are useful for studying the states of consciousness. During the 30-s period being analyzed, the subject was totally relaxed without any movement. One might expect a large portion of EEG patterns falling within the al- pha band. Interactions between cortical networks are known to be highly dynamic. A conventional method like the STFT, which analyzes the rhythmic activity based on an epoch of the EEG, results in information with a poor time resolution. The PLL employed as a frequency-tracking system provides an approach for tracking the instantaneous dominant frequency, potentially, on a real-time scale. Although mixed rhythms often occur in EEG, the PLL is capable of tracking the dominant rhythmic activity.
182 Lo AND LEE Hz 30 . PLL output ,, ,STFT
__lq
I
-U-
I
i
T
EEG . . . . - PLL output 0 1 2 3 4 m 5 6 7 8 9 10 time (second)Figure 7. Result of tracking the dominant frequency of a 30-s EEG (at Pz) with alpha dominating. For each 10-s segment, the PLL output and the maximum-peak frequency in the STFT spectrum are plotted right below the EEG. The quantized-form sequence shows the result derived from further quantization of the PLL output according to the four EEG rhythmic bands.
signal. Note that the result was obtained by first filtering the raw PLL output and then removing the spurious sharp peaks. The spurious sharp peaks with large am- plitude emerging intermittently in the raw P L L output are caused by the drifting of the carrier frequency in the modulated signal when the magnitude o f its envelope significantly decreases. The frequency drifting results in a multifrequency pattern feeding into the PLL, which is the phenomenon discussed in Section 2 (Figure 3). The post-processed curve indeed reflects the dominant frequency varying wiLh time. For a comparison, the dashed curve plots the frequency o f the maximum
APPLICABILITY OF P L L TO TRACKING E E G RHYTHM ] 83 ~ ~l Fz " Oz Hz 30 0 . . . PLL output
~__ ~ ~ - , ~ ~ . ~ _ ~ 2 ~ . . - ~ ~
f f I I I I I I I I : |" i -.~:~.~ ... _'...:_..!2'.. .. ,. ... ~ L ... _7.?. ... Z.'.._..L!'., ... Z ... PLL output 0 1 2 3 4 5 6 7 8 9 10 time (second) Figure 8.spectral peak obtained from the STFT analysis. The running measurement of STb-T spectra utilized a window size of 0.5 s, shifting at a 0.1-s pace. Undoubt- edly, the window size restricts the ability to characterize the local, subtle changes of frequency in the EEG. As a whole, both curves are coherent.
The PLL output was further quantized using four discrete levels, 0, 1, 2, and 3, denoting, respectively, the delta, theta, alpha, and beta bands. The quantized result plotted below the PLL output (Figure 7) is mostly in agreement with the naked- eye interpretation, It shows that primarily alpha activities dominate because the
184 Lo AND LEE Hz 30 : EEG Oz P . ... 9 .__,._.,~,.-,:..'=-_.,~.(.~...~L..._.~....~.J.:- ,_., - t_~-.,~...~.- ,,-_,-~._,--...EZ~--- - PLL output ~ ~ k _ _ ~ I--l_J] . r q _ Y q _ _ _ _ _ _ J I U ~ - - : EEG . PLL output ~ ~ e ~ ~ I 0 t 2 3 4 5 6 7 8 9 10 time (second)
Figure 8. Result of tracking the dominant frequency of a 20-s, two-channel EEG (Fz and Oz) with slow waves dominating. The EEG was recorded from an experienced meditator under deep meditation.
quantized value mostly stays at level 2. The modulating effect on the alpha rhythm causes an up-and-down motion of the quantized level. Thus, the proposed method is capable o f detecting variation of the alpha amplitude or occurrence of other rhythmic patterns.
Figure 8 plots another example, in which the EEG study was performed for a healthy, normal adult practicing Zen Buddhism meditation. The subject, a 34- year-old man, has practiced Zen Buddhism meditation for more than eight years. Two channels (Fz and Oz) o f 40-s duration each were analyzed. The linked MS 1-
APPLICABILITY OF PLL TO TRACKING EEG RHYTHM 185 MS2 was used as the common reference in the unipolar recording montage. EEG patterns in experienced meditators have been shown to exhibit long trains of theta activity [11]. In this paper, the authors do not aim to discuss aspects of the meditation EEG. The EEG pattern during deep meditation in our study, however, reveals both beta and delta activities in addition to the dominating theta burst. The quantized results mostly stay at level 1 (theta band) and level 0 (delta band), which indicates that the slow wave with high amplitude dominates. Note that the quantized value moves up to level 3 occasionally, reflecting the occurrence of the beta-band rhythm in the EEG.
6. Conclusions
In this paper, we investigated the feasibility of applying the PLL to EEG frequency tracking. The proposed technique is not meant to replace widely used methods for spectral analysis but instead provides an alternative approach that can be realized by hardware. The PLL is particularly good at tracking the variation in a dominant frequency. Nevertheless, its performance is highly dependent on the spectral characteristics when applied to a multicomponent, low-frequency signal. The problem of low frequency can be easily resolved by using the SSB modula- tion scheme to translate the EEG spectrum to a higher-frequency band. The effect of a multifrequency input on the PLL performance was investigated by using a signal model with two major frequency components. Our analysis shows that the performance of the PLL is quite acceptable in the range of the EEG spectral feature. The quantized process further makes the system capable of screening the EEG according to the four fundamental frequency bands. In addition, this technique may provide an education- and reference-based tool for EEG analysis and understanding. A future prospect is to realize the system by hardware, which enables online analysis during the EEG recording and data acquisition.
References
[1] J. T. Allen and L. R. Rabiner, A unified approach to short-time Fourier analysis and synthesis,
Proc. IEEE, 65, 1558-1564, 1977.
[2] C. Andrew and G. Pfurtscheller, Event-related coherence as a tool for studying dynamic interac- tion of brain regions, Electroenceph. Clin. NeurophysioL, 98, 144-148, 1996.
[3] M. Arnold, W. H. R. Miltner, H. WiRe, R. Bauer, and C. Braun, Adaptive AR modeling of nonstationary time series by means of Kalman filtering, IEEE Trans. Biomed. Eng., 45 (5), 553-- 562, 1998.
[4] R. Broughton, A phase locked loop device for automatic detection of sleep spindles and stage 2,
Electroenceph. Clin. Neurophysiol, 44 (5), 677-680, 1978.
[5] D. Burger, Analysis of electrophysiological signals: A comparative study of two algorithms,
186 L o AND LEE
[6] R. Cooper, J. W. Osselton, and J. C. Shaw, EEG Technology, 3rd ed., Butterworth. Woburn, MA, 1980.
[7] M. S. E1-Hennawey, High resolution frequency tracking system using the maximum entropy method, lnternat. J. Electron., 77 (2), t39--147, 1994.
[8] P.J. Franaszczuk, K. J. Blinowska, and M. Kowalczk, The application of parametric multiehannet spectral estimates in the study of electrical brain activity, BioL Cybern., 51,239-247, 1985. [9] E M. Gardner, Phaselock Techniques, Wiley, New York, 1979
[10] V. Goel, A. M. Brambrink, A. Baykal, R. C. Koehler, D. E Hanley, and N. Vo Thakor, Dorodnaat frequency analysis of EEG reveals brain's response during injury and recovery, IEEE Trans.
Biomed Eng.,43 (I1), 1083-1092, 1996.
[11] R. Hebert and D. Lehmann, Theta bursts: An EEG pattern in normal subjects practicing the transcendental meditation technique, Electroenceph. Clin. NeurophysioL, 42, 397-405, 1977. [12] R. Hoffmann and D. Jeakins, Computer quantification of delta activity in sleep EEG~ Comp.
Biomed. Res., 20, 366-372. 1987.
[13] G. Hsieh and J. C. Hung, Phase-locked loop techniques A survey, 1EEE Trans. tndust Elec-
tron., 43 (6), 609-615, Dec. 1996
[14] M.W. Johns, E. B. Stear. and J. Hanley, Tracking the dominant frequency of the EEG by phase- locked loop demodulation, Electroenceph. Clin. Neurophysiol., 37, 414-416, 1974.
[15] T.-P. Jung, S. Makeig, M. Stensmo, and T. J. Sejnowsld, Estimating alertness from the EEG power spectrum, IEEE Trans. Biomed. Eng., 44 (1), 60-69. 1997.
[16] T. Kalayci and O. Ozdamar, Wavelet preprocessing for automated neural network detection of EEG spikes, IEEE Eng. Med., BioL Mag., 14, 160-166, 1995.
[17] E Matsuo, Expanded head surface EEG electrode array: An application to display the voltage topography of focal epileptiform discharges of mesiotemporal origin, J. Clin. NeurophysiaL, 8 (4), 442-451, [991.
[18] T. Nakagawa and T. Tsukahara, A low phase noise C-band frequency synthesizer using a new fractional-N PLL with programmable fractionality, IEEE Trans. Microwave Theory Tech., 44 (2), 344-346, 1996.
[19] S.H. Park, J. C. Pfincipe, and J. R. Smith. TDAT--Time domain analysis tool for EEG analysis.
1EEE Trans. Biomed. Eng., 37, 803-811, 1990.
[20] M.E. Rizkalla, H. Gundrnm. and H. Michel, Design of a fractional phase-locked loop frequency synthesizer, lEE Proceedings-A, 138 (6), 295-299, 1991.
[21] D.L. Sherman, Y. C. Tsal, L. A. Rossell, M. A. Mirski, and N. V. Thakor, Spectral analysis of a thalamus-to-cortex seizure pathway, IEEE Trans. Biomed. Eng., 44 (8), 657-664, 1997. [22] E G. Stremler, Introduction to Communication Systems, 3rd ed., Chapter 5, 255-262, Addison-
Wesley, Reading, MA, 1990.
[23] W.J. Williams, H. P. Zaveri, and J. C. Sackellares, Time-frequency analysis of electrnphysiology signals in epilepsy, IEEEEng. Med., BioL Mag., 14, 123-143, 1995.