A QoS-Aware Transcoding Proxy Using
On-demand Data Broadcasting
Jiun-Long
Huangt , Ming-SyanChent and Hao-Ping
Hung* tDepartmentof Electrical Engineering
*Graduate Institute
of
Communication
Engineering
National
Taiwan University
Taipei,
Taiwan,ROC
E-mail:
[email protected],
[email protected],
[email protected]
Absrract-The high diversity in the capabilities of vurious mobile de-vices such as display capabilities and computation power makes the design of niobile information systems more
challenging. A transcoding proxy is placed between a client and an information server to coordinate the mismatch be-tween what the server provides and what the client prefers. However, most research works in transcoding proxies in niobile conipating environments are under the traditional client-server architecture and do not employ the data broadcast technique which is has been deemed a promising technique to design a power conservation, high scalable and high hand-width utilization. In addition, the issue of QoS provision is also not addressed. In view of this, we design i n this paper a QaS-aware transcoding proxy by utilizing the on-demand hroadeasting technique. We first propose a QaS-aware transcoding proxy architecture, sbbreristed BS QTP, and model it as a queueing network. By analyzing the queueing network, several theoretical results are derived. We
then propose a version decision policy and a service admission control scheme to provide QOS in QTP. The derived results are used to guide the execution of the proposed version decision policy and service admission control scheme to achieve the given
QOS requirement. To measure the performance of QTP, several experiments are conduded. Experimental results show that the proposed scheme is more scalable than traditional client-server systems. In addition, the proposed scheme is able to effectively control the system load to attain the desired QoS.
I . INTRODUCTION
The advance in wireless communication enables users
to
ac-cess information systems anytime, anywhere. via various mobile devices such as notebooks, tablet
K s ,
personal dig- ital assistants (PDAs) and GPRS-enabled cellular phones. Service providersare
establishing a number of mobile services including weather forecasting. stock information dissemina- tion, location-dependent query, route guidance and so on. To provide such services, researchers have encountered and are endeavoring to overcome challenges in various research areas including mobile data management[4], wireless network infrastructure, location-dependent data management [191, per- vasive computing, andso
on.In a pervasive cornputin& environment 1141, due
to
the con- straints resulting from power-limited mobile devices and low- bandwidth wireless networks, designing a power conservation, high scalability and high bandwidth utilization mobile infor- mation system becomes an important research issue, and henceattracts a significant amount of research attention. In addition, the high diversity in the capabilities of various mobile devices such as display capabilities (e.g., screen size, color depth and supported data formats) and computation power makes the design of mobile information systems more challenging. This diversity also results in an increasing demand on the capability
of
conte.xt awareness [I I] for mobile information systems. Content adaptation, which is an important techniqueto
realize context awareness. emerges to remedy the problem resulting from the said diversity by offering the different mobile users suitable versions of the same object accord- ing to the capabilities
of
the mobile devices. the traffic of the networks and the users’ preferences [121. Transcodins. which transforms a data object from one version into another. is recognized as a promising tcchnique to realize contcnt adaptation [121. A proxy capable of transcoding (referred toas a
transcoding proxy) is placed betweena
client and an information server to coordinate the mismatch between whatthe server provides and what the client prefers. Since proxy- based approaches
are
transparent to the content providers and users, this kind of approaches is able to simplify the design ofservers
and clients, and asa
result, attracts much research attention, including cache replacement schemes 171181, system architectures [l0][151 and proxy collaboration [71.In recent years, data broadcast [21[31 has been employed as an important technique to design a power conservation, high scalability and high bandwidth utilization mobile information system. However, most research works in transcoding proxies in mobile computing environments are under the traditional client-server architecture and do not employ the data broadcast technique. Hence, the transcoding proxies are not scalable and the network bandwidth is not well utilized. In addition. most prior studies do not consider the issue of quality of service (abbreviated as QoS) which is crucial in a mobile computing environment.
In view of this, we design in this paper a scalable and QoS- aware transcoding proxy by utilizing the on-demand broad- casting technique. Explicitly, we f i s t propose a QnS-aware transcoding proxy architecture, abbreviated QTP, and model it as a queueing network with three queues. By analyzing the queueing network, several theoretical results are derived to formulate the average waiting time of each queue. We
.I, Mobile Information System
/ \
Pala0
n Rcqucst UP
. . .
PDA Tablet PC NotebwkFig. I . An 2xample on-demand broadcssting system
thcn devise scheme ODB-QoS to provide QoS in QTP where ODB-QoS stands
for
“On-demand Data Broadcasting withQoS”. Scheme ODB-QoS is an online. iterative and adaptive algorithm comprising
1) a version decision policy to determine the suitable version for each data request according to the users’ device profiles and the network state, and
2) a service admission control scheme to determine whether
to
grant a service registrationor a
service handoff according to the network state.In each iteration, scheme ODB-QoS evaluates the average waiting time of each queue according to the derived results, determines the state of each queue according to the corre- sponding obtained average waiting time, and configures the behavior of the version decision policy and the service admis- sion control scheme according to the states of these queues to attain the desired QoS. To measure the performance of QTP, several experiments are conducted. Experimental results show that the proposed approach is more scahhle than traditional client-server systems. In addition, the proposed system is able to achieve the system administrators’
QoS
requirements by the devised version decision policy and the service admission control scheme. To the best of our knowledge, there is no prior research on the design of transcoding proxies employing data broadcast. This feature distinguishes this paper from others.The
restof
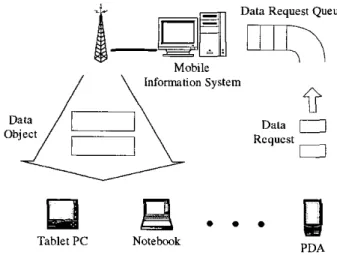
this paper is organized as follows. The de- scription of on-demand data broadcasting and the proposed transcoding proxy architecture, QTP, are given in Section 11. An analytical model and a transcoding model are devised in Section TIL Section IV describes the proposed scheme, and the performance evaluation is shown in Section V. Finally, Section VI concludes this paper.the employed scheduling algorithm. When requiring one data item, a mobile client sends a data request to the server. After receiving a data request, the server first checks whether there exists another data request
in
the data request queue with the same required data object.If
yes, the new-coming data request is merged into the existing data request. This phenomenon is called request merge. Data requests with the same requested data object can be safely merged since one transmission of the data object in a broadcast chanuel is able to satisfy all merged data requests. Therefore. the higher the occurrence probability of request merge is, the more efficient the system is. Otherwise, the new-coming data request is inserted into the data request queue.A scheduling algorithm is used to prioritize all data requests in the data request queue, and the server will serve these data requests according to their priorities.
To
servea
data request, the system retrieves the required data object from the corresponding data server, and then broadcasts this object to all its clients via a dedicated and shared broadcast channel. Asa
result, the on-demand broadcast system is more scalable andcan obtain higher network utilization than traditional client- server architecture.
B. System Archireclrue
Figure 2 shows the proposed architecture of QTP. In
a
cellular network architecture. the whole service area of
a
mobile environment is dividedinto
a
number of cclls. Two dedicated channels, a control channcl and a broadcast channel, arc provided in each cell. A conuol channcl is used to transmit control messages such as registration messages, data requests. acknowledgements, andso on.
On the other hand.a
broadcast channel is used by the transcoding proxy to disseminate data objects to i o clients. In according to the locations of these components, QTP comprises the following two types of components: front-end and back-end.A frontend which comprises a service manager and
a
scheduler is allocated to each cell. These two components are described below.
Sewice
Manager:
A service manager is in charge of all service-related operations suchas
service registration, service termination, service admission control andso
on. Each servicemanager owns a
profile database storing the profilesof
users
using the
service
and
the profilesof
these users’ devices. Several standards such as CUPP (standsfor
Composite CapabilitiesPreferences Profile) 1171 and UAProf (stands for User Agent Profile)[lX]
have been proposed to describe the capabilities of devices and users’ preferences..
Scheduler: A scheduler is a software component which handles the data requestsof
its corresponding cell. After receiving a user’s data request, the scheduler will first determine a suitable version for this data reauest accord- ing to the user’s device profile and the network state. Then. the scheduler will check whether the received data request can be merged into an existing data request in the data request queue. Different from the traditionalon-
demand broadcasting architecture showing in Section
II-
A. request merge occurs only when there exists another
11. PRELIMINARIES A. On-demand Data Broadcasting
Figure 1 shows
an
example on-demand broadcasting system. Inan
on-demand data broadcasting system, a server maintains a data request queue and serves these requests according toBack End
Service Area Fig. 2. The wchitccture of QTP
data request in the data request queue asking for the same version
of
the same required data object of the received data request. Otherwise. the scheduler will insert the received data request into the data request queue. In addition, a scheduling algorithm is employedto
deter- mine the service orderof
these data requests in the data request queue. While serving a data request. the scheduler will send this request to the cache manager and the cache manager .will respond with the content of the required data object: The scheduler then brWddcaStS the returned data object via the downlink channel, then serves the next data request in the data request queue.A back-end which comprises a cache manager and a
.
Cache Manager: After receiving a data request from a scheduler, the cache manager is responsiblefor
returning the required version of the required data object to the scheduler.Suppose
that the cache manager receivesa
data request of the j-th version of data object D ( i ) . If the j - t h version of Di is cached, the cache manager will return thecached data object to the scheduler immediately. If the j-th version of
D,
is not cached. the cache manager will check whether there exists another version-ofD i
which can be transcoded into the j-th version ofDi.
If yes, the cache manager will ask the transcoder to generate the j-th version ofD,.
Otherwise, the cache manager will request the original version of the requested data object from the data server, ask the transcoder to transform the returned data object into the required version, and then respond with the transcoded data object to the scheduler. Transcoder: A transcoder is in charge of the transforma- tionof
data objects among different versions according to the transformation requests of the cache manager. Since the design of the back-end is similarto
the systems proposed in some prior works [7][81[10][15], we focus in this paperon
the design of the front-end to provide scalable and transcoder &haves like a traditional transcoding proxy.QoS-aware transcoding proxy services. C. Signalling Procedures
Before using the transcoding proxy_ a mobile user should register the service in advance by sending a registration message via a control channel. After the transcoding proxy receives the registration message, a service admission control scheme is activated to determine whether to grant the service registration. If yes. the mobile device will send the device profile
to
the proxy, and the proxy will record the user profile and device profile in its profile database. Otherwise, the service registration is blocked. The rate that a service registration is blocked is called the service blocking rate (abbreviated asSBR).
After the service registration is granted. the mobilc user can issue data requests to the corresponding transcoding proxy by the control channel. When receiving a data rcqucst. the transcoding proxy first determines the suitable version
of
the requested data object by a version decision policy, and returns an acknowledgement message containing the decided version information via the control channel to the mobile user. Then, the transcoding proxy will return the decided version of the required data object via the corresponding broadcat channel assoon
as possible. After receiving the acknowledgement message. the mobile device will tune to the broadcast channel to wait for the appearance of the decided version of the requested data object. When the mobile user decides not to use the transcoding proxy service. the mobile device will senda
de-registration message to terminate the service.Since
a
mobile user is able to freely move around these cells. a service handoff will occur. A service admission control scheme is executed to determine whether the service handoff is granted. If yes, the mobile user can use the service as usual. If not, the system will force mobile user to terminate the service (we say that the call is dropped). Since a service admission control scheme is employed, a service handoff may be rejected.1
SymbolI
DescriptionI
TABLE I DESCRIPTION O F SYMBOLS Queue 2",,,
I l l
Dafa +r RequestThe rate that a service handoff is forced to terminate is called
the service dropping rate (abbreviated as SDRj. Fig. 3. lhe analpical model of ihe proposed transmding proxy
111. ANALYTICAL AND TRANSCODING MODELS We also let
Bct,r.
be the bandwidth of the control channel, and let the waitin:! time of the control channel fora
data request A. Analvtical Model(denoted
as
iVct7t.) he the time interval between the user sending a data request and the user receiving the acknowledge. Then, we have the following lemma.In this subsection, we derive the worst
case of
the average access time of QTP. and use the derived results to guide the version decision policy and the server admission control scheme proposed in Section IV.'To
facilitate the following discussion, we make the following assumptions.1) The employed scheduling scheme of the scheduler is FCFS (standing for first come, first serve).
2) No request merge occurs in the data request queue of the scheduler.
3) One transmission of a data object in the broadcast channel is received by exactly one client.
4) The messages of registration, de-registration and handoff are negligible.
Assumptions 2 and 3
occur
when theusers'
interests are highly diverse, and hence the effect of ondemand broadcast is eliminated. We make these two assumptions since we focus on the worst case of the transcoding proxy. Assumption 4 is made since we focus on the the situation that the number of data requests is much higher than the number of control messages (i.e., registration, de-registration, handoff and service termi- nation).These
assumptions will he relaxed in our simulation model described in Section V.For
better readability,a
listof
used symbols is shown in Table I.
We model QTP as a queueing network as shown in Figure 3. Queue 2 is a physical queue which is located in the scheduler. On the contraty, Queue 1 and Queue 3 are logical queues which are only used to model the conUol and broadcast channels in order
to
derive the average waiting time of a data request on the control and broadcast channels, respectively. Suppose that the data requests submitted by a mobile useri
in service follow a Poisson process with rate X i , and NU,,, is the number of mobile users in service in the cell. To facilitatethe
following discussion, we number the mobile users in the cell as user 1, 2,. .
., Nu,,,. Due to the characteristic of the Poisson process, the aggregate data requests of all mobile users in the cell follow a Poisson process with rateX c t r L . =
Cz;c7
A,. Denote the sizes of data requests and request acknowledgementsas
s c t r ~ . and SA^^. , respectively.Lemma 1: The average waiting time of the control channel can he formulated as below.
1 WCt,f. = B p
3ccpt.G*&
- XctdLet the waiting time of the scheduler for a data request (denoted as W s e h e . ) he the time interval from the arrival of the data request from the scheduler's perspective to the time b a t the requested daw object has been obtained by the scheduler. Note that the service
time
of a cachemanager
is affected by several factors such as cached status of required data objects. the employed replacement scheme, the characteristic of the input jobs, andso
on. The service time of the cache manager cannot be modeled by a particular mathematical distribution. Therefore, we model the average service time of the cache manager as an arbitrary distribution with mean&
and variance a:che,. Suppose that psche. =e
is the load of the scheduler. We then have the followinglemma.
Lemma 2: The average waiting time of the scheduler is
Let the waiting time of the broadcast channel for a data request he the time interval between the time that the requested data object has been obtained by the scheduler and the time that the user has received it. Then, we have the Coollowing lemma.
Lemma 3: The average waiting time ofthe broadcast channel
can
he formulatedas
Fig. 4. Example device prufilrs
where r g is the root
of
the following equation with value larger thanzero
and 'less than one.Finally, the average waiting time
of
the whole system (denotedas
I'VsYs.) is equal to the summationof
the average waiting time of the control channel,.the scheduler and thebroadcast channel. 'Then, with Lemmas ( I ) , (2) and (3), i'~sy,. can be formulated
as
WSps. ~= WCtd f I'vSche.
+
I'vBCaat (1)B.
Transcoding
ModelSuppose that the mobile devices are classified into several categories based on ttie their capabilities. and fie capabilities of each category are described by one device profile. Let
P,
be the i-th device profile. Without loss of generality, we order the device profiles according to their capabilities in ascendent order. That is, the capability of
P;
is better than that ofPi
when i>
j .
We also
letD , ( j )
be the j-lh versionof
data object Di. Again, we order all versions of a data object according to their quality in ascendent order..which means that the quality of D , ( j ) is better than .that
of
U ; ( k ) whenj
>
k.
For each data objects, we assume that the data sizeof
a version with higher quality is larger than thatof
another version with lower quality.To facilitate the following discussion. the concept
of
view- able version setis
defined below.Definition 1: A viewable version set of
a
device profile P;and
a
data object Dj (denotedas
V V S ( i , j ) )
isa
set of
versions of
D,
which are able to he displayed by mobile devices with profilePi.
Then.
we have the followingexample.
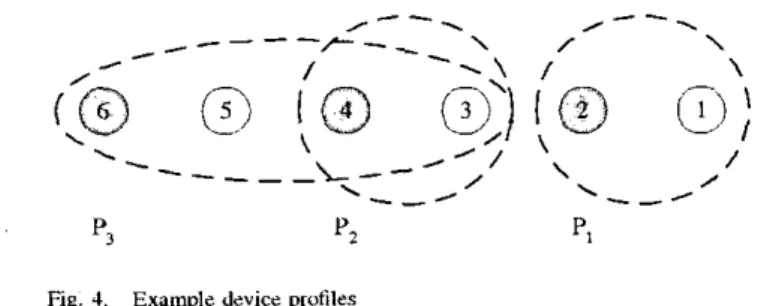
Example 1: Consider the example shown in Figure 4. Mobile devices
are
classified into three categories: notebook, PDA and smart phone, and their capabilities are described in device profiles P3. Pz and PI, respectively. In addition. there are six versions of data objectDj.
V V S ( S , j ) ,
V V S ( ? : j )
and V V S ( l > j ) are { 3 > 4: 5 , 6 } , ( 3 : 4) and {l,?}, respectively. We have V V S ( ? , j )c
V V S ( 3 , j ) since devices with profile P3(e.g., notebooks) are capable
of
displaying all versionsof
Di
viewable by devices with profilePz
(e.g., PDAs). On the other hand. we have V V S ( S l j ) n V V S ( l , j ) = @ and V V S ( 2 , j ) n V V S ( l , j ) =6
since devices with profile PI (e.g., smart phone) employ special data formats (e.g.. WML0-7803-8355-9/04/S20.00 O mIEEE. 2054
and WBMP) that are not supported b y devices with profile Pz
Let the function
B E S T ( i , j )
=L
(respectively.WORST(1';j) =
k )
represent that the best (respectively, worst) viewed versionof
data objectDi
fora
mobile de- vice with device profile P; is versionk.
In
practice, we haveB E S T ( i , j ) 2 B E S T ( l , j )
and I . V O R S T ( i : j )2
WORST(1,j) when i>
1. We also haveB E S T ( i , j )
=max{VVS(i,j)} and W O R S T ( i , j ) = inin {VVS('i,j)}. and P3.
Example
2:
Consider the example shown in Figure 4. The best viewable versions ofP3, PA
and PI are D3 (6), Dj(4) andD j ( 2 ) ,
respectively. Asa
result, we haveH E S T ( 3 , j )
= 6.B E S T ( 2 , j )
= 4 and B E S T ( 1 , j ) =2.
In addition, we also have W O R S I ' ( 3 , j ) = 3, W O R S T ( 2 , j ) = 3 and Whena
user registers the service. the user's mobile device will transmit the identifications the user and the corresponding device profile to the system. Suppose that the device profile of the mobile device is Pi. Then, when the mobile user requestsDj,
the system will return a suitable version ofDj,
say the k-th version ofLJj
wherek
EV V S ( i , j ) .
accordingto
the result of the underlying version decision policy.W O R S T ( 1 : j ) =
1.
IV. DESIGN OF SCHEME ODB-QOS
This section shows the design o i t h e proposed scheme ODB-
QoS (standing for On-demand Data Broadcasting with QoS).
An overview
of
scheme ODB-QoS is given in Section IV-A. The determinationof
the system state is given in Section IV- B. Finally, the proposed version decision policy and admission control schemeof
scheme ODB-QoS are described in Section Tv-C and IV-D, respectively.A. Overview
We take the average access time a s the QoS metric. Before executing scheme ODB-QoS, system administrators specify
a
QoS requirement by setting two thresholds
of
average access time, W , and I,Vz where W1<
IVz. l h e meanings of the two thresholds areas
follows. The usersare
guaranteed to receive the best viewable versions of requested data objects when the average waiting time is smaller than IV,. On the other hand, scheme ODB-QoS willuse
its best effort to prevent the average waiting time from being larger thanW z .
Scheme ODB-QoS is an online, iterative and adaptive algo- rithm which comprises
a
version decision policy and a service admission control scheme. The flowchart of scheme ODB-QoS
is shown in Figure5 .
Scheme ODB-QoS is executed periodically. and the following three steps are executed ineach iteration. First. scheme ODB-QoS meaSures the average waiting time
of
each queue according to the derived results in Section 111. Then, in state determination step. scheme ODB-QoS measures the load
of
each queue based on the obtained average waiting time, and determines the current stateof
each queue accordingly. Finally, scheme ODB-QoS configures the version decision policy and the service admission control scheme according to the state of each queue. The details
of
Next iteration Version Decision Policy
I I
Fig. 5 . The flowchart of scheme ODB-Qc.5
B. State Deterinination
Three positive factors, 71, 7 2 and 7 3 where y1+72 +y3 = 1, are also defined to determine the values of p?".. p . ' . .
p P h e . ? pBcnst and p f c 0 3 t , The values
of
p p l . andp?"'. are first determined
so
that the average waiting time ofthe control channel is equal to WC,,,. = 71 x WI and WC,,~. =
y1 x W 2 , respectively. The values of and
pphe-
are then determined so that the average waiting time of the cache is equal to y2 x W , and y2 x W2, respectively. Analogously, the values of pfcaSt and pfCast are determined so that the average waiting time of the cache is equal to 1 3 x W , and TA x W 2 : respectively.Ihe
values of 71, '(2 and 73are
determined adaptively and automatically. When the system starts up, yl, 7 2 and 7 3 are initialized to be I . In each execution, they are determined as1 - y,
-
7 2 . Note that in scheme ODB-QoS, only the QoS requirement (i.e., W , and W2) are required to be specified by system administrators.- -
d
W M,follows: 71 =
e.
YZ =e
and 7 3 =e
C. Version Decision Policy
Figure 6 shows the relationship between the average waiting time and the load
of
a queue. We can observe that when the the load is larger than or equal to one- the system is not stable since the average waiting time does not converge and will approachto
infinite. In addition, when the load is smaller than one, the average waiting time increases as the load increases. and the increment will increase drastically when the load approaches one.With the above observations, the rationale
of
OUT schedulingalgorithm is to keep the system loads of the schedirler (i.e., Queue 2
in
Figure 3 ) and broadcast channel (i.e., Queue 3in Figure 3) smaller than
one
at the cost of the quality ofrequested data objects. As a consequence, when the load of the scheduler or the broadcast channel is high. for each data request, the system will return the version of worse quality than the best viewed version. The strategy has the following two effects:
PI
System
Load (p)
Fig. 6. The relationship between load and average access time of a queue
Decrease the average waiting time of the broadcast channel (&) since the data size of a data object with lower quality is usually smaller than that of the
same
data object with higher quality. The load of the broadcast channel is hence reduced.Increase the occurrence probability of request merge. Consider the device profiles shown in Figure 4. and two data requests of
D j
for device profilesPZ
and PA,respectively. These,two data requests will not be merged when the load of the scheduler or the broadcast channel is light. However. when the load is high. the system will decide to return the third version
of Dj.
and hence, these two data requests can be merged. The arrival rates of the input processes of the cache and the broadcast channel them decrease. As a result. this strategy will reduce the load of the cache (psche.) and broadcast channel(PBCart).
Two thresholds, and (respectively, ,ofcadt and pFCaSt); are specified first and they divide the load of the scheduler (respectively, the broadcast channel) into three
states: LIGHT, FAIR and HEAVY. Figure 7 shows the state transition diagram
of
the scheduler. The state transition sce- nariosare
as
follows. When the previous stateis
LIGKI', the current state will transit to FAIR ifpsche.>
(1 + a ) x p P h e . .Otherwise, the current state will still be LIGHT. When the previous state is FAIR. the current state will transit to LIGHT the current state will transit to HEAVY. Otherwise, the current state will still he FAIR. When the previous state is HEAVY. the current state will transit to FAIR ifpSche.
<
( I - a ) xOtherwise, the current state will still be HEAVY. The factor a, where 0
<
n<
1, is set to avoid state oscillation. We assume that (1+
a ) x<
1 without lossof
generality. The State transition diagram and transition scenario the broadcast channel are as shown in Figure 7 by substituting pfcast and &CaSt for pSche. and respectively. The determinationof $ h e . ,
,$the.,
pfCnSt and pfcost are described in SectionN-B
.
otherwise otherwise otherwise
Fig. 1. Stale transition diagam
We also define the aggregated state
of
the scheduler and the broadcast channel as follows. The aggregated state is LIGHT when the loads of the scheduler and the broadcast channel are both LIGHT. The aggregated state is HEAVY when at least one loadof
the cache and broadcast channelis
HEAVY. Otherwise, the aggregated state is FAIR. For each new-coming data request. the scheduler will decide a suitable version, filla
version information into the data request according to the aggregated state, and insert it into the data request queue. The scheduler will also inform the mobile client of the decided version by replying an acknowledge message. Formally, the version decision policy is described below..
LIGHT:
The scheduler operates in the traditionalon-
demand broadcast mode when the aggregated state is
LIGHT. Hence, the system guarantees that each client will receive the best viewed versions of data objects being requested. That is, the system will return the B E S T ( i , J ) - t h version of 0, when a user requests D j
by a mobile device belonging to device profile
Pc.
.
FAIR In FAIR state, the qualityof
received data object may be degraded. Let degradation andmazDeyradation indicate the current and maximal degrees
of
degradation, respectively. The value of mazDegr.adr2tion is ohtained bymax ( B E S T ( k , j ) - W O R S T ( k , j ) } . When receiving
a
data request ofD3
from a mobile device belonging to device profile P,, the system will return the (BEST(z,j)-degradation)-th versionof
0 3 . When the current aggregated slate is FAIR, the previous aggregated state is also taken into consideration. When the previous aggregated stateis
LIGHT, degradationis set to be one. When the previous aggregated State is HEAVY. degradation, is set to be maxDegradation-1. Otherwise, when the previous aggregated state is
also
FAIR. the load of the scheduler is considered. The value
of
degrado.tion increases b y one whenp2;p-
> (li-0)
xp:,?Ge-,
Similarly, the value of d e g r o h t i o n decreases by one when p:.$<
( I -0 )
x Otherwise, the valueof
degrn.dation remains the same. The constant j 3 is used to avoid the oscillation of degradation..
HEAVY: When the aggregated state is HEAVY, the system willforce
each client to receive the worst viewed versions of data objects which it requests. That is, the system will returnthe
W O R S T ( i , j ) - t h versionof Dj
when
a
user requestsD j
b y a mobile device belonging to device profile P,.V P r , D ,
As a consequence. the algorithmic form of the version decision procedure is as below.
Procedure VersionDecision(P,.
D 3 )
Input: A user requests
D,
~ bya
mobile device belonging to device profile P,.Output: A version of
D 3 .
I: Let preState and curstate t be the previous/cment
2: Let
~ $ 2
andps;p.
t be the previouslcument loadof
3: maxDegradation
-
.L if (curState=LIGHT) then
5 : return
BEST(i,j)
/* The system will return the hest viewable version to the user */6: else if (curState=HEAVY) then
7: return WORST(I,j) I* The systcm will return the
worst viewable version
to the
user */ 8: else /* curStotr=FAIR *I9: if (preState=LIGHT) then I O degradation c 1
1 1 : else if (preState=HEAVY) then
12: 13: else /* preState=FAIR */ 1.1: 15: degradation
-
16: else if<
( 1 - j3) x~$2.)
then 17: 18: end if 19: endif 20: 21: end ifstate of the scheduler, respectively
the scheduler state of the scheduler, respectively maxyfi { B E S T ( k ; j ) - W O R S T ( k , j ) }
degradatidn. c maxDegradatioia - 1
if ( p 2 ; p
>
(1+
0)
x p:;?) thenmiu {degmdation
+
1, maxDegmdation}degradation t mnx {degradation - 1 , O )
return
BEST(i,
3 )
- degra,dationD.
Service Admission Conrrol SchemeA service admission control scheme is employed in each service manager to determine whether to grant a service registration or
a
service handoff by considering the number users in service, the network status. andso
on.
Analogously, the rationale of our service admission conuol scheme is io keep thesvstem
loadof
the control channel (i.e.. Queue Iin
Figirre 3 ) smaller than
one
at rhe costof
SBR and SDR. As shown in Section 111-A. the incoming rateof
data requests is in proportion to the numberof
users using the service in the cell. As a result. the service admission control scheme should keep the numberof
users in service undera
reasonable level. To achieve this, two thresholds, py"'l. and pftF1. wherepyT'.
i p p i .<
1. are specified fist and they divide the load of the control channel into three states: LIGHT. FAIR and HEAVY. Theslate
transition diagram and transition scenario of the service manager are shown in Figure 7 by substituting PIdetermination of pf"'l- and pf""
are
described in SectionIV-B.
Although the proposed version decision policy can reduce the loads of the scheduler and the broadcast channel. the effect
Cfrl. and ,,?til.
for
pSche. and p p h e - . respectively. Theof the proposed version decision policy is limited since it depends on several factors such as the locality
of
data requests. the cache size and so on. As a consequence, in addition to the load of the control channel, the service admission control scheme should also takes the loads of the scheduler and the hroadcast channels into consideration. Note that SBR is sacrificed first since mobile users can tolerate a service regisuation being blocked rather than a service handoff k i n g forced to terminate (i.e., dropped). The proposed admission control scheme isas
below..
A service handoff is dropped when the state of the control channel is HEAVY or when degradation =maxDegradation.
.
A service registration is blocked when the state of the control channel is FAIR or whenmaxDegradation
? degradation
2
The algorithmic form of the revised service admission control scheme is as below.
Procedure ServiceAdmission
Input: A service registration or
a
service handoff.Output: Decision of the incoming service registration or service handoff.
I: curState i current state of the control channel 2: if (the input is a service handoft] then
3: if (arState=HEAVY or 4: rcturn REJECT
5: eke
6: return GRANT
7: end if
8: else /* the input is a service registration */
9: if (curState=FAIR or
I O return RWECT
1 1 : else
IZ: return GRANT
13: end if 14: end if
degradation = mazDegradation) then
degradation
2=
mazDegradaCion)
thenV.
PERFORMANCE
EVALUATION
To evaluate the performance of the scheme ODB-QoS. we
build
an
event-driven simulator with SIM [SI. Scheme ODB- QoS is executed periodically with period two minutes and the simulation is run for 12 hours. Scheme CS (standing for traditional Client-Server) and scheme ODB (standing for On- Demand Broadcasting) are also implemented for comparison purposes. The average waiting time is employed as the perfor- mance measurement for cach scheme. In addition, SBR and SDR are takcn as the measurement of the cost of scheme ODE-QoS. The simulator is coded in C++ andrun
in aPC
with Pentium I11 400 MHz CPU and 256 MBytes RAM. A. Similalion Model
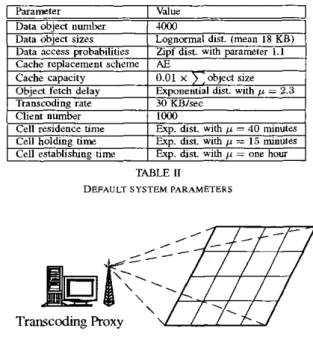
Similar to [16], we set the cell topology
as
a 4 x 4 cells wrapped-around mesh topology shown in Figure S. We takeI
TABLE 11
DEFAULT SYSTEM PARAMETERS
Fig. 8. The simulation lopology
LWF (standing for Longest Wait First) as the underlying scheduling algorithm. Scheme AE
[8]
is employed as the cache replacement policy since it outperforms the other replacement policies for transcoding proxies. Each cell providesone
control channel and one download channel with network bandwidth10 KByte/sec and 100 KByteIsec. respectively. Analogously to
[SI, we assume that there are 4000 data objects and the sizes follow
a
lognormal distribution with a mean of 15 KBytes. The size of a control message (e.g., data request message and acknowledgement message) is set to be I KByte. The access probability of data objects follows a Zipf distribution. which is widely adoptedas
a model for real Web traces [11[61. The parameter of the Zipf distributionis
set to be 1.1 with a reference to the analyses of real Web traces [61[131. Since small objects are much more frequently accessed than large ones [91, we assume that there is a negative correlation between the object size and its access prohability. The default capacityof
the cache isset to
be 0.01 x Cobject
size
and the fetch delays of data objects follow an exponential distribution with mean 2 seconds [SI. The values of iV1 and CV, (i.e., the QoS requirement) are set to be two seconds and five seconds, respectively.In the client model, as in [71 and [SI, we assume that the mobile clients can be classified into five device profiles, and
I
ProfileI
Viewable vasmn setI
8 . i . 6 . 5
TABLE 111
DEVICE PROFILES AND VIEWABLE VERSION SETS
the disuibution of these five device profiles of mobile clients is modeled as a device vector of (15%: 20%: 30%, 20%, 15%). Without loss
of
generality, we also assume that all objects could be Uansccded into ten versions, and the sizes of the ten versions (from version one to version ten) are assumed to be 10%. 20%. 30%,.
.
. and 100% of the original object sizes[SI.
The viewable version set for each device profile is shown in Table 111. Bya
reference to [8], we assume that a more detailed version can be manscoded into a less detailed one and the transcoding delay is determined a s the quotient of the ohject size to the transcoding rate. The transcodingrate
is set to he 30 KBytes/sec [71. The number of users in the network is set to be 1000. The cell residence time, service holding time and service establishing time for each user are set to be exponential distributions with means of 50 minutes, 10 minutes and one hour, respectively. We also assume that the data requests for each user iollow a Passion process with parameter
i
= 60.B. Ihe Effects of the Number of
Users
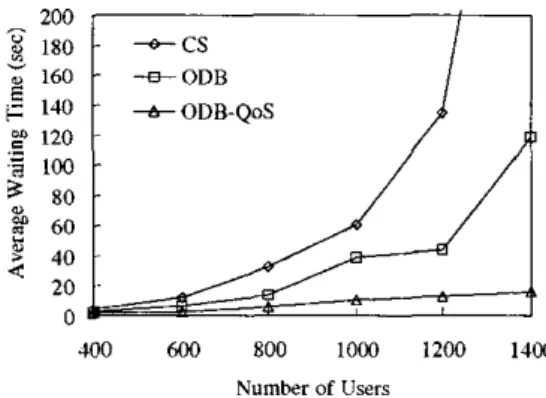
Figure 9 shows the experimental results with the number of users varied. The number of users is set from 400 to 1400. From Figure 9a. we observe that when the number of users
is small (400 in this experiment), the system load is light and
the average waiting times of all schemes are close. When the number of users increases, the average waiting time of scheme CS and scheme ODB also increases. In addition. the increment of the average waiting time of scheme CS and ODB increases as the number of users increases. especially when the number of users is larger than 1200. Since
a
large number of users implies the high arrival frequencies of data requests, the system load becomes heavy when the number of users is large, and hence, the average waiting time increases drastically. When the numberof
users is 1400, the average waiting time of scheme CS does not converge as the time advances since the system load is larger than one. This situation again agrees with thc observation in Section IV-C. The average waiting time reduction of scheme ODB over scheme CS increases from 47.11% to 74.2% as the number of users increases from 400 to 1400. Scheme ODBis
more scalablethan
scheme CS due to the effect of request merge and the employment of data broadcast.Next. consider scheme ODB-QoS. When the number of users is small (400 in this experiment), scheme ODB-QoS and scheme ODB have similar behavior. This can be explained by the reason that when the average waiting time
of
schemeODB-
QoS is smaller than W1. scheme ODB-QoS is degenerated to scheme ODB and guarantees that each userwill
receive the best viewable versions of the requested data objects. When the number of users increases to 1000, some service registrationsare
blocked since the average waiting time cannot be satisfied with the QoS requirements (i.e., in the interval (LVI, 1.v~)). Similarly, some service handoSfs are dropped when the number of users is larger than 1200. We observe that scheme ODB- QoS is able to keep the average waiting time satisfying the QoS requirement by conuolling the qualityof
received data objects and the number of users in service even when the offered system load is heavy.C. 77ie
Effects
of Skewness of Access ProbabilitiesWe investigate the effect of varied skewness of access prohahilities in average waiting time, SBR and SDR. The degree of skewness is measured by the value of the Zipf parameter which
is
set from 1to
1.4. The larger the Zipf parameter is, the higher the degree of skewness is. As shown in Figure loa, the average waiting time of all schemes increasesas
the value of Zipf parameters decreases. It is because that the degree of request locality is high when the access frequencies is highly skewed (i.e., high Zipf parameter). Therefore, with the same cache size, the cache hit ratio is high and is able to effectively reduce the average access time. Moreover. scheme ODB can further reduce the average waiting time since the probability of request merge increases. We also observe that the increment of thc average waiting time of scheme CS andODB incrcases drastically whcn thc value
of
Zipf paramctcr decreases (i.e., onc in this experiment). The rcason is that the effect of cache decreases as the dcgrce of skewness decreases. Hence, the system load becomes heavy when the degree of skewness is low, and therefore, the increment of average waiting time increases. This result conforms the observation in Section IV-C. The average waiting time reduction of scheme ODB over scheme CS ranges from 36.9%to
65%.Figure 10b shows the produced SBR and SDR of scheme ODB-QoS with the value of Zipf parameter varied. We ob- serve that when the skewness of access frequencies is high (Zipf parameter=1,4 in this experiment), scheme ODB-QoS
is degenerated to scheme ODB since the average waiting time of scheme ODB-QoS is smaller than [.VI. When the Zipf parameter is 1.2. some service registrations are blocked (SBR> 0) since the average waiting time without blocking service registration cannot be satisfied with the QoS require- ment. SBR is sacrificed first since mobile user can tolerate a service registration being blocked rather than a service handoif being forced lo be dropped. In addition. when Zipfparameter is smaller than 1.1. some service handoffs are also dropped since the system load is too heavy.
VI. CONCLUSION
We explored in this paper the effect of on-demand broad- casting technique in the design of
a
QoS-aware transcoding proxy, We first proposed a QoS-aware transcoding proxy architecture. QTP, and modeled it asa
queueing network. By analyzing the queueing network, several theoretical results were derived to formulate the system average waiting time. We then proposeda
version decision policy anda
service admission control scheme to provide QoS in QTP. The derived results were used to guide the execution of the proposed ver- sion decision policy and service admission control scheme to fulfill thc given QoS requirement. To measurc the performance of QTP. several experiments werc conducted. Experimental results show that thc proposed approach is more scalable than traditional client-server systems. In addition, the proposed approach can effectively achieve the desired QoS.ACKNOWLEDGEMENT
The authors are supported in part by the Ministry of Edu- cation Project No. 89-E -FA06-2-4, and the National Science
200 160 *ODB
i i
-
p
180 - c SI
E g 140 +ODB-QoS g 120.-
$
60$
4 0 20 0 400 600 800 IO00 I200 1400 Number of Users(a) Avenge Waiting Time
Fig. 9. The effecu of the number of users
180
-
r. + cs p 160*
ODB p 60 $ 402
20 0 1 1.1 1.2 1.3 1.4 Zmf Parameter(a) Avenge Waiting Time Fig. 10. ' I l l h e effecu of the Zip{ parameters
Council Project NO. NSC 92-2213-E-002-001 and NSC 92- 2213-E-002-010, Taiwan, Republic of China.
REFERENCES
[ I ] C. Agganval. I. 1. Wolf. and P. S. Yu. Caching on Ihe World Wide Web.
IEEE Trrmsacrims on Knowledge and Dofo Engulee?itrg, 1 1 ~ 1 ) : 9 ~ 1 0 7 ,
1 999
[Z] M. Agrawal. A. Manjhi. N. Bansal, and S. Srshan. Improving Web
Performance in Broadcast-Uniast Networks. In Pmceedings of the
IEEE INFOCOM Conference. March-Apil 2003.
[3] D. A b o y and M. 1. Franklin. Scheduling for Large-Scale On-Demand Data Broadcming. In Pmceedings of IEEE INFOCOM Conference.
pages 6 5 1 4 5 9 . March 1998.
I41 D. Barbara. Mobile Computing and Databases - A Survey. IEEE
Trmactionr on Knowledgead narabnse Engineetirrg. l l ~ l ~ : l O a l l 7 . Jnnuaryffebnrary 1999.
[SI D. Bolier and A. Elisns. STM a C++ lihrary far Discrete Event Simulation. h ~ : / / w w m c s . v u . n ~ e l i ~ ~ / ~ ~ , Octobr 1995. 161 L. Brcslsu. P Cao, G. Phillips. and S. Shenker. Web Caching and Zipf-
like Distributions: Evidence and lmplicauans. In Pmcredi,rgs of rhe
IEEE INFOCOM Conference, March 1999.
[7] V. Cardelliai P. S . Yu. and Y.-W. Huang. Collaborative Rony System for Distributed Web Cvntcnl Tramcoding. In Prmeeding oftlze a h .iCM
l n t e m m ' d Confemme on Informotion and Knowledge Mrmagemenf,
November 2000. 400 600 800 1000 1200 I400 Number of Users (b) S B W S D R 9 8 7 + SDR 6 E 5 $ 4 I 3 2 I 0 1 1.1 1.2 1.3 1.3 Zipf Parameter (b) SBR/SDR
[8] C.-Y. Chang and M . 3 Chen. ExploCng Aggregate Effect wilh Weighted
Transccding Graphs for Efficient Cache Replacement in Transmding Proxies. In Pmaedings of the 18th IEEE Irrtemtional Confererze on
Dafo Enginee-g, Feburary 2002.
[9] S. Glassman. A Caching Relay for the World Wide Web. Computer
Nehvorkr ond ISDN Systems. 27, 1994.
1101 R. Ha". P. Bhugwat. R. Lamaire, T. Mummen. V. Perret. and 1. Rubas. Dynamic Adaptation in an Image Tramcoding Roxy for Mobile Web
Browsing. IEEE Pcnonal Communicatimr, 5(6), December 1998.
[ I l l A. Hurter, A. Hopper, P Steggles, A. Ward, and P Wehacr. The Anatomy of a Context-Aware Application. In Proceedings of flz
.irh .ACM/IEEE InfemnfiDnnl Conference on Mobile Compuring and
Networking, pages 5 9 4 8 , August 1999.
1121 W. Y. Lum and F. C. M. La". A C o n t e x t - A ~ ~ e Decision Engine for Content Adaptation. 1EEE Pervasive Computing, l(3). July-September 2002.
I131 Y Padmanabhan and L. Qiu. The Content and Access Dynamics of a
Busy Web Site: Findings and Implications. In Proceedings of fhe IEEE
SIGCOMM Confennce. pages 293-30-1. August-September 2000. [I41 .W. Satysnarilyanan. Pervasive Computinp: Vision and Challenges. IEEE
Penono1 Comnmr~ications. 8(4):1&17. August 2001.
I151 J. R. Smth, R. Mohan. and C.-S. Li. Content-based Tramcoding on Images in the Internet. In Pmeedings of IEEE I n t e ~ i a r o l Confcreze WI 1 m g e Prmrssing. On&r 1998.
[I61 C.-C. Tseng, G.-C. Lee, R . ~ S . Liu, and T.-P. Wang. HMRSVP A
HierarcUcal Mobile RSVP Protocol. ACM Wimlesr Networks, 9(2):95-
102,
zw3.
I171 W3C. hnp:llwww.w3.org/Mobile/CCPP/. [I81 WAP Fomm. http://www.wapforum.og/.