HEALTH RISK ASSESSMENT ON RESIDENTS EXPOSED TO CHLORINATED HYDROCARBONS CONTAMINATED IN GROUNDWATER OF A HAZARDOUS WASTE SITE
Lukas Jyuhn-Hsiarn Lee, Chang-Chuan Chan, Chih-Wen Chung Institute of Occupational Medicine and Industrial Hygiene, College of Public Health, National Taiwan University, Taipei, Taiwan Yee-Chung Ma, Gan-Shuh Wang
Institute of Environmental Health, College of Public Health, National Taiwan University, Taipei, Taiwan
Jung-Der Wang
Institute of Occupational Medicine and Industrial Hygiene, College of Public Health, and Department of Internal Medicine, National Taiwan University Hospital, Taipei, Taiwan
We conducted this study to estimate residents’ chronic hazard and carcinogenic risk in a groundwater-contaminated community after on-site remediation in Taiwan during 1999– 2000. We followed guidelines for assessing hazardous waste sites of the U.S. Environ-mental Protection Agency (EPA) and used empirically measured contaminant levels and exposure parameters to perform health risk assessment on seven chlorinated hydrocar-bons. We measured groundwater concentrations of vinyl chloride, tetrachloroethylene, trichloroethylene, 1,1-dichloroethylene, 1,1,1-trichloroethane, cis-1,2-dichloroethylene, and 1,1-dichloroethane in 49 off-site residential wells by gas chromatography/ mass spec-trometry. Exposure parameters were mainly derived from our field survey of 382 residents, and partially from U.S. EPA default values. Total exposure dose estimation included routes of inhalation during showering and dermal absorption of showers and other activities involved with hand–water contacts. The ingestion route of water was not included because most residents drank boiled water with negligible contaminants. We calculated a hazard index (HI) for all seven chlorinated hydrocarbons and carcinogenic risks for known human carcinogen of vinyl chloride and probable human carcinogens of tetrachloroethyl-ene and trichloroethyltetrachloroethyl-ene, which had the same target organ, the liver. The HI values for reasonable maximal exposure (RME) and average exposure were 14.3 and 0.2, respec-tively. The cancer risks based on RME and average exposure (in parentheses) for vinyl chloride, tetrachloroethylene, and trichloroethylene were 8.4 × 10⁻⁶(7.3 × 10⁻⁹), 1.9 ×
10–4(1.3 × 10⁻⁷), and 1.4 × 10⁻⁴(1.2 × 10⁻⁶), respectively. We applied Monte Carlo
simu-lations to the sensitivity analysis, which showed that the contaminant levels, exposure duration, and time for showers were major determinants of health risks. We concluded that the contaminated groundwater was still unsafe for use even after the contaminated site underwent remediation by extraction and treatment in 1997.
219
Lukas J.-H. Lee was a recipient of an NHRI MD-PhD and DDS-PhD predoctoral fellowship (RE89M003). This study was supported in part by the Taoyuan Environmental Protection Bureau, Tai-wan (TYEPB-1999-3-RCA-1), and the National Science Council of the Executive Yuan, Republic of China (NSC90–2320–B–002–127–M56).
Address correspondence to Professor Jung-Der Wang, Institute of Occupational Medicine and Industrial Hygiene, National Taiwan University College of Public Health, No. 1, Section 1, Jen-Ai Road, Taipei, Taiwan 100. E-mail: jdwang@ha.mc.ntu.edu.tw
Uncontrolled hazardous waste sites have emerged as a major environ-mental and public health concern in many countries. The Taiwan Environ-mental Protection Administration (EPA) has identified more than 160 haz-ardous waste sites (Taiwan EPA, 1999). In 1994, a hazhaz-ardous waste site contaminated by a former factory involved in the manufacturing of elec-tronic appliances was found in Taoyuan City, Taiwan (designated as the R factory). The factory was built and in operation between 1970 and 1992. Previous site investigations revealed that on-site soils and groundwater in the factory were contaminated by about 12 different chlorinated hydro-carbons for more than 10 yr (Bechtel, 1995; Target, 1995). Eight of them were also found in the off-site groundwater of the downstream area, namely, 1,1-dichloroethane (1,1-DCA), 1,2-dichloroethane (1,2-DCA), 1,1-dichloro-ethylene (1,1-DCE), cis-1,2-dichloro1,1-dichloro-ethylene (cis-1,2-DCE), 1,1,1-trichloro-ethane (1,1,1-TCA), tetrachloroethylene (PCE), trichloroethylene (TCE), and vinyl chloride (VC) (ITRI, 1994; Geomatrix, 1995). The highest contaminant level in an off-site residential well was 4800 µg/L for PCE, which was adja-cent to the factory’s source area with soil conadja-centration up to 1100 mg/kg of PCE (Geomatrix, 1995; Bechtel, 1995). The Taiwan EPA declared the R fac-tory a hazardous waste site in 1994 and requested remediation action on the contaminated soils and groundwater within the factory during 1996–1998 (Taiwan EPA, 1994–1997).
An extraction and treatment system for restoring contaminated ground-water had been operated for 6 mo in 1997 and failed to meet the require-ments of World Health Organization (WHO) drinking-water guidelines (Geomatrix, 1998). There are about 10,000 residents currently living in the village downstream of the R factory. Many residents living in the vicinity of the factory relied mainly on locally extracted groundwater from residential wells as their primary source of domestic water supply until 1994. Some of them still continued to use these wells for showering, washing vegetables and dishes, or other cleaning activities, even though tap water was supplied. Concerned about these residents’ potential health risks from chronic expo-sures to the contaminated groundwater, we initiated a comprehensive study entitled “Epidemiological Study and Health Risk Assessment for Residents Living Near a Contaminated Site Polluted by Volatile Chlorinated Com-pounds” during 1999–2000. This study included measurements of well waters, toxicological studies with animal models, epidemiological investiga-tions, and health risk assessment for chlorinated hydrocarbons. We present here only part of the risk assessment. We demonstrate that a well-planned and carefully carried-out risk assessment can help evaluate potential health problems for a contaminated site and identify important exposure parame-ters for risk management.
METHODS
We conducted this site-specific risk assessment by following the detailed guidance for developing risk information at hazardous waste sites published
by the U.S. Environmental Protection Agency (U.S. EPA, 1989, 1998a), which included the following processes.
Hazard Identification of Contaminants in Groundwater
The hazard identification was mainly based on the considerations of contaminants’ toxicity, environmental persistence, and concentrations. Chlorinated hydrocarbons with the characteristics of more toxic, persistent, mobile, or higher concentrations were our top choices of target chemicals of concern. In addition, we also considered degradation products from the chemicals used in the R factory as our target pollutants because many conta-minants had been present for more than 10 yr (Bechtel, 1995). For example, PCE can lead to the production of seven chlorinated hydrocarbons, includ-ing TCE, cis/trans-1,2-DCE, 1,2-DCA, 1,1-DCE, 1,1-DCA, and VC. And 1,1,1-TCA can form 1,1-DCA, 1,1-DCE, and subsequently VC through anaerobic reductive dehalogenation (Sims et al., 1991). Although all of these chemicals can be determined by our analytical methods, described later, we only conducted quantitative risk assessment on the chemicals that exceeded the maximum contaminant levels (MCLs) of the U.S. EPA (1999). This prac-tice was in line with the U.S. EPA’s recommendations in the Risk Assessment Guidance for Superfund (RAGS) (U.S. EPA, 1989). Moreover, these chemi-cals’ toxicological endpoints and target organs were obtained by reviewing epidemiologic studies and animal bioassays on these chlorinated solvents from the literature, such as the TOMES database (Micromedex, 1998), the Agency for Toxic Substances and Disease Registry Toxicological Profiles (ATSDR, 2000), Medline databases, etc. In order to perform quantitative risk assessments on noncarcinogenic health effects, we reviewed systemic toxi-cities, including hepatotoxicity, nephrotoxicity, and central nervous system depression, which resulted from chronic exposure to these chlorinated sol-vents. For conducting quantitative carcinogenic risk assessment, we selected only chemicals classified by the International Agency for Research on Cancer (IARC) as Group 1 or 2A (IARC, 1995). We summarized carcino-genic risks across chemicals that affected the liver as their major target organ based on animal studies (U.S. EPA, 2001a; Rhomberg, 2000).
Exposure Assessment
Groundwater Sampling and Analysis We conducted groundwater sampling from off-site residential wells that were still in use for domestic purposes. According to the local groundwater hydrogeology, the off-site groundwater flow direction was generally toward the north and northeast in the first aquifer (Geomatrix, 1998). Residential wells in the nearby com-munities were identified by a door-to-door survey. The wells were located from about 50 m up to 1 km away from the factory. For the downstream wells to the north of the factory, we collected a total of 69 samples from 44 wells with 1 sample per well for 32 wells and 2 to 3 samples per well for the other 12 wells. For the upstream community, we collected two ground-water samples of ground-water from two wells to the south of the factory and
another three samples from three wells to the west of the factory. In total, we had 74 groundwater samples to describe environmental concentra-tions of chlorinated hydrocarbons surrounding the hazardous site.
We followed the standard procedures of sampling groundwater. In brief, water in the wells was drawn directly from the wells with a bailer and then stored in 30-ml brown bottles containing 30 mg preadded ascorbic acid. The bailer was washed with the well water twice before each collection. Each sampling bottle was filled completely and sealed immediately to ensure water samples without bubbles. All water samples were stored at 4°C before analysis, and the analytical work was completed within 2 wk after sampling.
Nineteen chlorinated volatile organic compounds (VOCs) were measured in this study, including VC, PCE, TCE, 1,1-DCE, cis/trans-1,2-DCE, 1,1,1-TCA, 1,1-DCA, 1,2-DCA, chloroethane, trichlorofluoromethane, meth-ylene chloride, chloroform, benzene, bromodichloromethane, toluene, 1,1,2-trichloroethane, chlorobenzene, and 1,1,1,2-tetrachloroethane. The VOC concentrations were determined by using a method modified from U.S. EPA Method 524.2 (U.S. EPA, 1992a). Briefly, a purge and trap device (Tekmar 3000) was used to collect the analytes, which were subsequently analyzed by a gas chromatograph/mass spectrometer (HP6890 and HP5972, Hewlett Packard, USA) equipped with an RTX-Volatiles capillary column (60
m × 0.32 mm × 1.5 µm). Calibration was performed by the internal standard
method using 50 µg/L fluorobenzene and 4-bromofluorobenzene in each sample for quantification. The detection limit of each VOC was calculated by 7 different analyses of the VOC standards at 0.4 µg/L. Based on threefold the standard deviation of the mean standard concentration, the detection limits for these 19 VOCs ranged from 0.01 to 0.1 µg/L. Nondetected (ND) values were replaced by half of their detection limits when calculating the geometric and arithmetic mean of concentrations. The reproducibility was evaluated with nine sets of groundwater samples containing VOCs and was calculated from two duplicate analyses. The relative mean deviation of these duplicates was within 20% for most of the target VOCs.
Water Exposure Parameters We used empirical data from our field
survey to obtain exposure parameters for a more realistic risk prediction. Residents in the nearby communities were invited to participate in a com-plete physical examination including a detailed structured questionnaire. We collected data on body weight, height, exposure-related activities such as drinking water, showering, food and cloth washing, etc., as well as expo-sure duration and time. However, for ventilation rate, chemical-specific permeability coefficient, and average time, which were not collected in our study, the default values recommended by the U.S. EPA were adopted (U.S. EPA, 1992b, 1997a).
We considered all the potential exposure routes, including ingestion, inhalation, and dermal absorption, in the exposure assessment. First, we conducted an experiment to measure VOCs in boiling water to examine
whether ingestion of boiled water was a potential exposure pathway be-cause the survey showed that 99% of the residents drank boiled water. Second, the inhalation exposure from volatilization in showers was esti-mated by using the model developed by Little (1992) and the physical characteristics of shower system in Taiwan reported by Kuo et al. (1998).
The parameters of such shower rooms were 1.2 m3 of air in the shower,
water flow rate of 5 L/min, air flow rate of 50 L/min, air exchange rate of 2.5 times/h, water temperature of 44°C, and shower-head height of 1.8 m. Based on two-resistance theory, we can obtain overall mass-transfer
coeffi-cients with a liquid-phase basis (KOLA) for PCE and TCE that were 7.2 L/
min, and 9.2 L/min, respectively (Little, 1992). The values of KOLA for the
other 5 chlorinated hydrocarbons were assumed to be 9.2 L/min because experimental data were not available. The values of absorption efficiency of chlorinated hydrocarbons in the alveoli were assumed around 50%, be-cause TCE and 1,1,1-TCA were estimated to have inhalation absorption efficiency in the range of 30–78% (Pleil et al., 1998; Byard, 1989). Third, the dose from dermal absorption was estimated for showering and hand exposure-related activities, such as washing vegetables, washing dishes, and doing laundry by hand. The fractions of skin in contact with water were assumed to be 80% for showering, and 8% for washing activities involved with hand exposure, respectively. The chemical-specific perme-ability coefficients were derived from a report of dermal exposure assess-ment of the U.S. EPA (1992b).
The site-specific exposure parameters used in our study were obtained as follows: The exposure duration was defined as the period in years be-tween the year of initial exposures after 1970 and the year at the end of exposures. The exposure time during showering was defined as the minutes per day that an individual spent for a shower using groundwater. A default value of 20 min/d was assumed for the exposure time of hand exposure-related activities. The skin surface area was estimated by using a formula
(surface area = 0.0239H0.417W0.517) proposed by the U.S. EPA (1997a) and
the heights (H) and weights (W) of 382 individuals measured by the regis-tered nurses.
Our risk assessments were based on two exposure scenarios: the reason-able maximum exposure (RME) as a precautionary estimate, and the average exposure proposed by the U.S. EPA (1989, 1998a, 2001b). For RME, we used the upper-bound estimate of each input variable, which were the 95% upper confidence limit of the arithmetic mean for chemical concentrations and the 95th percentiles of exposure parameters for their corresponding dis-tributions. For average exposure, we used the geometric means of contami-nant concentrations and the arithmetic means of exposure parameters to estimate health risks.
Chronic daily intakes were calculated both for inhalation while shower-ing and for dermal absorption from showers and hand exposure-related ac-tivities. Lifetime intake was defined as the exposure dose per unit body
weight and per unit time, averaged over an assumed lifetime of 70 yr. The equations for calculating chronic daily intakes are displayed as follows:
Dermal contact:
C× SA × F× PC × ET × EF × ED × CF Chronic daily intake (mg/kg-d) = _____________________________________
BW × AT
(U.S. EPA, 1989, 1997a), where C is chemical concentration in
ground-water (mg/L), SA skin surface area (m2), F fraction of skin in contact with
water (unitless), PC Permeability coefficient (cm/h), ET exposure time (h/d), EF exposure frequency (d/yr), ED exposure duration (yr), and AT
average time (d) using lifetime intake for carcinogen = 70 × 365 and
chronic intake for noncarcinogen = ED × 365, BW body weight (kg), and
CF conversion factor (10–1 L/m3).
Inhalation:
Cair× VR × AE × ET × EF × ED × CF Chronic daily intake (mg/kg-d) = ___________________________________
BW × AT
(Kuo et al., 1998; U.S. EPA, 1989, 1997a), where Cair is concentration in
air (mg/L), VR ventilation rate (m3/h), AE absorption efficiency in alveoli
(unitless) = 50%, ET exposure time (h/d), EF exposure frequency (d/yr), ED exposure duration (yr), AT average time (d) using lifetime intake for
car-cinogen = 70 × 365 and chronic intake for noncarcinogen = ED × 365,
BW body weight (kg), and CF conversion factor (103 L/m3).
Dose Response/Risk Characterizatio n
Chronic hazards and carcinogenic risks were characterized by incorpo-rating exposure assessment and toxicity values. Hazard index (HI) was used as an indicator of noncarcinogenic risk, which summarized the ratios of the chronic exposure doses to the chemical-specific reference dose (RfD) values. Carcinogenic risk was incremental probability of getting cancer over a life-time, which was calculated from lifetime intake multiplied by slope factor for individual chemical carcinogen. The primary sources of the toxicity values, including RfD and slope factors, were from the U.S. EPA data-bases. We followed a hierarchy of preferred sources, namely, Integrated Risk Information System (IRIS), Health Effects Assessment Summary Tables (HEAST), and other provisional values that were available in the online data-base of the Risk Assessment Information System (ORNL, 2001). As weighting evidence of carcinogenic potential (U.S. EPA, 1996), we assessed carcino-genic risk for human carcinogen of VC and probable human carcinogens of PCE and TCE. The total organ HI was calculated by summarizing over all chlorinated hydrocarbons assuming additive effects of multiple chemicals (U.S. EPA, 1989).
Uncertainty/Sensitivity Analysis
Monte Carlo analysis was used with the risk calculations to incorpo-rate individual input distributions of exposure variables to produce proba-bility distributions of the health risk estimates and to assess uncertainties in the risk assessment (U.S. EPA, 1997b). The simulations were performed with Crystal Ball (Decisioneering, 2000) in conjunction with the spread-sheet program Microsoft Excel 2000. Health risk was calculated through 5000 iterations using randomly selected values derived from individual probability distributions of the corresponding exposure model parame-ters. The simulation model was also used for sensitivity analysis in which the relative importance of each input variable was assessed by calculating its contribution to variance.
RESULTS
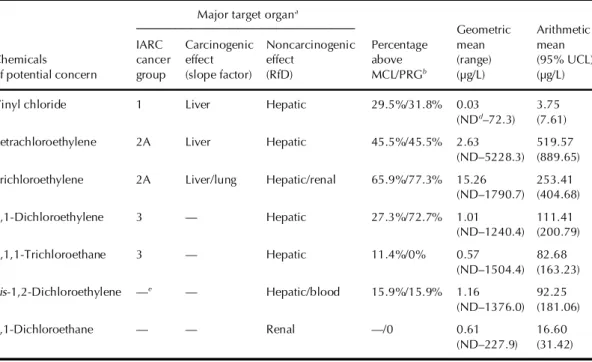
The hazard identification step identified seven chlorinated hydrocar-bons, which met our selection criteria, as target pollutants for health risk assessment. Table 1 summarizes the toxicological characteristics, health concerns, and groundwater concentrations of VC, PCE, TCE, 1,1-DCE, 1,1,1-TCA, cis-1,2-DCE, and 1,1-DCA. Hepatic effects were their common noncarcinogenic chronic hazards. The three chemicals with carcinogenic effects, VC, PCE, and TCE, had the liver as their major target organ. There were wide ranges of groundwater concentrations among these seven chlori-nated hydrocarbons. Geometric mean (GM) concentrations ranged from 0.03 µg/L for VC to 15.26 µg/L for TCE. The 95% upper-bound concen-trations ranged from 7.61 µg/L for VC to 889.65 µg/L for PCE. There was also significant spatial variation in groundwater concentrations as shown by an example result for TCE in Figure 1. High levels of TCE above the MCL (5 µg/L) were found in 29 out of 44 wells (66%) in the downstream commu-nity. The highest concentrations of contaminants were found in the wells closest to the R factory. An excessively high TCE concentration of 192 µg/L was found even in the well located about 1 km northerly from the factory. In contrast, all 19 VOCs were either at trace or nondetected (ND) levels in the 2 upstream wells to the south of the factory.
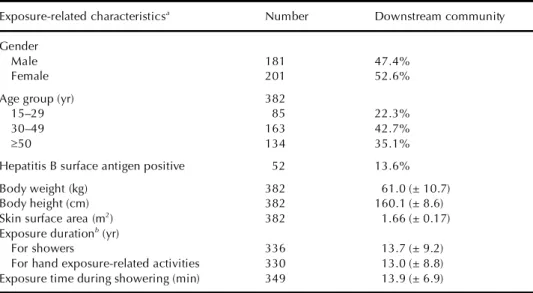
A total of 529 adult residents aged above 15 yr participated in our field survey, including 382 persons in the downstream community and 147 from the upstream community. The exposure-related characteristics of the 382 downstream residents are summarized in Table 2. The prevalence of hepa-titis B virus (HBV) carriers was 13.6%. The average body weight and skin
surface area used in this study were 61 kg and 1.66 m2, respectively, which
were less than the U.S. EPA anthropometrical default values for assessing risks on adults. The average durations of key water exposure parameters were 13.7 yr of taking showers and 13.0 yr of involving hand exposure-related activities. The average time for each shower was about 13.9 min, which was less than the U.S. EPA default value. The results of residuals in water at temperatures of 4, 45, 65, 85, and 100°C and at 1 min after 100°C
for PCE, TCE, 1,1-DCE, and 1,1-DCA are shown in Figure 2. The concentra-tions decreased significantly as water temperatures increased. There were negligible concentrations in the water after boiling for 1 min. Based on this finding, we excluded water ingestion exposure to VOCs from our risk esti-mation.
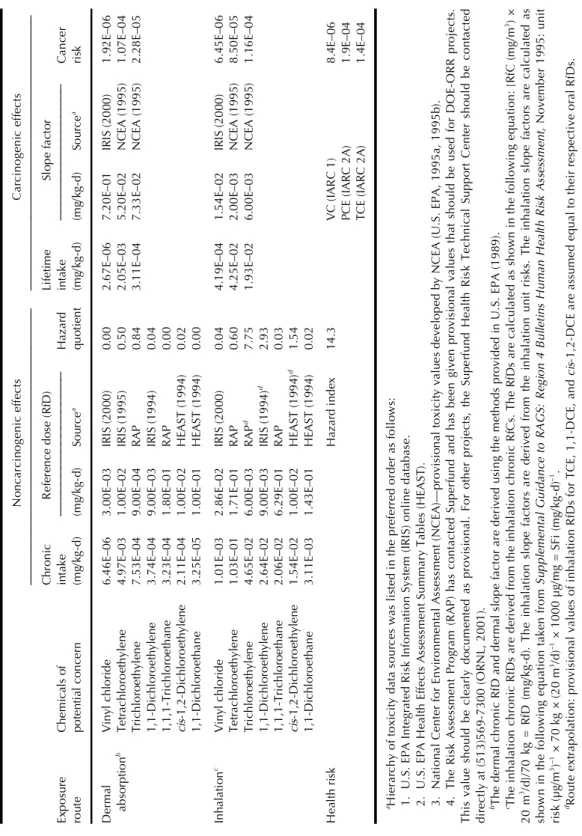
Table 3 presents the results of chronic exposure doses and health risk estimates for the routes of dermal absorption and inhalation based on the RME scenarios. The overall HI values calculated from inhalation exposure were about 10-fold higher than those from dermal absorption. Inhalation exposure from showering accounted for 61% of total cancer risks. There were 4 contaminants with HI greater than 1.0, which were PCE, TCE, 1,1-DCE, and cis-1,2-DCE. The summation of HI over 7 contaminants was 14.3, which was around an order of magnitude greater than the
accept-able level. The carcinogenic risks for VC, PCE, and TCE were 8.4 × 10⁻⁶,
1.9 × 10⁻⁴ , and 1.4 × 10⁻⁴, respectively. The latter two IARC Group 2A
car-TABLE 1. Concentrations and Frequency Distribution of Chemicals of Potential Concern in the 44 Downstream Residential Wells
Major target organa
____________________________ Geometric Arithmetic
IARC Carcinogenic Noncarcinogenic Percentage mean mean
Chemicals cancer effect effect above (range) (95% UCL)c
of potential concern group (slope factor) (RfD) MCL/PRGb (µg/L) (µg/L)
Vinyl chloride 1 Liver Hepatic 29.5%/31.8% 0.03 3.75
(NDd–72.3) (7.61)
Tetrachloroethylene 2A Liver Hepatic 45.5%/45.5% 2.63 519.57
(ND–5228.3) (889.65) Trichloroethylene 2A Liver/lung Hepatic/renal 65.9%/77.3% 15.26 253.41
(ND–1790.7) (404.68) 1,1-Dichloroethylene 3 — Hepatic 27.3%/72.7% 1.01 111.41 (ND–1240.4) (200.79) 1,1,1-Trichloroethane 3 — Hepatic 11.4%/0% 0.57 82.68 (ND–1504.4) (163.23) cis-1,2-Dichloroethylene —e — Hepatic/blood 15.9%/15.9% 1.16 92.25 (ND–1376.0) (181.06) 1,1-Dichloroethane — — Renal —/0 0.61 16.60 (ND–227.9) (31.42)
aToxicity values are derived from animal bioassays based on which target organ is primarily affected.
bMaximum contaminant level (MCL) is the water quality standard set by U.S. EPA (1999). Region 9 Preliminary
Remediation Goal (PRG) is the risk-based contaminant level in residential tap water from inhalation exposure (U.S. EPA, 2000).
c95% Upper confidence limit (UCL) is the upper-bound estimate of the contaminant distribution, which is the
input for conservative estimation of health risk under reasonable maximal exposure (RME) assumptions.
dND (nondetected) value was replaced by (½ × detection limit) as calculating the geometric/arithmetic mean. e—, Not available.
FIGURE 1. Geographic distribution of 49 residential wells near the R factory and levels of tri-choloroethylene (TCE, µg/L), one of the major contaminants in the groundwater.
TABLE 2. Summary of Exposure-Related Characteristics of 382 Residents Aged Over 15 yr in the Downstream Community
Exposure-related characteristicsa Number Downstream community
Gender
Male 181 47.4%
Female 201 52.6%
Age group (yr) 382
15–29 85 22.3%
30–49 163 42.7%
³ 50 134 35.1%
Hepatitis B surface antigen positive 52 13.6%
Body weight (kg) 382 61.0 (± 10.7)
Body height (cm) 382 160.1 (± 8.6)
Skin surface area (m2) 382 1.66 (± 0.17)
Exposure durationb(yr)
For showers 336 13.7 (± 9.2)
For hand exposure-related activities 330 13.0 (± 8.8) Exposure time during showering (min) 349 13.9 (± 6.9)
aCharacteristics are presented in percentage for nominal variables and arithmetic mean (± standard
deviation) for continuous variables.
bExposure duration was defined as the period in years between the year of initial exposures after
cinogens might pose cancer risks exceeding the upper limit of the
accept-able range between 10–6 and 10–4 (U.S. EPA, 1990). The point estimates of
health risks based on average exposure showed that HI was 0.2, and can-cer risks of VC, PCE, and TCE were 7.3 × 10⁻⁹, 1.3 × 10⁻⁷, and 1.2 × 10⁻⁶,
respectively.
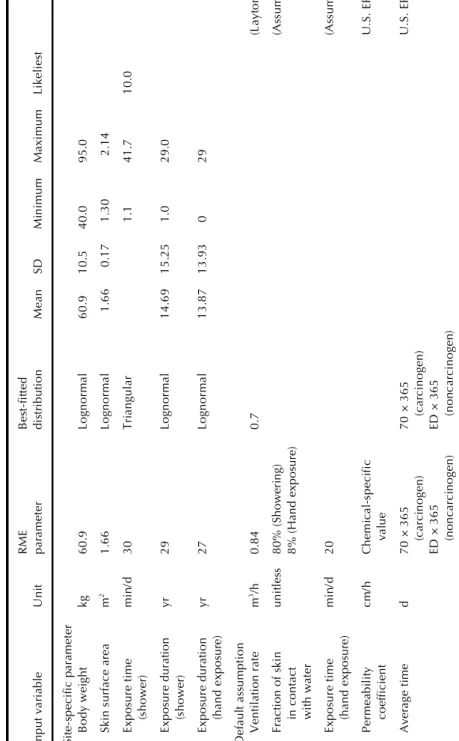
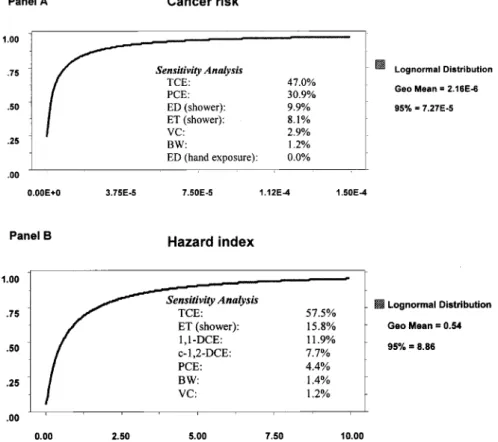
The input distributions of exposure-related variables, as well as assumed default values during Monte Carlo simulations, are summarized in Table 4. Figure 3 displays the cumulative probability distributions of simu-lated results and their associated sensitivity analyses for cancer risk (A) and HI (B). We found the simulated results were lognormal distributions. For
cancer risk, the 95% upper-bound estimate was 7.3 × 10⁻⁵, while the GM
estimate was 2.2 × 10⁻⁶. The sensitivity analysis showed that TCE and PCE
contributed most to the variance of cancer risk estimates, while the expo-sure duration and time for showers accounted for another 9.9% and 8.1% of variance, respectively. For noncarcinogenic risk, the 95% upper-bound estimate was 8.9 and the GM estimate was 0.5. The variance of noncar-cinogenic risk estimates was explained by TCE alone for 57.5% and expo-sure time of shower for 15.8%.
DISCUSSION
This is the first site-specific quantitative health risk assessment among more than 160 suspected hazardous waste sites throughout Taiwan. Based on the RME scenarios, we found that the community residents exposed to chlorinated hydrocarbons in the contaminated groundwater had an un-FIGURE 2. Concentrations of chlorinated hydrocarbons during the process of boiling, in an experi-ment on a water sample from a downstream contaminated well.
229 TA B LE 3 . C al cu la te d H ea lth R is ks , B ot h N on ca rc in og en ic a nd C ar ci no ge ni c, B as ed o n R ea so na bl e M ax im al E xp os ur e (R M E) N on ca rc in og en ic e ffe ct s C ar ci no ge ni c ef fe ct s __ __ __ __ __ __ __ __ __ __ __ __ __ __ __ __ __ _ __ __ __ __ __ __ __ __ __ __ __ __ __ __ __ __ C hr on ic R ef er en ce d os e (R fD ) Li fe tim e Sl op e fa ct or Ex po su re C he m ic al s of in ta ke __ __ __ __ __ __ __ __ __ H az ar d in ta ke __ __ __ __ __ __ __ __ _ C an ce ro ut e po te nt ia l c on ce rn (m g/ kg -d ) (m g/ kg -d ) So ur ce a qu ot ie nt (m g/ kg -d ) (m g/ kg -d ) So ur ce a ri sk D er m al V in yl c hl or id e 6. 46 E– 06 3. 00 E– 03 IR IS (2 00 0) 0. 00 2. 67 E– 06 7. 20 E– 01 IR IS (2 00 0) 1. 92 ab so rp tio n b Te tr ac hl or oe th yl en e 4. 97 E– 03 1. 00 E– 02 IR IS (1 99 5) 0. 50 2. 05 E– 03 5. 20 E– 02 N C EA (1 99 5) 1. 07 Tr ic hl or oe th yl en e 7. 53 E– 04 9. 00 E– 04 R A P 0. 84 3. 11 E– 04 7. 33 E– 02 N C EA (1 99 5) 2. 28 1, 1-D ic hl or oe th yl en e 3. 74 E– 04 9. 00 E– 03 IR IS (1 99 4) 0. 04 1, 1, 1-Tr ic hl or oe th an e 3. 23 E– 04 1. 80 E– 01 R A P 0. 00 ci s-1, 2-D ic hl or oe th yl en e 2. 11 E– 04 1. 00 E– 02 H EA ST (1 99 4) 0. 02 1, 1-D ic hl or oe th an e 3. 25 E– 05 1. 00 E– 01 H EA ST (1 99 4) 0. 00 In ha la tio n c V in yl c hl or id e 1. 01 E– 03 2. 86 E– 02 IR IS (2 00 0) 0. 04 4. 19 E– 04 1. 54 E– 02 IR IS (2 00 0) 6. 45 Te tr ac hl or oe th yl en e 1. 03 E– 01 1. 71 E– 01 R A P 0. 60 4. 25 E– 02 2. 00 E– 03 N C EA (1 99 5) 8. 50 Tr ic hl or oe th yl en e 4. 65 E– 02 6. 00 E– 03 R A P d 7. 75 1. 93 E– 02 6. 00 E– 03 N C EA (1 99 5) 1. 16 1, 1-D ic hl or oe th yl en e 2. 64 E– 02 9. 00 E– 03 IR IS (1 99 4) d 2. 93 1, 1, 1-Tr ic hl or oe th an e 2. 06 E– 02 6. 29 E– 01 R A P 0. 03 ci s-1, 2-D ic hl or oe th yl en e 1. 54 E– 02 1. 00 E– 02 H EA ST (1 99 4) d 1. 54 1, 1-D ic hl or oe th an e 3. 11 E– 03 1. 43 E– 01 H EA ST (1 99 4) 0. 02 H ea lth r is k H az ar d in de x 14 .3 V C (I A R C 1 ) 8. 4E PC E (IA R C 2 A ) 1. 9E TC E (IA R C 2 A ) 1. 4E aH ie ra rc hy o f t ox ic ity d at a so ur ce s w as li st ed in th e pr ef er re d or de r as fo ll ow s: 1. U .S . E PA In te gr at ed R is k In fo rm at io n Sy st em (I R IS ) o nl in e da ta ba se . 2. U .S . E PA H ea lth E ffe ct s A ss es sm en t S um m ar y Ta bl es ( H EA ST ). 3. N at io na l C en te r fo r En vi ro nm en ta l A ss es sm en t ( N C EA )— pr ov is io na l to xi ci ty v al ue s de ve lo pe d by N C EA (U .S . E PA , 1 99 5a , 1 99 5b ). 4. Th e R is k A ss es sm en t Pr og ra m ( R A P) h as c on ta ct ed S up er fu nd a nd h as b ee n gi ve n pr ov is io na l va lu es t ha t sh ou ld b e us ed f or D O E-O R R p ro Th is v al ue s ho ul d be c le ar ly d oc um en te d as p ro vi si on al . Fo r ot he r pr oj ec ts , th e Su pe rf un d H ea lth R is k Te ch ni ca l Su pp or t C en te r sh ou ld b e co nt di re ct ly a t (5 13 )5 69 -7 30 0 (O R N L, 2 00 1) . bTh e de rm al c hr on ic R fD a nd d er m al s lo pe fa ct or a re d er iv ed u si ng th e m et ho ds p ro vi de d in U .S . E PA ( 19 89 ). cTh e in ha la ti on c hr on ic R fD s ar e de ri ve d fr om t he in ha la tio n ch ro ni c R fC s. T he R fD s ar e ca lc ul at ed a s sh ow n in t he f ol lo w in g eq ua tio n: [ R fC (m g/ 20 m 3/d ] /7 0 kg = R fD ( m g/ kg -d ). Th e in ha la tio n sl op e fa ct or s ar e de ri ve d fr om t he i nh al at io n un it r is ks . Th e in ha la tio n sl op e fa ct or s ar e ca lc ul at sh ow n in t he f ol lo w in g eq ua tio n ta ke n fr om S up pl em en ta l G ui da nc e to R A G S: R eg io n 4 B ul le tin s H um an H ea lth R is k A ss es sm en t, N ov em be r 19 95 ri sk (µ g/ m 3) –1 × 7 0 kg × (2 0 m 3/d ) –1 × 1 00 0 µg /m g = S Fi (m g/ kg -d ) –1. dR ou te e xt ra po la ti on : pr ov is io na l va lu es o f i nh al at io n R fD s fo r TC E, 1 ,1 -D C E, a nd c is -1 ,2 -D C E ar e as su m ed e qu al to th ei r re sp ec ti ve o ra l R fD s.
230 TA B LE 4 . In pu t V ar ia bl es a nd T he ir C or re sp on di ng D is tr ib ut io ns U se d in th e Pr ob ab ili ty R is k C al cu la tio ns w it h M on te C ar lo S im ul at io ns R M E B es t-fit te d In pu t v ar ia bl e U ni t pa ra m et er di st ri bu tio n M ea n SD M in im um M ax im um Li ke lie st Si te -s pe ci fic p ar am et er B od y w ei gh t kg 60 .9 Lo gn or m al 60 .9 10 .5 40 .0 95 .0 Sk in s ur fa ce a re a m 2 1. 66 Lo gn or m al 1. 66 0. 17 1. 30 2. 14 Ex po su re ti m e m in /d 30 Tr ia ng ul ar 1. 1 41 .7 10 .0 (s ho w er ) Ex po su re d ur at io n yr 29 Lo gn or m al 14 .6 9 15 .2 5 1. 0 29 .0 (s ho w er ) Ex po su re d ur at io n yr 27 Lo gn or m al 13 .8 7 13 .9 3 0 29 (h an d ex po su re ) D ef au lt as su m pt io n V en til at io n ra te m 3/h 0. 84 0. 7 (L ay to n, 1 99 Fr ac tio n of s ki n un itl es s 80 % (S ho w er in g) (A ss um ed ) in c on ta ct 8% (H an d ex po su re ) w ith w at er Ex po su re ti m e m in /d 20 (A ss um ed ) (h an d ex po su re ) Pe rm ea bi li ty cm /h C he m ic al -s pe ci fi c U .S . E PA (1 co ef fi ci en t va lu e A ve ra ge t im e d 70 × 3 65 70 × 3 65 U .S . E PA (1 (c ar ci no ge n) (c ar ci no ge n) ED × 3 65 ED × 3 65 (n on ca rc in og en ) (n on ca rc in og en )
acceptable cancer risk. The total organ HI also indicated a potential health hazard. These RME risk levels were considered the high-end values on which remedial decision would be based, and provided the basis for de-veloping protective exposure levels for future use as recommended by the U.S. EPA (2001b). Moreover, average risk estimates indicated a margin-ally significant cancer risk. Therefore, we must examine carefully the uncer-tainties involved in the processes of risk assessment before making any rec-ommendation.
From our risk assessment, individual contaminants, including PCE, TCE, 1,1-DCE, and cis-1,2-DCE, posed an unacceptable chronic hazard to the liver, and PCE and TCE were probable human carcinogens involving the liver as the most sensitive tumor site. The potential health risks associated with the complex mixtures of chlorinated hydrocarbons might be greater than those of a single chemical because synergistic interactions may occur when mixtures are encountered (Seed et al., 1995). Moreover, a high HBV carrier rate of 15–20% was reported in the general population of Taiwan
FIGURE 3. Cumulative probability distributions of health risks and associated sensitivity analysis using Monte Carlo simulations and assuming additive effects.
(Chen & Sung, 1978; Sung et al., 1984). The physical examination also dis-closed a similar prevalence (13.6%) of HBV carriers among the down-stream residents, who might be more susceptible to hepatic carcinogens such as aflatoxin (Wang et al., 1996). Therefore, the lack of a proper syn-ergistic assessment model between these chlorinated solvents and chronic hepatitis B infection (Du & Wang, 1998) might further aggravate the mag-nitude of underestimation of risk.
Inhalation exposure from showering contributed most to health risk esti-mates in our study. Traditionally, ingestion of drinking water was considered a primary route of exposure to contaminated water (McKone, 1989). How-ever, our empirical data indicated that the route of water ingestion was neg-ligible. Moreover, research has shown that VOCs inhaled from tap water may exceed exposure via direct ingestion (McKone & Knezovich, 1991). Since we did not exhaustively include all the pathways of other indoor air exposure, such as boiling water, cooking, dishwashing, toilets, etc., the cal-culated health risk might be likely to be an underestimate.
As the sensitivity analysis revealed, the environmental concentrations and exposure duration for showers were the two key contributors to the total variances in the exposure modeling. It also indicated that TCE was the most important pollutant in determining health risk at this site, which could be used as an indicator for remediation. However, uncertainties associated with assumptions and scientific knowledge in our risk characterization must also be addressed. One limitation in our estimation of inhalation
doses was that the KOLA values for TCE and PCE were obtained from
experi-mental data (Little, 1992), but those for the other five chemicals were assumed. We performed sensitivity analysis to assess the degree of impact
from the assumption of KOLA values. The results showed that the estimates
of cancer risk and HI increased by less than 0.4%, and 5%, respectively, as
the KOLA values for the other five chemicals were all increased up to
10-fold. Therefore, the magnitude of impact from KOLAs of these chemicals on
health risk estimates was relatively small and it would not influence our conclusion. For dermal exposure, the exposure duration of doing laundry by hand was difficult to define because most residents could not recall exactly how much time they spent on doing laundry by hand. By perform-ing sensitivity analysis, we found that dermal absorption from hand expo-sure-related activities accounted for less than 5% of cancer risk estimates even if an assumed 40-min exposure time was used. Moreover, this expo-sure duration contributed less than 0.1% of the total variance of cancer risk, as shown in Figure 3A. Thus, the assumed 20 min did not significantly bias the risk estimates. Due to the scope of this study, the target organ doses were not estimated in our study using physiologically based pharmacoki-netic (PBPK) models (Roy et al., 1996; Bogen & Gold, 1997). The results of this study must be interpreted with some caution. Further studies are war-ranted to provide toxicity values based on PBPK models for any refined risk assessment.
Our results indicated that chlorinated hydrocarbons in groundwater may tend to be persistent pollution for decades due to their physical char-acteristics of dense nonaqueous-phase liquids (DNAPLs) (Huling & Weaver, 1991), and vinyl chloride, a more toxic and persistent chemical under anaerobic conditions, may be produced from degradation of PCE and TCE. The current levels of contaminants, especially PCE and TCE, were shown to be much higher than the water quality standards set by the U.S. EPA (1999). However, most people in the downstream community were still unaware of potential health effects of the groundwater contamination. Some of them had consistently used the contaminated groundwater for domestic water supply until 2000 because of economic incentives. Therefore, risk manage-ment is urgently needed to educate the residents, based on our risk assess-ment.
CONCLUSION
According to our risk assessment, increased chronic and carcinogenic risks on the liver may still be a potential public health concern for people living downstream, especially for sensitive subpopulations, such as HBV carriers. We recommend that all the community people should discontinue using the contaminated groundwater for any purpose. The environmental health advisories have to continue the medical surveillance and follow-up on the community residents. Further research will be needed to address the actual health impact on the residential population.
REFERENCES
Agency for Toxic Substances and Disease Registry. 2000. Hazardous Substance Release and Health Effects Database (HazDat Database). http://www.atsdr.cdc.gov/hazdat.html, cited 13 July. Bechtel Environmental, Inc. 1995. 1990 Preliminary site investigation report. Taoyuan Site, Taiwan,
Republic of China. San Francisco, CA: Bechtel Environmental, Inc.
Bogen, K. T., and Gold, L. S. 1997. Trichloroethylene cancer risk: Simplified calculation of PBPK-Based MCLs for cytotoxic end points. Regul. Toxicol. Pharmacol. 25:26–42.
Byard, J. L. 1989. Hazard assessment of 1, 1, 1 -trichloroethane in groundwater. In Risk assessment of environmental and human health hazards: a textbook of case studies, ed. D. J. Paustenbach, pp. 331–344. New York: John Wiley & Sons.
Chen, D. S., and Sung, J. L. 1978. Hepatitis B virus infection and chronic liver diseases in Taiwan.
Acta Hepatogastroenterol. 25:423–430.
Decisioneering, Inc. 2000. Crystal Ball 2000 user manual. Denver, CO: Decisioneering, Inc.
Du, C. L., and Wang, J. D. 1998. Increased morbidity odds ratio of primary liver cancer and cirrhosis of the liver among vinyl chloride monomer workers. Occup. Environ. Med. 55:528–532.
Geomatrix Consultants, Inc. 1995. Revised health assessment. Taoyuan and Chupei sites, Taiwan, Republic of China. San Francisco, CA: Geomatrix Consultants, Inc.
Geomatrix Consultants, Inc. 1998. Groundwater remediation technical practicability evaluation report, Taoyuan site, Taiwan. San Francisco, CA: Geomatrix Consultants, Inc.
Huling, S. G., and Weaver, J. W. 1991. Dense nonaqueous phase liquids. EPA/540/4-91/002. Ada, OK: Robert S. Kerr Environmental Research Laboratory, U.S. EPA.
International Agency for Research on Cancer. 1995. Dry cleaning, some chlorinated solvents and other industrial chemicals. IARC Monogr. Eval. Carcinogen. Risks Hum. 63.
Industrial Technology Research Institute (Taiwan). 1994. Project report of sampling and analysis of residential wells near the Taoyuan site [in Chinese]. Hsinchu, Taiwan: Union Chemical Laboratory, ITRI.
Kuo, H. W., Chiang, T. F., Lo, I. I., Lai, J. S., Chan, C. C., and Wang, J. D. 1998. Estimates of cancer risk from chloroform exposure during showering in Taiwan. Sci. Total Environ. 218:1–7.
Layton, D. W. 1993. Metabolically consistent breathing rates for use in dose assessments. Health Phys. 64:23–36.
Little, J. C. 1992. Applying the two-resistance to contaminant volatilization in shower. Environ. Sci. Technol. 26:1341–1349.
McKone, T. E. 1989. Household exposure models. Toxicol. Lett. 49:321–339.
McKone, T. E., and Knezovich, J. P. 1991. The transfer of trichloroethylene (TCE) from a shower to indoor air: Experimental measurements and their implications. J. Air Waste Manage. Assoc. 41:
832–837.
Micromedex, Inc. 1998. Toxicology, Occupational Medicine & Environmental Series (TOMES Plus System) CD-ROM database. Greenwood, CO: Micromedex, Inc.
Oak Ridge National Laboratory. 2001. Risk assessment toxicity values in the Risk Assessment Infor-mation System (RAIS) database.http://risk.Isd.ornl.gov/tox/tox_values.shtml, cited 23 July. Pleil, J. D., Fisher, J. W., and Lindstrom, A. B. 1998. Trichloroethylene level in human blood and
exhaled breath from controlled inhalation exposure. Environ. Health Perspect. 106:573–580.
Rhomberg, L. R. 2000. Dose-response analyses of the carcinogenic effects of trichloroethylene in experimental animals. Environ. Health Perspect. 108(suppl. 2):343–358.
Roy, A., Weisel, C. P., Lioy, P. J., and Geogopoulos, P. G. 1996. A distribution parameter physiologi-cally-based pharmacokinetic model for dermal and inhalation exposure to volatile organic com-pounds. Risk Anal. 16:147–160.
Seed, J., Brown, R. P., Olin, S. S., and Foran, J. A. 1995. Chemical mixtures: Current risk assessment methodologies and future directions. Regul. Toxicol. Pharmacol. 22:76–94.
Sims, J. L., Suflita, J. M., and Russell, H. H. 1991. Reductive dehalogenation of organic contaminants in soil and ground water. EPA/540/4-90/054. Ada, OK: Robert S. Kerr Environmental Research Laboratory, U.S. Environmental Protection Agency (EPA).
Sung, J. L., Chen, D. S., Lai, M. Y., Yu, J. Y., Wang, T. H., Wang, C. Y., Lee, C. Y., Chen, S. H., and Ko, T. M. 1984. Epidemiological study on hepatitis B virus infection in Taiwan. Chin. J. Gastroenterol. 1:1–9.
Taiwan Environmental Protection Administration. 1994–1997. The 1st–10th meeting reports of the investigation committee on groundwater pollution[in Chinese]. Taipei, Taiwan: Environmental Protection Administration, Executive Yuan, Republic of China.
Taiwan Environmental Protection Administration. 1999. Environmental Policy Monthly II(11). May http://www.epa.gov.tw/english/epm/issue9905.htm, cited 21 August 2001.
Target Environmental Services, Inc. 1995. Soil gas/ perched groundwater/ soil survey, Taoyuan site, Taiwan. Columbia, MD: Target Environmental Services, Inc.
U.S. Environmental Protection Agency. 1989. Risk assessment guidance for Superfund (RAGS), Vol. I, Human health evaluation manual (Part A)—Interim final. EPA/540/1-89/002. Washington, DC: U.S. EPA.
U.S. Environmental Protection Agency. 1990. National oil and hazardous substances pollution con-tingency plan. Final rule. Fed Reg. 8:8670–8852.
U.S. Environmental Protection Agency. 1992a. Measurement of purgeable organic compounds in water by capillary column gas chromatography/ mass spectrometry. Revision 4.0, Method 524. Cincinnati: Environmental Monitoring System Laboratory.
U.S. Environmental Protection Agency. 1992b. Dermal exposure assessment: principles and applica-tions—Interim report. EPA/600/8-91/011B. Washington, DC: U.S. EPA.
U.S. Environmental Protection Agency. 1995a. Risk assessment issue paper for: Carcinogenicity infor-mation for trichloroethylene (TCE) (CASRN 79-01-6). Cincinnati, OH: Superfund Technical Support Center, National Center for Environmental Assessment.
U.S. Environmental Protection Agency. 1995b. Risk assessment issue paper for: Carcinogenicity infor-mation for tetrachloroethylene (perchloroethylene, PERC) (CASRN 127-18-4). Cincinnati, OH: Superfund Technical Support Center, National Center for Environmental Assessment.
U.S. Environmental Protection Agency. 1996. Proposed guidelines for carcinogen risk assessment. EPA/600/P-92/003C. Washington, DC: U.S. EPA. http://www.epa.gov/ORD/WebPubs/carcinogen, cited 5 June 1999.
U.S. Environmental Protection Agency. 1997a. Exposure factor handbook, Vol. I, General factors. EPA/600/P-95/002Fa. Washington, DC: U.S. EPA.
U.S. Environmental Protection Agency. 1997b. Guiding principles for Monte Carlo analysis. EPA/630/ R-97/001. Washington, DC: U.S. EPA. http://www.epa.gov/ncea/monteabs.htm, cited 6 July 2000. U.S. Environmental Protection Agency. 1998a. Risk assessment guidance for Superfund (RAGS), Vol.
I, Human health evaluation manual (Part D, Standardized planning, reporting, and review of superfund risk assessments)—Interim. Publication 9285.7-01D. Washington, DC: U.S. EPA. http://www.epa.gov/superfund/programs/risk/ragsd/index.htm, cited 5 August 2000.
U.S. Environmental Protection Agency. 1999. National primary drinking water regulations. EPA/810/ F-94/001. http://www.epa.gov/safewater/consumer/mcl.pdf, cited 15 February.
U.S. Environmental Protection Agency. 2000. Region 9 preliminary remediation goals (PRGs) tables. http://www.epa.gov/region09/waste/sfund/prg/files/PRG2000.xlw, cited 23 July 2001.
U.S. Environmental Protection Agency. 2001a. Integrated risk information system (IRIS) online data-base.http://www.epa.gov/iris, cited 19 July.
U.S. Environmental Protection Agency. 2001b. Region 4 human health risk assessment bulletins— supplement to RAGS.http://www.epa.gov/region04/waste/ots/healtbul.htm, cited 26 July. Wang, L. Y., Hatch, M., Chen, C. J., Levin, B., You, S. L., Lu, S. N., Wu, M. H., Wu, W. P., Wang,
L. W., Wang, Q., Huang, G. T., Yang, P. M., Lee, H. S., and Santella, R. M. 1996. Aflatoxin exposure and risk of hepatocellular carcinoma in Taiwan. Int. J. Cancer 67:620–625.