For Peer Review Only
MICROARRAY DETECTION OF GENE OVEREXPRESSION IN PRIMARY SPONTANEOUS PNEUMOTHORAX
Journal: Experimental Lung Research Manuscript ID: UELR-2009-0088.R2
Manuscript Type: Original Papers Date Submitted by the
Author:
Complete List of Authors: Fang, Hsin-Yuan; China Medical University Hospital, China Medical University, Thoracic Surgery
Ching-Yuang, Lin; China Medical University Hospital
Chow, Kuan-Chih; National Chung Hsing University, Graduate Institutes of Biomedical Sciences
Huang, Hung-Che; Changhua Christian Hospital, Surgery Ko, Wen-Je; National Taiwan University Hospital, Surgery
Keywords: primary spontaneous pneumothorax, gene expression, microarray, hypoxia, HIF-3a, caspase-8
For Peer Review Only
MICROARRAY DETECTION OF GENE OVEREXPRESSION IN PRIMARY
SPONTANEOUS PNEUMOTHORAX
Running head: Gene overexpression and PSP
Hsin-Yuan Fang, M.D.a,b, Ching-Yuang Lin, M.D., Ph.D.b, Kuan-Chih Chow, Ph.D.c,
Hung-Che Huang, M.D.d, Wen-Je Ko M.D., Ph.D.e
a
Division of Thoracic surgery,Department of Surgery, China Medical University Hospital,
China Meidcal University, Taichung, Taiwan;
b
Graduate Institute of Clinical Medicine, National Taiwan University, Taipei, Taiwan;
c
Graduate Institutes of Biomedical Sciences, National Chung Hsing University, Taichung,
Taiwan;
d
Department of Surgery, Changhua Christian Hospital,a Changhua, Taiwan.
e
Department of Surgery, National Taiwan University Hospital, Taipei, Taiwan.
Address all correspondence and reprint requests to: Dr Wen-Je Ko M.D., Ph.D.,
Department of Surgery, National Taiwan University Hospital, Taipei, Taiwan.
Tel.: +886-2-23123456 ext 3098; Fax:+ 886-2-23958747; 3 4 5 6 7 8 9 10 11 12 13 14 15 16 17 18 19 20 21 22 23 24 25 26 27 28 29 30 31 32 33 34 35 36 37 38 39 40 41 42 43 44 45 46 47 48 49 50 51 52 53 54 55 56 57 58 59 60
For Peer Review Only
or Professor Kuan-Chih Chow,
Graduate Institute of Biomedical Sciences, National Chung Hsing University, 250
Kuo-Kuang Road, Taichung 40227, Taiwan.
E-mail: [email protected] 3 4 5 6 7 8 9 10 11 12 13 14 15 16 17 18 19 20 21 22 23 24 25 26 27 28 29 30 31 32 33 34 35 36 37 38 39 40 41 42 43 44 45 46 47 48 49 50 51 52 53 54 55 56 57 58 59 60
For Peer Review Only
ABSTRACT
Primary spontaneous pneumothorax (PSP) often occurs after the rupture of small bullae or
subpleural blebs in otherwise normal lungs. The underlying mechanism(s) remain unclear.
The aim of this study was to identify genes potentially involved in the development of PSP.
Microarray analysis was performed to identify specific gene expression patterns. Expression
levels of genes identified to be significantly up or down-regulated in association with PSP
were confirmed by real time polymerase chain reaction (qRT-PCR) and Western blotting.
Immunohistochemistry was performed to identify lung cell types highly expressing these
genes. Microarray analysis revealed that expression levels of hypoxia-inducible factor-3
alpha (HIF-3α) and caspase-8 were significantly upregulated in tissue from patients with PSP,
while interferon-gamma, interleukin (IL)-6 and IL-8 were down-regulated (all P<0.05).
These genes are related to hypoxia, apoptosis, and inflammation. HIF-3α and caspase-8
protein levels were increased in samples from patients with PSP. HIF-3α and caspase-8 were
localized in mesothelial cells, alveolar type II pneumocytes and bronchoalveolar epithelial
cells in samples from patients with PSP. Our findings, although obviously preliminary given
the small sample size, suggest that hypoxia, inflammation, and apoptosis may play important
roles in the pathogenesis of PSP.
Key words: primary spontaneous pneumothorax; gene expression; microarray; hypoxia; HIF-3α; caspase-8. 3 4 5 6 7 8 9 10 11 12 13 14 15 16 17 18 19 20 21 22 23 24 25 26 27 28 29 30 31 32 33 34 35 36 37 38 39 40 41 42 43 44 45 46 47 48 49 50 51 52 53 54 55 56 57 58 59 60
For Peer Review Only
INTRODUCTION
Primary spontaneous pneumothorax (PSP) is a perplexing disease that usually occurs in
young, otherwise healthy individuals, in their late teens or third decade of life without
clinically apparent lung disease (1). It is defined by the presence of air in the pleural cavity
and secondary lung collapse, and occurs without an obvious precipitating cause (2). The
incidence of PSP is approximately 7 to 18 and 1 to 6 cases per 100,000 individuals per year in
males and females respectively (3-5). Physical activity does not play a role in mediating the
development of PSP, with the majority of cases of spontaneous pneumothorax occurring at
rest (2,6). Smoking, however, is an important risk factor for PSP (6).
Pathophysiologically, PSP is thought to be caused by the formation of small bullae or
rupture of subpleural blebs in the lung (7). However, lung parenchymal abnormalities may
also be involved (6). Although the mechanism of bulla formation remains unclear, it is
generally believed that the disease is caused by chronic and progressive destruction of
alveolar structures at the apex of the lung, possibly due to chronic inflammation, hypoxia,
oxidative stress, or an imbalance between protease and antiprotease activity (8,9). The
location of the unique or diffuse sites of air leakage that lead to PSP is unknown, although a
key role for distal airway inflammation due to cigarette smoking has been proposed (6). It has
also been suggested that porosity of the visceral pleura is increased in patients with PSP
compared to in normal individuals (6). 3 4 5 6 7 8 9 10 11 12 13 14 15 16 17 18 19 20 21 22 23 24 25 26 27 28 29 30 31 32 33 34 35 36 37 38 39 40 41 42 43 44 45 46 47 48 49 50 51 52 53 54 55 56 57 58 59 60
For Peer Review Only
In this study, we used oligonucleotide microarrays (10,11) to assess differential gene
expression profiles in lung tissue obtained from patients with and without PSP. Our aim was
to identify genes potentially involved in mediating the underlying pathogenesis of this
condition. Gene clusters were generated, and the differences in gene expression patterns were
compared between the two groups of patients. Expression levels of genes found to be
significantly up or down-regulated in samples from patients with PSP were determined by
quantitative reverse-transcription polymerase chain reaction (qRT-PCR). Lung cell types
highly expressing the specific genes were identified by immunohistochemistry.
MATERIALS AND METHODS
Lung tissue samples and initial clinical evaluation
From October 2006 to August 2007, forty consecutive patients with sporadic PSP,
defined by spontaneous air accumulation in the thoracic cavity without evidence of clinical
lung disease, were enrolled in the study. No patient had a family history of PSP. Wedge
resection of the lung was performed by video-assisted thoracoscopic surgery. Seven lung
tissue blebs from the apex of each diseased lung were collected from each patient during
surgery. Lung tissue biopsies were also obtained from patients with stage I non-small cell
lung carcinomas during lobectomy. These samples, used as comparative controls, were taken
at least 5 cm from the tumor margin to reduce the likelihood of tumor cell invasion and 3 4 5 6 7 8 9 10 11 12 13 14 15 16 17 18 19 20 21 22 23 24 25 26 27 28 29 30 31 32 33 34 35 36 37 38 39 40 41 42 43 44 45 46 47 48 49 50 51 52 53 54 55 56 57 58 59 60
For Peer Review Only
inflammation.
This study was approved by the Changhua Christian Hospital Institutional Review
Board. Written informed consent was obtained from each participating individual.
RNA isolation
All samples were immediately frozen in sterile tubes by immersion in liquid nitrogen.
The procedure for RNA extraction has been described previously (12). Briefly, total RNA
was extracted using TRIzol® reagent (Invitrogen, Carlsbad, CA) and purified using an
RNeasy Mini Kit (Qiagen, Hilden, Germany). Following extraction, RNA concentrations
were quantified using an ND-1000 spectrophotometer (NanoDrop Technologies, Wilmington,
DE). All isolated RNA was of high purity.
Oligonucleotide microarray
Following the synthesis of cRNA from 0.5 µg of total RNA, cRNA was amplified using
a Fluorescent Linear Amplification Kit (Agilent Technologies, Santa Clara, CA) and labeled
with either Cy3-CTP or Cy5-CTP fluorescent dye (Perkin-Elmer, Waltham, MA). Specifically,
cRNAs from lung samples obtained from patients with PSP were labeled with Cy5, while
those from control group patients were labeled with Cy3. Cy-labeled cRNA was partially
fragmented into pieces of approximately 50 to 100 nucleotides long (Agilent Technologies)
before being hybridized to a Whole Human Genome 4×44k oligo microarray slide (Agilent
Technologies) at 60°C for 17 hours. After repeated washing, the hybridized microarrays were 3 4 5 6 7 8 9 10 11 12 13 14 15 16 17 18 19 20 21 22 23 24 25 26 27 28 29 30 31 32 33 34 35 36 37 38 39 40 41 42 43 44 45 46 47 48 49 50 51 52 53 54 55 56 57 58 59 60
For Peer Review Only
scanned using a microarray scanner (Agilent Technologies) at OD535 for Cy3 and OD625 for
Cy5. The scanned images were analyzed using Feature extraction software 8.1 (Agilent
Technologies). The transformed data were normalized using the rank-consistency-filtering
LOWESS method.
GeneSpring analysis
The transformed microarray data were analyzed using GeneSpring GX 7.3.1 (Agilent
Technologies) with a defined algorithm to filter out the differentially expressed genes that had
marginal flags in at least 4 of 7 samples. The differentially expressed genes were further
correlated and pooled with cluster analysis and gene ontology classification was performed.
Real-time PCR
An aliquot of total RNA from each sample was used for real-time PCR. cDNA was
synthesized from total RNA (5 µg) using MMLV reverse transcriptase (Promega, Madison,
WI). The resultant cDNA was diluted 1:40 fold before real-time PCR analysis. Specific
primer pairs were selected from the Universal ProbeLibraryTM database
(http://www.exiqon.com). The primer sequences are shown in Table 1. The specificity of each
primer pair was tested and confirmed using a Bioanalyzer 2100 (Agilent Technologies) for
correct PCR product size. Real-time PCR was performed using a Roche LightCycler 1.5
(Roche, Basel, Switzerland). Reaction mixtures contained 1× master mix (which included
SYBR Green fluorescent dye), 3.75 µM of primer mixture, and cDNA. Each sample was run 3 4 5 6 7 8 9 10 11 12 13 14 15 16 17 18 19 20 21 22 23 24 25 26 27 28 29 30 31 32 33 34 35 36 37 38 39 40 41 42 43 44 45 46 47 48 49 50 51 52 53 54 55 56 57 58 59 60
For Peer Review Only
in triplicate. Real-time PCR was carried out as follows: denaturing of the cDNA template at
95°C for 10 seconds, hybridization with primers at 60°C for 15 seconds, and DNA synthesis
at 72°C for 10 seconds. In each real-time PCR run, data were automatically analyzed by the
system software and an amplification plot was generated for each sample. From these plots,
the crossing point (Cp) value, which indicates the beginning of the exponential amplification
phase, was automatically determined by the machine-embedded software. Each PCR cycle
represented a two-fold change. The fold change in relative gene expression for each sample
was further calculated using the formula: 2-δδ CP (where δCp = Cp of target gene – Cp of
control gene, and δδCp = δCp test sample – δCp control sample).
Western blotting
PSP lung tissue samples were suspended in lysis buffer (1% NP-40, 0.1% SDS, 0.5%
sodium deoxycholate, 150 mM NaCl, 20 mM Tris-HCl pH 8, 1 mM PMSF, and protease
inhibitors). A total of 100 mg of protein was separated by 12% SDS-PAGE and transferred
onto PVDF membranes. Blots were blocked with 5% non-fat milk in TBS + 0.05% Tween20
(TBST) and incubated overnight at 41ºC with the primary antibodies for the following:
hypoxia-inducible factor 3-alpha (HIF-3α: Abcam, Cambridge, MA), caspase-8 (Santa Cruz
Biotechnology Inc., Santa Cruz, CA) or actin (Sigma: monoclonal antibody A5441 was used
at 1:10000 dilution). Blots were then washed in TBST and incubated for 1 hour with the
horseradish peroxidase coupled, 1:500 diluted secondary polyclonal antibody (Amersham 3 4 5 6 7 8 9 10 11 12 13 14 15 16 17 18 19 20 21 22 23 24 25 26 27 28 29 30 31 32 33 34 35 36 37 38 39 40 41 42 43 44 45 46 47 48 49 50 51 52 53 54 55 56 57 58 59 60
For Peer Review Only
Biosciences, Piscataway, NJ). Blots were washed again in TBST and developed by enhanced
chemiluminescence (Amersham Pharmacia Biotech Europe GmbH, Du bendorf,
Switzerland).
Immunohistochemistry
Immunohistochemical staining was performed using an immunoperoxidase method as
previously described (13,14). Briefly, following incubation with either HIF-3α (Abcam) or
caspase-8 (Santa Cruz Biotechnology Inc.) antibodies, the immunological signals on paraffin
sections were amplified using an LSAB method (Dako, Carpenteria, CA). The chromogenic
reaction was visualized by peroxidase-conjugated streptavidin (Dako) and aminoethyl
carbazole (Sigma). Slides were counterstained with Mayor’s hematoxylin, and positive
staining was identified as crimson-red granules by light microscopy.
Slide evaluation
Slide evaluation has been described previously (13,14). Four diseased areas were
randomly selected for evaluation in each slide. Each slide was examined and evaluated by
two independent investigators. Staining intensities were semiquantitatively scored according
to the percentage of positively stained cells apparent: -, equivalent to the negative control,
with less than 10% of positive cells; +, intermediate staining, positive cells were around 10%
to 50%; and ++, strong staining, with more than 50% of cells positively stained.
Statistical analysis 3 4 5 6 7 8 9 10 11 12 13 14 15 16 17 18 19 20 21 22 23 24 25 26 27 28 29 30 31 32 33 34 35 36 37 38 39 40 41 42 43 44 45 46 47 48 49 50 51 52 53 54 55 56 57 58 59 60
For Peer Review Only
Data are presented as median (interquartile range, IQR) for continuous variables and
number (percentage) for categorical variables. Continuous and categorical variables were
statistically compared by Mann-Whitney U test and Fisher’s exact, respectively. Spearman’s
rank correlations were performed to assess correlations between the gene expression levels
obtained by real-time PCR and those by oligonucleotide array. A P-value of 0.05 or less was
defined as statistically significant. All statistical analyses were two-sided and performed
using SPSS software (version 15.0, SPSS Inc., Chicago, IL).
RESULTS
Patient characteristics
Among the 44 subjects recruited for the study, 41 were males (93.2%). The median age
and body mass index were 21 years (IQR: 19 to 27) and 21 kg/m2 (IQR: 19-21). Of these, 11
(7 PSP and 4 control patients) were selected for further analysis. The clinical and
demographic characteristics of these patients are summarized in Table 2.
Differentially expressed genes in patients with PSP
Among 35713 probed genes, 2841 genes were differentially expressed and had at least
2-fold changes in 5 of 7 samples from PSP patients (P <0.05). According to the cluster
analysis, the 2841 genes could be categorized into three groups: Group 1, consisting of 1085
genes, Group 2, consisting of 1127 genes, and Group 3, consisting of 629 genes. Each group 3 4 5 6 7 8 9 10 11 12 13 14 15 16 17 18 19 20 21 22 23 24 25 26 27 28 29 30 31 32 33 34 35 36 37 38 39 40 41 42 43 44 45 46 47 48 49 50 51 52 53 54 55 56 57 58 59 60
For Peer Review Only
was further categorized according to the function of genes identified: behavior, cell
communication, response to stimulus, and cell motility. The up-regulated and down-regulated
genes in Group 1 are summarized in supplementary Tables 1A and 1B. Five genes (two
up-regulated: HIF-3α and caspase-8; three down-regulated: interferon-gamma [IFN-γ],
interleukin [IL]-6 and IL-8) were selected from Group 1 as candidates for further
characterization based on histological findings, P-values, and our hypothesis that hypoxia in
the apex of the lung may play an important role in the development of PSP.
Candidate gene analysis
Real-time PCR was performed in an attempt to confirm the findings of microarray
analysis. A significant positive correlation was apparent for IL-8 only (P <0.05), with there
being a borderline significant positive correlation for HIF-3α (P=0.052) (Figure 1).
As real-time PCR analysis did not provide conclusive data, Western blotting was
performed as another independent means to indirectly verify mRNA expression. Compared to
control samples, only HIF-3α and caspase-8 showed observable differences (increases) in
protein levels in six out of the seven PSP patients (Figure 2: there was insufficient sample
available from one patient with PSP for Western blot analysis). Caspase-8 in particular
showed marked increases in protein expression levels.
Localization of overexpressed genes as determined by immunohistochemistry
Immunohistochemical localization of HIF-3α and caspase-8 was performed in samples 3 4 5 6 7 8 9 10 11 12 13 14 15 16 17 18 19 20 21 22 23 24 25 26 27 28 29 30 31 32 33 34 35 36 37 38 39 40 41 42 43 44 45 46 47 48 49 50 51 52 53 54 55 56 57 58 59 60
For Peer Review Only
obtained from patients with PSP. When expression of HIF-3α and caspase-8 was detected in
consecutive sections, it indicated that HIF-3α and caspase-8 were simultaneously expressed
in the same cell. HIF-3α (Figure 3) and caspase-8 (Figure 4) were identified in mesothelial
cells, alveolar type II (ATII) pneumocytes and bronchoalveolar epithelial cells. Cells with
enlarged cytoplasm were frequently detected in the afflicted lung tissue samples from patients
with PSP, except when various degrees of alveolar deformation, cell detachment and tissue
fibrosis were evident. The number of enlarged cells increased with the severity of progressive
fibrosis. For severe progressive fibrosis (+ or ++), HIF-3α was detected in 80% of alveolar
macrophages and 75% of both type II pneumocytes and mesothelial cells. While caspase-8
was detected in 90% of alveolar macrophages, 75% of type II pneumocytes, and 70% of
mesothelial cells. Atherosclerotic pulmonary arterioles were frequently identified in nearby
lung tissue, indicating that stagnated blood flow in these areas might be responsible for the
decreased oxygen supply in the apical lung.
There was no evidence of blebs, fibrosis or inflammation in tissue obtained from control
group patients.
DISCUSSION
The immunohistochemistry staining and Western blots performed in this study show that
overexpression of HIF-3α and caspase-8 was common in patients with PSP. Identification of 3 4 5 6 7 8 9 10 11 12 13 14 15 16 17 18 19 20 21 22 23 24 25 26 27 28 29 30 31 32 33 34 35 36 37 38 39 40 41 42 43 44 45 46 47 48 49 50 51 52 53 54 55 56 57 58 59 60
For Peer Review Only
HIF-3α in the nuclei of mesothelial and ATII cells suggests that these tissues had been under
hypoxic conditions for some period of time. The pathological resemblance of the enlarged
and detached ATII cells to SARS virus-infected pneumocytes (15), in which air exchange and
oxygen supply are reduced, further supports our supposition that oxygen supply in these
tissues may have been diminished. Reduced exhalation of air and a weakened pleural lining
of the diseased air sac are potential contributors to the formation of subpleural blebs or bullae
in PSP (8,16).
In response to oxygen deprivation, cells rapidly inhibit any energy-consuming
bioactivities, preventing the initiation of sudden cell death, and simultaneously activate a
transcription response that is principally mediated by HIF to ensure survival (17). HIF-1 is a
transcriptional complex that consists of a heterodimer of HIF-1α and HIF-1β that binds to
hypoxia-responsive elements (HRE). HIF-1β is a product of the aryl-hydrocarbon receptor
(AhR) nuclear translocator (ARNT) gene that is constitutively expressed when oxygen supply
is ample. Under these conditions, HIF-1α is labile. These proteins contain a basic
helix-loop-helix, a Per-AhR/ARNT-Sim homology sequence (18), and N-terminal and
C-terminal transactivation domains (19). Hypoxia increases HIF-1α protein stability by
reducing hydroxylation of the protein, blocking its interaction with the von Hippel-Lindau
protein and hence inhibiting proteasome degradation of HIF-1α.
Three types of HIF-α subunits have been identified: HIF-1α, HIF-2α and HIF-3α. Like 3 4 5 6 7 8 9 10 11 12 13 14 15 16 17 18 19 20 21 22 23 24 25 26 27 28 29 30 31 32 33 34 35 36 37 38 39 40 41 42 43 44 45 46 47 48 49 50 51 52 53 54 55 56 57 58 59 60
For Peer Review Only
HIF-1α and -2α, HIF-3α dimerizes with ARNT/HIF-1β and translocates to the nuclei of
hypoxic cells to bind with HRE (19). HIF-3α probably plays an important role in repressing
hypoxia-related gene expression. In the case of PSP, cells in the afflicted area might not be
able to respond adequately to prevent the initiation of cell death in the face of continuous
oxygen deficiency (17).
We found that gene expression of caspase-8 was up-regulated in lung tissue samples
obtained from patients with PSP, and that expression of this protease was localized to
bronchoalveolar epithelial, mesothelial and AT II cells. Caspase-8 is a downstream effector of
apoptosis-related effectors, e.g., tumor necrosis factor (TNF) and Fas. Fas, as a member of
the TNF/nerve growth factor receptor family, is the receptor of the Fas ligand (FasL) (20,21).
It has been demonstrated that mice deficient in Fas or FasL have lesser degrees of acute lung
injury compared to wild type mice when challenged with lung immunoglobulin G immune
complex deposition (22). This suggests that epithelial apoptosis induced by Fas/FasL may
contribute to acute lung injury.
This study has a number of limitations that warrant mention. The major limitation is the
small number of samples analyzed, which severely the limited the power of statistical
analysis. We do note however, that even though real-time PCR and Western verification
analysis could not be considered conclusive, three potential candidates (HIF-3α, caspase-8,
and IL-8) were identified as possible mediators of PSP. These findings should be viewed as 3 4 5 6 7 8 9 10 11 12 13 14 15 16 17 18 19 20 21 22 23 24 25 26 27 28 29 30 31 32 33 34 35 36 37 38 39 40 41 42 43 44 45 46 47 48 49 50 51 52 53 54 55 56 57 58 59 60
For Peer Review Only
preliminary. Future larger scale studies are warranted to confirm and extend the findings
presented herein. We also acknowledge that the control samples used in the present study
were not obtained from normal/healthy individuals. Although biopsies were taken well away
from tumors in these patients, it is possible that expression of the genes assessed may have
been influenced by patient condition.
In this study, we have utilized oligonucleotide microarray, real-time PCR and
immunohistochemical methods in an attempt to identify potential candidate genes
differentially regulated in patients with PSP. We found evidence that a number hypoxia-,
apoptosis- and inflammation-related genes were differentially expressed upon microarray
analysis, i.e., HIF-3α, caspase-8, IFN-γ, IL-6 and IL-8. Even though the expression data
determined by microarray were not conclusively validated by real-time PCR,
immunohistochemical staining indicated that HIF-3α and caspase-8 were highly expressed in
various cell types in the apex of the lung. Future in vivo studies are needed to confirm and
extend these findings and determine the stage at which expression changes become
biologically significant and whether these changes might be of prognostic significance. We
speculate that chronic hypoxia and hypoxia-induced apoptosis in the apex of the lung could
be responsible for provoking local tissue responses and inflammation, which may indirectly
induce apoptosis of bronchoepithelial, AT II and mesothelial cells. This would lead to
alveolar sac and interstitial pleural lining structural damage, which may underlie the 3 4 5 6 7 8 9 10 11 12 13 14 15 16 17 18 19 20 21 22 23 24 25 26 27 28 29 30 31 32 33 34 35 36 37 38 39 40 41 42 43 44 45 46 47 48 49 50 51 52 53 54 55 56 57 58 59 60
For Peer Review Only
formation of blebs and bullae in PSP.
DECLARATION OF INTEREST
The authors report no conflicts of interest. The authors alone are responsible for the
content and writing of the paper.
ACKNOWLEDGMENTS
This study was supported by a grant from the foundation of Changhua Christian
Hospital (#96-CCH-IRP-18), Taiwan. 3 4 5 6 7 8 9 10 11 12 13 14 15 16 17 18 19 20 21 22 23 24 25 26 27 28 29 30 31 32 33 34 35 36 37 38 39 40 41 42 43 44 45 46 47 48 49 50 51 52 53 54 55 56 57 58 59 60
For Peer Review Only
REFERENCES
1. Noppen M. Management of primary spontaneous pneumothorax. Curr Opin Pulm Med
2003;9:272-275.
2. Weissberg D, Refaely Y. Pneumothorax: experience with 1,199 patients. Chest
2000;117:1279-1285.
3. Melton LJ, III, Hepper NG, Offord KP. Incidence of spontaneous pneumothorax in
Olmsted County, Minnesota: 1950 to 1974. Am Rev Respir Dis 1979;120:1379-1382.
4. Morimoto T, Shimbo T, Noguchi Y, Koyama H, Sasaki Y, Nishiwaki K, Fukui T. Effects
of timing of thoracoscopic surgery for primary spontaneous pneumothorax on prognosis
and costs. Am J Surg 2004;187:767-774.
5. Gupta D, Hansell A, Nichols T, Duong T, Ayres JG, Strachan D. Epidemiology of
pneumothorax in England. Thorax 2000;55:666-671.
6. Tschopp JM, Rami-Porta R, Noppen M, Astoul P. Management of spontaneous
pneumothorax: state of the art. Eur Respir J 2006;28:637-650.
7. Ayed AK. Suction versus water seal after thoracoscopy for primary spontaneous
pneumothorax: prospective randomized study. Ann Thorac Surg 2003;75:1593-1596.
8. Sahn SA, Heffner JE. Spontaneous pneumothorax. N Engl J Med 2000;342:868-874. 3 4 5 6 7 8 9 10 11 12 13 14 15 16 17 18 19 20 21 22 23 24 25 26 27 28 29 30 31 32 33 34 35 36 37 38 39 40 41 42 43 44 45 46 47 48 49 50 51 52 53 54 55 56 57 58 59 60
For Peer Review Only
9. Noppen M, Baumann MH. Pathogenesis and treatment of primary spontaneous
pneumothorax: an overview. Respiration 2003;70:431-438.
10. Hansel NN, Hilmer SC, Georas SN, Cope LM, Guo J, Irizarry RA, Diette GB.
Oligonucleotide-microarray analysis of peripheral-blood lymphocytes in severe asthma.
J Lab Clin Med 2005;145:263-274.
11. Dallas PB, Gottardo NG, Firth MJ, Beesley AH, Hoffmann K, Terry PA, Freitas JR,
Boag JM, Cummings AJ, Kees UR. Gene expression levels assessed by oligonucleotide
microarray analysis and quantitative real-time RT-PCR -- how well do they correlate?
BMC Genomics 2005;6:59.
12. Provenzano M, Mocellin S. Complementary techniques: validation of gene expression
data by quantitative real time PCR. Adv Exp Med Biol 2007;593:66-73.
13. Mocellin S, Rossi CR, Pilati P, Nitti D, Marincola FM. Quantitative real-time PCR: a
powerful ally in cancer research. Trends Mol Med 2003;9:189-195.
14. Chen JT, Lin TS, Chow KC, Huang HH, Chiou SH, Chiang SF, Chen HC, Chuang TL,
Lin TY, Chen CY. Cigarette smoking induces overexpression of hepatocyte growth
factor in type II pneumocytes and lung cancer cells. Am J Respir Cell Mol Biol
2006;34:264-273. 3 4 5 6 7 8 9 10 11 12 13 14 15 16 17 18 19 20 21 22 23 24 25 26 27 28 29 30 31 32 33 34 35 36 37 38 39 40 41 42 43 44 45 46 47 48 49 50 51 52 53 54 55 56 57 58 59 60
For Peer Review Only
15. Chow KC, Hsiao CH, Lin TY, Chen CL, Chiou SH. Detection of severe acute
respiratory syndrome-associated coronavirus in pneumocytes of the lung. Am J Clin
Pathol 2004;121:574-580.
16. Matute-Bello G, Winn RK, Jonas M, Chi EY, Martin TR, Liles WC. Fas (CD95) induces
alveolar epithelial cell apoptosis in vivo: implications for acute pulmonary
inflammation. Am J Pathol 2001;158:153-161.
17. Liu L, Cash TP, Jones RG, Keith B, Thompson CB, Simon MC. Hypoxia-induced
energy stress regulates mRNA translation and cell growth. Mol Cell 2006;21:521-531.
18. Kikuchi Y, Ohsawa S, Mimura J, Ema M, Takasaki C, Sogawa K, Fujii-Kuriyama Y.
Heterodimers of bHLH-PAS protein fragments derived from AhR, AhRR, and Arnt
prepared by co-expression in Escherichia coli: characterization of their DNA binding
activity and preparation of a DNA complex. J Biochem 2003;134:83-90.
19. Hara S, Hamada J, Kobayashi C, Kondo Y, Imura N. Expression and characterization of
hypoxia-inducible factor (HIF)-3alpha in human kidney: suppression of HIF-mediated
gene expression by HIF-3alpha. Biochem Biophys Res Commun 2001;287:808-813.
20. Nagata S. Apoptosis by death factor. Cell 1997;88:355-365.
21. Strand S, Hofmann WJ, Hug H, Muller M, Otto G, Strand D, Mariani SM, Stremmel W, 3 4 5 6 7 8 9 10 11 12 13 14 15 16 17 18 19 20 21 22 23 24 25 26 27 28 29 30 31 32 33 34 35 36 37 38 39 40 41 42 43 44 45 46 47 48 49 50 51 52 53 54 55 56 57 58 59 60
For Peer Review Only
Krammer PH, Galle PR. Lymphocyte apoptosis induced by CD95 (APO-1/Fas)
ligand-expressing tumor cells--a mechanism of immune evasion? Nat Med
1996;2:1361-1366.
22. Lu Q, Harrington EO, Rounds S. Apoptosis and lung injury. Keio J Med
2005;54:184-189. 3 4 5 6 7 8 9 10 11 12 13 14 15 16 17 18 19 20 21 22 23 24 25 26 27 28 29 30 31 32 33 34 35 36 37 38 39 40 41 42 43 44 45 46 47 48 49 50 51 52 53 54 55 56 57 58 59 60
For Peer Review Only
FIGURE LEGENDS
Figure 1. Correlation between the gene expression fold-change alterations as determined by
real-time polymerase chain reaction (RT-PCR) and microarray for 7 patients. Spearman’s
rank correlation was used. * Statistically significant, P<0.05.
Figure 2. Western blot detection of hypoxia-inducible factor-3α (HIF-3α), caspase-8 and β
-actin in lung samples obtained from six patients with primary spontaneous pneumothorax
and four control group patients.
Figure 3. Immunohistochemical localization of hypoxia-inducible factor-3α (HIF-3α) in lung
tissue samples obtained from patients with primary spontaneous pneumothorax. HIF-3α
expression is apparent in the representative slides shown: (A) blebs and mesothelial cells
(indicated by arrows, magnification ×200); (B) aggregated alveolar type II pneumocytes in
the fibrotic region (indicated by arrows, magnification ×200); (C) regenerated alveolar type II
pneumocytes in thickened air sacs (indicated by arrows, magnification ×200); and (D)
bronchoalveolar epithelial cells (indicated by arrows, magnification ×100).
Figure 4. Immunohistochemical localization of caspase-8 in lung tissue samples obtained
from patients with primary spontaneous pneumothorax. Caspase-8 expression is apparent in 3 4 5 6 7 8 9 10 11 12 13 14 15 16 17 18 19 20 21 22 23 24 25 26 27 28 29 30 31 32 33 34 35 36 37 38 39 40 41 42 43 44 45 46 47 48 49 50 51 52 53 54 55 56 57 58 59 60
For Peer Review Only
the representative slides shown: (A) mesothelial cells (magnification ×100); (B) enlarged
image of (A), mesothelial cells (indicated by arrows, magnification ×400); (C) alveolar type
II pneumocytes (indicated by arrows, original magnification ×200); and (D) bronchoalveolar
epithelial cells (indicated by arrows, magnification ×100). 3 4 5 6 7 8 9 10 11 12 13 14 15 16 17 18 19 20 21 22 23 24 25 26 27 28 29 30 31 32 33 34 35 36 37 38 39 40 41 42 43 44 45 46 47 48 49 50 51 52 53 54 55 56 57 58 59 60
For Peer Review Only
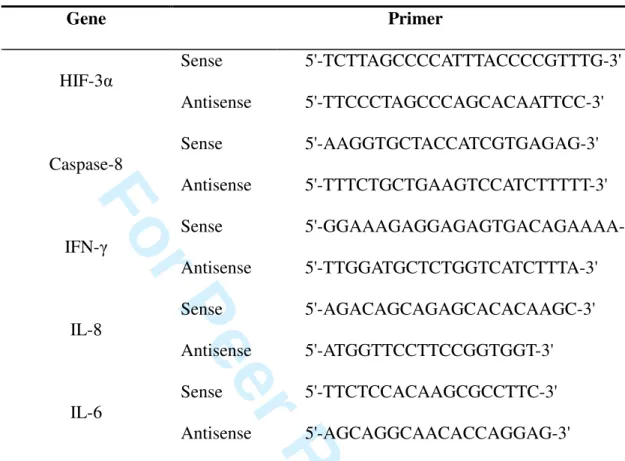
Table 1. Primer sequences used for real-time polymerase chain reaction.
Gene Primer Sense 5'-TCTTAGCCCCATTTACCCCGTTTG-3' HIF-3α Antisense 5'-TTCCCTAGCCCAGCACAATTCC-3' Sense 5'-AAGGTGCTACCATCGTGAGAG-3' Caspase-8 Antisense 5'-TTTCTGCTGAAGTCCATCTTTTT-3' Sense 5'-GGAAAGAGGAGAGTGACAGAAAA-3' IFN-γ Antisense 5'-TTGGATGCTCTGGTCATCTTTA-3' Sense 5'-AGACAGCAGAGCACACAAGC-3' IL-8 Antisense 5'-ATGGTTCCTTCCGGTGGT-3' Sense 5'-TTCTCCACAAGCGCCTTC-3' IL-6 Antisense 5'-AGCAGGCAACACCAGGAG-3'
HIF: hypoxia-inducible factor; IFN: interferon; IL: interleukin. 3 4 5 6 7 8 9 10 11 12 13 14 15 16 17 18 19 20 21 22 23 24 25 26 27 28 29 30 31 32 33 34 35 36 37 38 39 40 41 42 43 44 45 46 47 48 49 50 51 52 53 54 55 56 57 58 59 60
For Peer Review Only
Table 2. Clinical characteristics of patients with primary spontaneous pneumothorax (PSP) and control patients.
Characteristic Control# (n=4) PSP (n=7) P-value1
Age (years) 2 39.5 (34.0, 41.0) 17.0 (17.0, 24.0) 0.006* Gender 3 Male 3 (75.0) 6 (85.7) Female 1 (25.0) 1 (14.3) 1.000 Height (cm) 2 168.0 (162.5, 172.0) 175.0 (170.0, 178.0) 0.042* Body weight (kg) 2 64.0 (55.0, 70.0) 64.0 (58.0, 65.0) 0.788
Body mass index (kg/m2) 2 21.9 (20.8, 23.7) 19.6 (18.5, 22.5) 0.073
Surgery duration (minutes) - 84.0 (65.0, 107.0) -
Hospital stay (days) - 6.0 (3.0, 7.0) -
Smoker 3 2 (50.0) 2 (28.6) 0.576 Side involved 3 Right 1 (25.0) 2 (28.6) Left 3 (75.0) 4 (57.1) Bilateral 0 (0.0) 1 (14.3) 0.701 Surgical indications None - 0 (0.0) Ipsilateral recurrence - 5 (71.4) -
Persistent air leakage - 0 (0.0)
Contralateral recurrence - 1 (14.3) - Hemopneumothorax - 1 (14.3) - Bleb presence Single bleb - 3 (42.9) - 3 4 5 6 7 8 9 10 11 12 13 14 15 16 17 18 19 20 21 22 23 24 25 26 27 28 29 30 31 32 33 34 35 36 37 38 39 40 41 42 43 44 45 46 47 48 49 50 51 52 53 54 55 56 57 58 59 60
For Peer Review Only
Multiple blebs - 4 (57.1) -
Data are presented as median (inter-quartile range) for continuous variables and number
(percentage) for categorical variables.
#
Control patients had stage I non-small cell lung carcinomas.
1
Data were compared 2Mann-Whiney U test or 3Fisher’s exact test.
* Indicates a statistically significant difference, P<0.05. 3 4 5 6 7 8 9 10 11 12 13 14 15 16 17 18 19 20 21 22 23 24 25 26 27 28 29 30 31 32 33 34 35 36 37 38 39 40 41 42 43 44 45 46 47 48 49 50 51 52 53 54 55 56 57 58 59 60
For Peer Review Only
Correlation between the gene expression fold-change alterations as determined by real-time polymerase chain reaction (RT-PCR) and microarray for 7 patients. Spearman’s rank correlation was
used. * Statistically significant, P<0.05. 210x297mm (174 x 167 DPI) 3 4 5 6 7 8 9 10 11 12 13 14 15 16 17 18 19 20 21 22 23 24 25 26 27 28 29 30 31 32 33 34 35 36 37 38 39 40 41 42 43 44 45 46 47 48 49 50 51 52 53 54 55 56
For Peer Review Only
Western blot detection of hypoxia-inducible factor-3α (HIF-3α), caspase-8 and β-actin in lung samples obtained from six patients with primary spontaneous pneumothorax and four control group
patients. 442x250mm (96 x 96 DPI) 3 4 5 6 7 8 9 10 11 12 13 14 15 16 17 18 19 20 21 22 23 24 25 26 27 28 29 30 31 32 33 34 35 36 37 38 39 40 41 42 43 44 45 46 47 48 49 50 51 52 53 54 55 56
For Peer Review Only
Immunohistochemical localization of hypoxia-inducible factor-3α (HIF-3α) in lung tissue samples obtained from patients with primary spontaneous pneumothorax. HIF-3α expression is apparent in the representative slides shown: (A) blebs and mesothelial cells (indicated by arrows, magnification
x200); (B) aggregated alveolar type II pneumocytes in the fibrotic region (indicated by arrows, magnification x200); (C) regenerated alveolar type II pneumocytes in thickened air sacs (indicated
by arrows, magnification x200); and (D) bronchoalveolar epithelial cells (indicated by arrows, magnification x100). 280x208mm (96 x 96 DPI) 3 4 5 6 7 8 9 10 11 12 13 14 15 16 17 18 19 20 21 22 23 24 25 26 27 28 29 30 31 32 33 34 35 36 37 38 39 40 41 42 43 44 45 46 47 48 49 50 51 52 53 54 55 56
For Peer Review Only
Immunohistochemical localization of caspase-8 in lung tissue samples obtained from patients with primary spontaneous pneumothorax. Caspase-8 expression is apparent in the representative slides
shown: (A) mesothelial cells (magnification x100); (B) enlarged image of (A), mesothelial cells (indicated by arrows, magnification x400); (C) alveolar type II pneumocytes (indicated by arrows,
original magnification x200); and (D) bronchoalveolar epithelial cells (indicated by arrows, magnification x100). 281x202mm (96 x 96 DPI) 3 4 5 6 7 8 9 10 11 12 13 14 15 16 17 18 19 20 21 22 23 24 25 26 27 28 29 30 31 32 33 34 35 36 37 38 39 40 41 42 43 44 45 46 47 48 49 50 51 52 53 54 55 56
For Peer Review Only
Supplementary Table 1A: Up-regulated genes associated with the primary spontaneous pneumothorax (S.D., standard deviation)
Category Gene ID Description
Gene symbol Expression Fold S.D. AK026695 paxillin PXN 2.88 0.69
NM_000618 insulin-like growth factor 1 (somatomedin C) IGF1 2.70 2.60
AL133642 Enah/Vasp-like EVL 2.31 1.50
NM_032966 Burkitt lymphoma receptor 1, GTP binding protein (chemokine (C-X-C motif) receptor 5)
BLR1 2.18 2.66
NM_000701 ATPase, Na+/K+ transporting, alpha 1 polypeptide ATP1A1 2.14 0.64 NM_000582 secreted phosphoprotein 1 (osteopontin, bone sialoprotein
I, early T-lymphocyte activation 1)
SPP1 2.11 1.79
NM_000426 laminin, alpha 2 (merosin, congenital muscular dystrophy) LAMA2 2.08 0.87 NM_000618 insulin-like growth factor 1 (somatomedin C) IGF1 1.83 1.80 AK128645 syndecan binding protein (syntenin) SDCBP 3.01 0.54
NM_212482 fibronectin 1 FN1 1.93 0.64
NM_000442 platelet/endothelial cell adhesion molecule (CD31 antigen) PECAM1 1.87 0.60 NM_001897 chondroitin sulfate proteoglycan 4 (melanoma-associated) CSPG4 1.71 0.64 NM_002314 LIM domain kinase 1 LIMK1 5.28 7.53 NM_012431 sema domain, immunoglobulin domain (Ig), short basic
domain, secreted, (semaphorin) 3E
SEMA3E 2.60 1.43
NM_001144 autocrine motility factor receptor AMFR 1.96 1.00 NM_001138 agouti related protein homolog (mouse) AGRP 1.92 1.30 Behavior
NM_033181 cannabinoid receptor 1 (brain) CNR1 1.52 1.14 NM_006274 chemokine (C-C motif) ligand 19 CCL19 4.12 5.72 NM_018489 ash1 (absent, small, or homeotic)-like (Drosophila) ASH1L 3.88 0.81 NM_004799 zinc finger, FYVE domain containing 9 ZFYVE9 3.48 2.78 NM_004369 collagen, type VI, alpha 3 COL6A3 3.47 2.16 NM_013402 fatty acid desaturase 1 FADS1 3.42 1.29 NM_000923 phosphodiesterase 4C, cAMP-specific (phosphodiesterase
E1 dunce homolog, Drosophila)
PDE4C 2.95 0.65
NM_152794 hypoxia inducible factor 3, alpha subunit HIF3A 2.93 1.22 NM_032023 Ras association (RalGDS/AF-6) domain family 4 RASSF4 2.84 1.26 NM_000440 phosphodiesterase 6A, cGMP-specific, rod, alpha PDE6A 2.76 1.16 Cell
communication
AK126851 ankyrin 3, node of Ranvier (ankyrin G) ANK3 2.64 1.04
3 4 5 6 7 8 9 10 11 12 13 14 15 16 17 18 19 20 21 22 23 24 25 26 27 28 29 30 31 32 33 34 35 36 37 38 39 40 41 42 43 44 45 46 47 48 49 50 51 52 53 54 55 56 57 58 59 60
For Peer Review Only
NM_005654 nuclear receptor subfamily 2, group F, member 1 NR2F1 2.55 0.99 NM_022740 homeodomain interacting protein kinase 2 HIPK2 2.53 0.85 NM_006419 chemokine (C-X-C motif) ligand 13 (B-cell chemoattractant) CXCL13 2.49 3.24 NM_181745 G protein-coupled receptor 120 GPR120 2.42 1.16 NM_033050 succinate receptor 1 SUCNR1 2.27 0.60 AK098502 chromosome 9 open reading frame 39 C9orf39 2.25 0.42 NM_001106 activin A receptor, type IIB ACVR2B 2.24 0.65 NM_005188 Cas-Br-M (murine) ecotropic retroviral transforming
sequence
CBL 2.23 0.35
NM_006015 AT rich interactive domain 1A (SWI- like) ARID1A 2.22 0.40 NM_016577 RAB6B, member RAS oncogene family RAB6B 2.21 1.61
NM_004443 EPH receptor B3 EPHB3 2.19 0.82
NM_032966 Burkitt lymphoma receptor 1, GTP binding protein (chemokine (C-X-C motif) receptor 5)
BLR1 2.18 2.66
NM_021097 solute carrier family 8 (sodium/calcium exchanger), member 1
SLC8A1 2.18 0.59
NM_133631 roundabout, axon guidance receptor, homolog 1 (Drosophila)
ROBO1 2.15 0.46
NM_148968 tumor necrosis factor receptor superfamily, member 25 TNFRSF25 2.13 0.50 NM_170662 Cas-Br-M (murine) ecotropic retroviral transforming
sequence b
CBLB 2.12 0.57
NM_000582 secreted phosphoprotein 1 (osteopontin, bone sialoprotein I, early T-lymphocyte activation 1)
SPP1 2.11 1.79
AK098194 discoidin, CUB and LCCL domain containing 1 DCBLD1 2.09 0.36 NM_000426 laminin, alpha 2 (merosin, congenital muscular dystrophy) LAMA2 2.08 0.87
NM_001770 CD19 antigen CD19 2.05 0.90
NM_032023 Ras association (RalGDS/AF-6) domain family 4 RASSF4 2.05 0.57
NM_000208 insulin receptor INSR 1.98 1.04
NM_199040 nudix (nucleoside diphosphate linked moiety X)-type motif 4
NUDT4 1.97 0.36
NM_033356 caspase 8, apoptosis-related cysteine protease CASP8 1.97 0.47 NM_005900 SMAD, mothers against DPP homolog 1 (Drosophila) SMAD1 1.96 0.75 NM_021110 collagen, type XIV, alpha 1 (undulin) COL14A1 1.88 1.76 NM_000647 chemokine (C-C motif) receptor 2 CCR2 1.87 0.70 NM_006613 GRB2-related adaptor protein GRAP 1.87 0.72 NM_032246 ring finger and KH domain containing 3 RKHD3 1.87 0.65
3 4 5 6 7 8 9 10 11 12 13 14 15 16 17 18 19 20 21 22 23 24 25 26 27 28 29 30 31 32 33 34 35 36 37 38 39 40 41 42 43 44 45 46 47 48 49 50 51 52 53 54 55 56 57 58 59 60
For Peer Review Only
NM_023940 RAS-like, family 11, member B RASL11B 1.86 1.37 NM_004385 chondroitin sulfate proteoglycan 2 (versican) CSPG2 1.82 0.65 NM_002609 platelet-derived growth factor receptor, beta polypeptide PDGFRB 1.79 0.89 NM_052884 sialic acid binding Ig-like lectin 11 SIGLEC11 1.78 0.91
NM_004796 neurexin 3 NRXN3 1.76 0.77
NM_000887 integrin, alpha X (antigen CD11C (p150), alpha polypeptide) ITGAX 1.74 1.90 NM_020182 transmembrane, prostate androgen induced RNA TMEPAI 1.71 0.52
L12350 thrombospondin 2 THBS2 1.67 1.35
NM_002562 purinergic receptor P2X, ligand-gated ion channel, 7 P2RX7 1.66 0.86 NM_013231 fibronectin leucine rich transmembrane protein 2 FLRT2 1.65 0.83 NM_001129 AE binding protein 1 AEBP1 1.65 0.95 NM_032457 BH-protocadherin (brain-heart) PCDH7 1.56 0.57 NM_013231 fibronectin leucine rich transmembrane protein 2 FLRT2 1.56 0.91 NM_021110 collagen, type XIV, alpha 1 (undulin) COL14A1 1.56 0.86 NM_004933 cadherin 15, M-cadherin (myotubule) CDH15 1.51 1.26 NM_005849 immunoglobulin superfamily, member 6 IGSF6 1.44 0.83 NM_004172 solute carrier family 1 (glial high affinity glutamate
transporter), member 3
SLC1A3 1.36 0.96
NM_000867 5-hydroxytryptamine (serotonin) receptor 2B HTR2B 1.35 1.18 NM_001953 endothelial cell growth factor 1 (platelet-derived) ECGF1 1.26 0.75 NM_001295 chemokine (C-C motif) receptor 1 CCR1 1.25 0.77 NM_003247 thrombospondin 2 THBS2 1.17 0.99 NM_000095 cartilage oligomeric matrix protein COMP 1.16 2.02 NM_002589 BH-protocadherin (brain-heart) PCDH7 1.09 1.37 NM_012445 spondin 2, extracellular matrix protein SPON2 1.08 1.03 NM_002314 LIM domain kinase 1 LIMK1 5.28 7.53 NM_012431 sema domain, immunoglobulin domain (Ig), short basic
domain, secreted, (semaphorin) 3E
SEMA3E 2.60 1.43
NM_001144 autocrine motility factor receptor AMFR 1.96 1.00 NM_001138 agouti related protein homolog (mouse) AGRP 1.92 1.30 NM_033181 cannabinoid receptor 1 (brain) CNR1 1.52 1.14 NM_006274 chemokine (C-C motif) ligand 19 CCL19 4.12 5.72 NM_013402 fatty acid desaturase 1 FADS1 3.42 1.29 NM_000440 phosphodiesterase 6A, cGMP-specific, rod, alpha PDE6A 2.76 1.16 NM_006419 chemokine (C-X-C motif) ligand 13 (B-cell chemoattractant) CXCL13 2.49 3.24 Response to stimulus NM_000608 orosomucoid 2 ORM2 2.36 1.58 3 4 5 6 7 8 9 10 11 12 13 14 15 16 17 18 19 20 21 22 23 24 25 26 27 28 29 30 31 32 33 34 35 36 37 38 39 40 41 42 43 44 45 46 47 48 49 50 51 52 53 54 55 56 57 58 59 60
For Peer Review Only
NM_000607 orosomucoid 1 ORM1 2.33 1.91
BC034271 Fanconi anemia, complementation group C FANCC 2.33 0.47
NM_005143 haptoglobin HP 2.30 0.54
NM_000104 cytochrome P450, family 1, subfamily B, polypeptide 1 CYP1B1 2.22 2.77 NM_006107 cisplatin resistance-associated overexpressed protein CROP 2.21 0.63 NM_133631 roundabout, axon guidance receptor, homolog 1
(Drosophila)
ROBO1 2.15 0.46
NM_148968 tumor necrosis factor receptor superfamily, member 25 TNFRSF25 2.13 0.50 NM_000582 secreted phosphoprotein 1 (osteopontin, bone sialoprotein
I, early T-lymphocyte activation 1)
SPP1 2.11 1.79
NM_001770 CD19 antigen CD19 2.05 0.90
AK128423 cold inducible RNA binding protein CIRBP 2.03 1.20 NM_000821 gamma-glutamyl carboxylase GGCX 1.98 0.31 NM_007237 SP140 nuclear body protein SP140 1.88 0.45 NM_000647 chemokine (C-C motif) receptor 2 CCR2 1.87 0.70 NM_018242 hypothetical protein FLJ10847 FLJ10847 1.87 0.48 NM_183040 dystrobrevin binding protein 1 DTNBP1 1.84 0.53 BC009496,
XM_056455
Melanoma associated gene D2S448 1.81 0.57
NM_000397 cytochrome b-245, beta polypeptide (chronic granulomatous disease)
CYBB 1.56 0.73
NM_005849 immunoglobulin superfamily, member 6 IGSF6 1.44 0.83 NM_001953 endothelial cell growth factor 1 (platelet-derived) ECGF1 1.26 0.75 NM_001295 chemokine (C-C motif) receptor 1 CCR1 1.25 0.77 NM_006569 cell growth regulator with EF hand domain 1 CGREF1 1.18 1.10 NM_012445 spondin 2, extracellular matrix protein SPON2 1.08 1.03
NM_002345 lumican LUM 1.07 0.77
NM_032966 Burkitt lymphoma receptor 1, GTP binding protein (chemokine (C-X-C motif) receptor 5)
BLR1 2.18 2.66
NM_000582 secreted phosphoprotein 1 (osteopontin, bone sialoprotein I, early T-lymphocyte activation 1)
SPP1 2.11 1.79
NM_000426 laminin, alpha 2 (merosin, congenital muscular dystrophy) LAMA2 2.08 0.87
3 4 5 6 7 8 9 10 11 12 13 14 15 16 17 18 19 20 21 22 23 24 25 26 27 28 29 30 31 32 33 34 35 36 37 38 39 40 41 42 43 44 45 46 47 48 49 50 51 52 53 54 55 56 57 58 59 60
For Peer Review Only
Supplementary Table 1B: Down-regulated genes associated with the primary spontaneous pneumothorax (S.D., standard deviation)
Category Gene ID Description
Gene symbol Expression Fold S.D. NM_0010036 83
phosphodiesterase 1A, calmodulin-dependent PDE1A 0.80 0.80
NM_000728 calcitonin-related polypeptide, beta CALCB 0.76 0.56 NM_005248 Gardner-Rasheed feline sarcoma viral (v-fgr) oncogene
homolog
FGR 0.72 0.39
NM_002436 membrane protein, palmitoylated 1, 55kDa MPP1 0.63 0.20 NM_005613 regulator of G-protein signalling 4 RGS4 0.62 0.38 NM_005856 receptor (calcitonin) activity modifying protein 3 RAMP3 0.61 0.27 NM_053064 guanine nucleotide binding protein (G protein), gamma 2 GNG2 0.60 0.23
NM_000560 CD53 antigen CD53 0.59 0.18
NM_152852 membrane-spanning 4-domains, subfamily A, member 6A MS4A6A 0.59 0.16 NM_198148 carboxypeptidase X (M14 family), member 2 CPXM2 0.59 0.37 NM_025216 wingless-type MMTV integration site family, member 10A WNT10A 0.58 0.17 NM_016184 C-type lectin domain family 4, member A CLEC4A 0.58 0.11 NM_005739 RAS guanyl releasing protein 1 (calcium and DAG-regulated) RASGRP1 0.58 0.18 NM_002616 period homolog 1 (Drosophila) PER1 0.57 0.15 AK131525 phosphodiesterase 2A, cGMP-stimulated PDE2A 0.56 0.15 NM_002843 protein tyrosine phosphatase, receptor type, J PTPRJ 0.56 0.16 NM_004004 gap junction protein, beta 2, 26kDa (connexin 26) GJB2 0.56 1.36 NM_175738 RAB37, member RAS oncogene family RAB37 0.56 0.13 NM_005737 ADP-ribosylation factor-like 7 ARL7 0.56 0.20 NM_021248 cadherin-like 22 CDH22 0.56 0.12 NM_000073 CD3G antigen, gamma polypeptide (TiT3 complex) CD3G 0.55 0.38 NM_004001 Fc fragment of IgG, low affinity IIb, receptor (CD32) FCGR2B 0.55 0.29
NM_198196 CD96 antigen CD96 0.54 0.14
NM_006142 stratifin SFN 0.54 0.25
NM_000732 CD3D antigen, delta polypeptide (TiT3 complex) CD3D 0.53 0.20 NM_139266 signal transducer and activator of transcription 1, 91kDa STAT1 0.53 0.16
NM_000591 CD14 antigen CD14 0.53 0.23
NM_000677 adenosine A3 receptor ADORA3 0.53 0.24 Cell
communication
NM_058175 collagen, type VI, alpha 2 COL6A2 0.52 0.18
3 4 5 6 7 8 9 10 11 12 13 14 15 16 17 18 19 20 21 22 23 24 25 26 27 28 29 30 31 32 33 34 35 36 37 38 39 40 41 42 43 44 45 46 47 48 49 50 51 52 53 54 55 56 57 58 59 60
For Peer Review Only
NM_000417 interleukin 2 receptor, alpha IL2RA 0.52 0.22 NM_000265 neutrophil cytosolic factor 1 (47kDa, chronic granulomatous
disease, autosomal 1) NCF1 0.52 0.46 NM_000729 cholecystokinin CCK 0.52 0.21 NM_002087 granulin GRN 0.52 0.09 NM_001937 dermatopontin DPT 0.52 0.33 NM_007126 valosin-containing protein VCP 0.52 0.12 NM_002005 feline sarcoma oncogene FES 0.51 0.17 NM_006072 chemokine (C-C motif) ligand 26 CCL26 0.51 0.34 NM_001882 corticotropin releasing hormone binding protein CRHBP 0.50 0.21 NM_001721 BMX non-receptor tyrosine kinase BMX 0.50 0.16 NM_000265 neutrophil cytosolic factor 1 (47kDa, chronic granulomatous
disease, autosomal 1)
NCF1 0.49 0.47
NM_002416 chemokine (C-X-C motif) ligand 9 CXCL9 0.48 0.43 NM_005248 Gardner-Rasheed feline sarcoma viral (v-fgr) oncogene
homolog
FGR 0.48 0.38
NM_004895 cold autoinflammatory syndrome 1 CIAS1 0.48 0.13 NM_002985 chemokine (C-C motif) ligand 5 CCL5 0.47 0.12 NM_004887 chemokine (C-X-C motif) ligand 14 CXCL14 0.47 0.57 NM_002986 chemokine (C-C motif) ligand 11 CCL11 0.46 0.10 NM_182664 Ras association (RalGDS/AF-6) domain family 5 RASSF5 0.45 0.11 NM_001736 complement component 5 receptor 1 (C5a ligand) C5R1 0.45 0.21 NM_022349 membrane-spanning 4-domains, subfamily A, member 6A MS4A6A 0.44 0.15 NM_197954 C-type lectin domain family 7, member A CLEC7A 0.43 0.14 NM_002029 formyl peptide receptor 1 FPR1 0.43 0.14 NM_003239 transforming growth factor, beta 3 TGFB3 0.41 0.22 NM_139013 mitogen-activated protein kinase 14 MAPK14 0.41 0.08 NM_003881 WNT1 inducible signaling pathway protein 2 WISP2 0.41 0.26 NM_003841 tumor necrosis factor receptor superfamily, member 10c,
decoy without an intracellular domain
TNFRSF10C 0.41 0.14
NM_016084 RAS, dexamethasone-induced 1 RASD1 0.40 0.21 NM_006564 chemokine (C-X-C motif) receptor 6 CXCR6 0.40 0.15 NM_003014 secreted frizzled-related protein 4 SFRP4 0.39 0.71 NM_0010053
77
plasminogen activator, urokinase receptor PLAUR 0.38 0.10
NM_001078 vascular cell adhesion molecule 1 VCAM1 0.38 0.28
3 4 5 6 7 8 9 10 11 12 13 14 15 16 17 18 19 20 21 22 23 24 25 26 27 28 29 30 31 32 33 34 35 36 37 38 39 40 41 42 43 44 45 46 47 48 49 50 51 52 53 54 55 56 57 58 59 60
For Peer Review Only
NM_004067 chimerin (chimaerin) 2 CHN2 0.37 0.14 NM_014999 RAB21, member RAS oncogene family RAB21 0.36 0.06 NM_006840 leukocyte immunoglobulin-like receptor, subfamily B (with
TM and ITIM domains), member 5
LILRB5 0.36 0.26
NM_016084 RAS, dexamethasone-induced 1 RASD1 0.36 0.25 NM_000609 chemokine (C-X-C motif) ligand 12 (stromal cell-derived
factor 1)
CXCL12 0.36 0.29
NM_002036 Duffy blood group FY 0.35 0.09
NM_000631 neutrophil cytosolic factor 4, 40kDa NCF4 0.33 0.09 NM_003853 interleukin 18 receptor accessory protein IL18RAP 0.32 0.07 NM_003012 secreted frizzled-related protein 1 SFRP1 0.31 0.26 NM_002984 chemokine (C-C motif) ligand 4 CCL4 0.31 0.15 NM_001776 ectonucleoside triphosphate diphosphohydrolase 1 ENTPD1 0.30 0.08 NM_000576 interleukin 1, beta IL1B 0.29 0.13 NM_016388 T cell receptor interacting molecule TCRIM 0.29 0.11
NM_000619 interferon, gamma IFNG 0.28 0.08
NM_004951 Epstein-Barr virus induced gene 2 (lymphocyte-specific G protein-coupled receptor)
EBI2 0.26 0.08
NM_002927 regulator of G-protein signalling 13 RGS13 0.23 0.20 NM_016232 interleukin 1 receptor-like 1 IL1RL1 0.23 0.32 NM_000710 bradykinin receptor B1 BDKRB1 0.22 0.10 NM_004591 chemokine (C-C motif) ligand 20 CCL20 0.22 0.09
NM_001937 dermatopontin DPT 0.21 0.13
NM_000230 leptin (obesity homolog, mouse) LEP 0.21 0.07
NM_020530 oncostatin M OSM 0.21 0.06
NM_006273 chemokine (C-C motif) ligand 7 CCL7 0.21 0.19 NM_006564 chemokine (C-X-C motif) receptor 6 CXCR6 0.19 0.06 NM_005408 chemokine (C-C motif) ligand 13 CCL13 0.19 0.09 NM_005408 chemokine (C-C motif) ligand 13 CCL13 0.18 0.07 NM_153615 Ral-GDS related protein Rgr RGR 0.17 0.06 NM_002178 insulin-like growth factor binding protein 6 IGFBP6 0.17 0.09 NM_002965 S100 calcium binding protein A9 (calgranulin B) S100A9 0.16 0.07 NM_000655 selectin L (lymphocyte adhesion molecule 1) SELL 0.11 0.03
NM_000584 interleukin 8 IL8 0.04 0.01
Response to stimulus
NM_006864 leukocyte immunoglobulin-like receptor, subfamily B (with TM and ITIM domains), member 3
LILRB3 0.88 0.70 3 4 5 6 7 8 9 10 11 12 13 14 15 16 17 18 19 20 21 22 23 24 25 26 27 28 29 30 31 32 33 34 35 36 37 38 39 40 41 42 43 44 45 46 47 48 49 50 51 52 53 54 55 56 57 58 59 60
For Peer Review Only
NM_005084 phospholipase A2, group VII (platelet-activating factor acetylhydrolase, plasma)
PLA2G7 0.78 0.92
NM_005248 Gardner-Rasheed feline sarcoma viral (v-fgr) oncogene homolog
FGR 0.72 0.39
NM_052942 guanylate binding protein 5 GBP5 0.67 0.34 NM_172369 complement component 1, q subcomponent, gamma
polypeptide
C1QG 0.61 0.21
BC034142 immunoglobulin kappa variable 1-5 IGKV1-5 0.60 0.31
NM_000560 CD53 antigen CD53 0.59 0.18
NM_003465 chitinase 1 (chitotriosidase) CHIT1 0.59 0.80 NM_002000 Fc fragment of IgA, receptor for FCAR 0.59 0.22 NM_016184 C-type lectin domain family 4, member A CLEC4A 0.58 0.11 BC063385 T cell receptor alpha locus TRA@ 0.57 0.17 NM_006272 S100 calcium binding protein, beta (neural) S100B 0.55 0.22
NM_006398 ubiquitin D UBD 0.55 0.39
NM_005516 major histocompatibility complex, class I, E HLA-E 0.55 0.15 NM_004001 Fc fragment of IgG, low affinity IIb, receptor (CD32) FCGR2B 0.55 0.29
NM_198196 CD96 antigen CD96 0.54 0.14
NM_006110 CD2 antigen (cytoplasmic tail) binding protein 2 CD2BP2 0.53 0.09 NM_004159 proteasome (prosome, macropain) subunit, beta type, 8
(large multifunctional protease 7)
PSMB8 0.53 0.10
NM_139266 signal transducer and activator of transcription 1, 91kDa STAT1 0.53 0.16
NM_000591 CD14 antigen CD14 0.53 0.23
NM_000677 adenosine A3 receptor ADORA3 0.53 0.24 NM_000417 interleukin 2 receptor, alpha IL2RA 0.52 0.22 NM_000265 neutrophil cytosolic factor 1 (47kDa, chronic granulomatous
disease, autosomal 1)
NCF1 0.52 0.46
NM_005514 major histocompatibility complex, class I, B HLA-B 0.52 0.09 NM_007126 valosin-containing protein VCP 0.52 0.12 NM_006072 chemokine (C-C motif) ligand 26 CCL26 0.51 0.34 BC073764 immunoglobulin kappa constant IGKC 0.50 0.26 NM_001637 acyloxyacyl hydrolase (neutrophil) AOAH 0.50 0.11 NM_006866 leukocyte immunoglobulin-like receptor, subfamily A (with
TM domain), member 2
LILRA2 0.49 0.15
NM_182549 major histocompatibility complex, class II, DQ beta 2 HLA-DQB2 0.49 0.13 NM_020992 PDZ and LIM domain 1 (elfin) PDLIM1 0.49 0.08
3 4 5 6 7 8 9 10 11 12 13 14 15 16 17 18 19 20 21 22 23 24 25 26 27 28 29 30 31 32 33 34 35 36 37 38 39 40 41 42 43 44 45 46 47 48 49 50 51 52 53 54 55 56 57 58 59 60
For Peer Review Only
NM_000265 neutrophil cytosolic factor 1 (47kDa, chronic granulomatous disease, autosomal 1)
NCF1 0.49 0.47
NM_002416 chemokine (C-X-C motif) ligand 9 CXCL9 0.48 0.43 NM_005248 Gardner-Rasheed feline sarcoma viral (v-fgr) oncogene
homolog
FGR 0.48 0.38
NM_004895 cold autoinflammatory syndrome 1 CIAS1 0.48 0.13 NM_006144 granzyme A (granzyme 1, cytotoxic T-lymphocyte-associated
serine esterase 3)
GZMA 0.47 0.16
NM_002985 chemokine (C-C motif) ligand 5 CCL5 0.47 0.12 NM_001778 CD48 antigen (B-cell membrane protein) CD48 0.47 0.19 NM_000636 superoxide dismutase 2, mitochondrial SOD2 0.47 0.28 NM_004887 chemokine (C-X-C motif) ligand 14 CXCL14 0.47 0.57 NM_006399 basic leucine zipper transcription factor, ATF-like BATF 0.46 0.24 BX161420 immunoglobulin heavy constant mu IGHM 0.46 0.12 NM_003650 cystatin F (leukocystatin) CST7 0.46 0.09 NM_002800 proteasome (prosome, macropain) subunit, beta type, 9
(large multifunctional protease 2)
PSMB9 0.46 0.12
NM_005041 perforin 1 (pore forming protein) PRF1 0.46 0.27 NM_002986 chemokine (C-C motif) ligand 11 CCL11 0.46 0.10 NM_006037 histone deacetylase 4 HDAC4 0.45 0.16 NM_001736 complement component 5 receptor 1 (C5a ligand) C5R1 0.45 0.21 NM_197954 C-type lectin domain family 7, member A CLEC7A 0.43 0.14 NM_021139 UDP glycosyltransferase 2 family, polypeptide B4 UGT2B4 0.43 0.50 NM_002029 formyl peptide receptor 1 FPR1 0.43 0.14 NM_000716 complement component 4 binding protein, beta C4BPB 0.43 0.22 NM_002621 properdin P factor, complement PFC 0.43 0.09 NM_000239 lysozyme (renal amyloidosis) LYZ 0.43 0.25 NM_001140 arachidonate 15-lipoxygenase ALOX15 0.42 0.26 M20432 major histocompatibility complex, class II, DQ beta 1 HLA-DQB1 0.41 0.21 NM_139013 mitogen-activated protein kinase 14 MAPK14 0.41 0.08 NM_0010043
49
FLJ45422 protein FLJ45422 0.39 0.16
NM_002934 ribonuclease, RNase A family, 2 (liver, eosinophil-derived neurotoxin)
RNASE2 0.39 0.14
NM_000129 coagulation factor XIII, A1 polypeptide F13A1 0.39 0.28 NM_003226 trefoil factor 3 (intestinal) TFF3 0.38 0.16
3 4 5 6 7 8 9 10 11 12 13 14 15 16 17 18 19 20 21 22 23 24 25 26 27 28 29 30 31 32 33 34 35 36 37 38 39 40 41 42 43 44 45 46 47 48 49 50 51 52 53 54 55 56 57 58 59 60
For Peer Review Only
NM_0010053 77
plasminogen activator, urokinase receptor PLAUR 0.38 0.10
NM_000331 serum amyloid A1 SAA1 0.36 0.38
NM_006840 leukocyte immunoglobulin-like receptor, subfamily B (with TM and ITIM domains), member 5
LILRB5 0.36 0.26
NM_000609 chemokine (C-X-C motif) ligand 12 (stromal cell-derived factor 1)
CXCL12 0.36 0.29
NM_001911 cathepsin G CTSG 0.35 0.24
NM_021822 apolipoprotein B mRNA editing enzyme, catalytic polypeptide-like 3G
APOBEC3G 0.35 0.08
NM_001453 forkhead box C1 FOXC1 0.34 0.13
NM_000631 neutrophil cytosolic factor 4, 40kDa NCF4 0.33 0.09 NM_003853 interleukin 18 receptor accessory protein IL18RAP 0.32 0.07 NM_005384 nuclear factor, interleukin 3 regulated NFIL3 0.32 0.12 NM_002984 chemokine (C-C motif) ligand 4 CCL4 0.31 0.15 NM_001776 ectonucleoside triphosphate diphosphohydrolase 1 ENTPD1 0.30 0.08 NM_000576 interleukin 1, beta IL1B 0.29 0.13 NM_021139 UDP glycosyltransferase 2 family, polypeptide B4 UGT2B4 0.29 0.36 NM_016388 T cell receptor interacting molecule TCRIM 0.29 0.11 NM_000619 interferon, gamma IFNG 0.28 0.08 NM_004951 Epstein-Barr virus induced gene 2 (lymphocyte-specific G
protein-coupled receptor)
EBI2 0.26 0.08
NM_000710 bradykinin receptor B1 BDKRB1 0.22 0.10 NM_004591 chemokine (C-C motif) ligand 20 CCL20 0.22 0.09 NM_004633 interleukin 1 receptor, type II IL1R2 0.22 0.13
NM_020530 oncostatin M OSM 0.21 0.06
NM_006273 chemokine (C-C motif) ligand 7 CCL7 0.21 0.19 NM_005408 chemokine (C-C motif) ligand 13 CCL13 0.19 0.09 NM_002704 pro-platelet basic protein (chemokine (C-X-C motif) ligand 7) PPBP 0.17 0.12 NM_002965 S100 calcium binding protein A9 (calgranulin B) S100A9 0.16 0.07 NM_144673 chemokine-like factor super family 2 CKLFSF2 0.14 0.07 NM_004633 interleukin 1 receptor, type II IL1R2 0.13 0.03 NM_005621 S100 calcium binding protein A12 (calgranulin C) S100A12 0.09 0.05
NM_000600 interleukin 6 (interferon, beta 2) IL6 0.06 0.02
NM_006289 talin 1 TLN1 0.58 0.11
Cell motility
NM_002985 chemokine (C-C motif) ligand 5 CCL5 0.47 0.12
3 4 5 6 7 8 9 10 11 12 13 14 15 16 17 18 19 20 21 22 23 24 25 26 27 28 29 30 31 32 33 34 35 36 37 38 39 40 41 42 43 44 45 46 47 48 49 50 51 52 53 54 55 56 57 58 59 60
For Peer Review Only
NM_002029 formyl peptide receptor 1 FPR1 0.43 0.14 NM_007074 coronin, actin binding protein, 1A CORO1A 0.42 0.15 NM_139013 mitogen-activated protein kinase 14 MAPK14 0.41 0.08 NM_002984 chemokine (C-C motif) ligand 4 CCL4 0.31 0.15 NM_006135 capping protein (actin filament) muscle Z-line, alpha 1 CAPZA1 0.30 0.14 NM_000619 interferon, gamma IFNG 0.28 0.08
NM_004665 vanin 2 VNN2 0.16 0.04
NM_000655 selectin L (lymphocyte adhesion molecule 1) SELL 0.11 0.03
3 4 5 6 7 8 9 10 11 12 13 14 15 16 17 18 19 20 21 22 23 24 25 26 27 28 29 30 31 32 33 34 35 36 37 38 39 40 41 42 43 44 45 46 47 48 49 50 51 52 53 54 55 56 57 58 59 60