Direct Fingerprint Classification in Raw Fingerprint Images by Using Principal Gabor Basis Functions
5
0
0
全文
(2) 2: GABOR BASIS FUNCTIONS AND FINGERPRINT IMAGES Gabor filters, simulating visual vertex cells, have the properties of spatial localization, orientation selectivity, and spatial-frequency selectivity. Therefore, we will apply Gabor filters to detect a particular local ridge orientation (LRO) and local ridge frequency (LRF) of a local fingerprint image.. 2.1: GABOR BASIS FUNCTIONS (GBFS) The two-dimensional (2-D) complete set of GBFs can be expressed as [10]: G pqrs ( x, y ) exp{[( x p ) 2 ( y q) 2 ] / 2 } exp[2j ( xr ys) / N f ]. where. j 1. ,. p, q 0,1,, N s 1. (1) ,. and. r , s N f / 2 1, N f / 2 2, , 1,0,1, , N f / 2 1, N f / 2. .. r -7 -6 -5 -4 -3 -2 -1 0 1 2 3 4 5 6 7 8 -7 -6 -5 -4 -3 -2 -1 s 0 1 2 3 4 5 6 7 8. Fig. 3. The real components of the complete GBFs.. In the spatial domain, Ns is the number of spatial samples, (p,q) is the spatial window center, and decides the extent of spatial windows. In the spatial-frequency domain, Nf is the number of spatial-frequency samples and (r,s) is the location of the frequency center. The angle and radial frequency f of GBF are determined by 2 2 tan 1 ( s / r ) and s / N f r / N f , respectively. Their. (a). relationship on the spatial-frequency plane is demonstrated in Fig. 2. In Equation 1, we set the number of spatial samples, the number of spatial-frequency samples, and the extents of spatial windows along x and y axes as the same values for simplification. In the spatial domain, the real components of these basis functions for Ns = Nf = 16 are shown in Fig. 3. From Fig. 3, the orientation-selective properties of the GBFs are obvious. In the spatial-frequency domain, each real GBF (except r = s = 0) has twin Gaussian peaks. The envelope of Gaussian function, which is proportional to the reciprocal of , determines the channel bandwidths. In fact, each real GBF has twin Gaussian peaks at its frequency center (r,s). The complete GBFs spread Nf Nf Gaussian peaks on the spatial-frequency plane. They only respond to the image with the same orientation and radial frequency as narrowband filters.. (b). Fig. 4. (a) Original images and (b) responses of GBFs for various LROs.. (a). (b). Fig. 5. (a) Original images and (b) responses of GBFs for various LRFs. The Gabor response g of each GBF corresponding (r,s) is defined as follows: Ns Ns. g (r , s) I ( x, y )G pqrs ( x, y ) p. Fig. 2. Parameters of GBF on the spatial-frequency plane.. (2). q. where I is an Ns Ns input image. To demonstrate the relationship between GBFs and fingerprint images, some local fingerprint images with various LROs and LRFs are shown in Figs. 4(a) and 5(a), respectively. Figs. 4(b) and 5(b) show the corresponding Gabor responses from Figs. 4(a) and 5(a). From Figs. 4(b) and 5(b), the Gabor responses also have twin peaks, and the corresponding locations are similar to their Gabor coefficients. This means that the two corresponding. - 976 -.
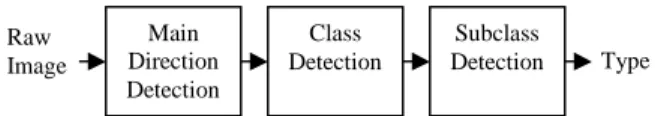
(3) GBFs (in fact, they are the same) have the largest responses to the local fingerprint image. Moreover, the orientation and spatial-frequency of the corresponding GBF can represent mainly the local region because the image energy concentrates at its frequency. In other words, using only one GBF can easily capture the main characteristics of a local fingerprint image. We name it as the principal GBF (PBGF) of the local region which is defined by (3) gM max[g(r, s)] Because the PGBF can exactly capture the LRO and LRF of a local ridge structures, the dimension of a local fingerprint image is reduced from pixels to only one GBF. A GBF, determined by (r,s), can also be reduced to an index of the complete GBFs. If a local region has 1616 pixels, for example, then there are 256 GBFs and the index of the PGBF needs only one byte. That is, the input feature vectors are reduced by a factor of 256.. 2.2: PGBF TEMPLATE Owing to the distribution of Gabor responses over the complete GBFs is similar to Gaussian distribution, larger response means the ridge structure is more similar to the corresponding PGBF. Therefore, we can distinguish the similarities of ridge structures according to the corresponding responses. After extracting the PGBFs of a whole fingerprint image, the image is viewed as the template of a group of LROs and LRFs, named PGBFs template. The second column of Fig. 6 shows the real components of the PGBFs template for non-overlapping sampling. To judge the similarity between the test image and the training pattern, we sample the test image directly from gray-scale by using the PGBF template of the training pattern. If the test image is similar to the training pattern, their responses of all sampling points are very close to each other. There is not necessary to extract PGBF for the test image. In Fig. 6, the third column shows the responses from self-PGBF template and the fourth from another. Their PGBF responses are very different.. N. Ns Ns. R N I i ( x, y ) g M i ( x, y ) i. p. (4). q. where N is the number of the regions of interest.. 3: CLASSIFIER DESIGN As described in Section 2, we use a group of PGBF to form a particular ridge structures, then we can judge whether the raw fingerprint image contain the particular ridge structures. If the response is large, then the answer is yes. Therefore, we can avoid many pixel-level computations for orientation calculations. Based on the above advantages, we will use a group of PGBF to form a particular class of fingerprint. Because every class has more than three subclasses, however, there are at least 15 possibilities of PGBF templates to represent the five classes of fingerprint. If a raw fingerprint image needs to compare all candidate PGBF templates, then the computational cost is high. So we develop a hierarchical structure to detect the corresponding class. The proposed approach is shown in Fig. 7. There are three layers filters. The PGBF templates of the first layer detect the main direction below core point. There are four directions which are 00, 450, 900, and 1350. They are shown in Fig. 8. After the detection for the main direction of core region, the PGBF templates of the second layer are applied to detect the belonging class according to the direction of the first layer. If the main direction of the pattern is 00, then there are two PGBF templates, shown in Fig. 8(a), to detect its corresponding class. The two PGBF templates are the classifiers of whorl and arch. If the main directions of the pattern are 450, 900, and 1350, then there are four PGBF templates, shown in Figs. 8(a), 8(b), and 8(c), respectively. That is, there are at most four PGBF templates corresponding to each direction. The other PGBF templates need not to check. Raw Image. Main Direction Detection. Class Detection. Subclass Detection. Type. Fig. 7. The proposed approach. Unfortunately, some left whorl and right whorl patterns might be classified into left loop or right loop. In the third layer, therefore, we use the PGBFs with 450 and 1350, shown in Fig. 10, to detect right whorl and left whorl, respectively. Fig. 6. From left to right: fingerprint images, PGBFs templates, Gabor responses from self-PGBFs template, and Gabor responses from another PGBFs template. At last, the response of the PGBF template is defined by. - 977 -. (a) (b) (c) (d) Fig. 8. The first layer PGBF templates..
(4) (a). Fig. 13. Some incorrect classification.. (b). 4: EXPERIMENTAL RESULTS (c). (d) Fig. 9. The second layer PGBF templates connected to Fig. 8.. (a) (b) Fig. 10. The third layer PGBF templates.. We use NIST Special Database 4 to test our approach [10]. The databases contain 4000 fingerprint images from 2000 fingers with 2 impressions. These images are scanned at about 500 dpi. In fact, the images sampled at 200~300 dpi is enough for extracting the LRO and LRF of a local fingerprint image. Therefore, we resample these images at 250 dpi. Not only memory space is reduced, but also the processing time is speeded up. Fig. 11 shows five patterns belonging to five types, respectively. The values of each layer are shown in Table 1. These patterns are classified correctly. Fig. 12 shows some rotated patterns. They are also classified correctly. But some patterns are classified incorrectly. They are shown in Fig. 13.. 5: CONCLUSIONS RESEARCH (a). (b). (c). (d) (e) Fig. 11. Five types of fingerprints for test.. Fig. 12. Correct classification for rotated fingerprints.. Fig 11 (a) (b) (c) (d) (e). 450 2035 3419 687 1423 3591. AND. FURTHER. We have developed a fast algorithm to detect the classes of fingerprint patterns directly from gray-level images without preprocessing and other pixel-level computations. Based on the property that the Gabor filters only have large response with similar orientation and spatial-frequency, the ridge structures of core regions form a PGBF template. Observing the ridge structures of each class, we design a three-layer class detector. Therefore, the proposed method can directly detect core points from gray-scale images, and then faster than other pixel-level computation approach. For fingerprint classification, conventionally, it is necessary to detect all singular points, including core points and delta points. In fact, the ridge structures of core regions can provide some clues for classification even though the delta points do not appear. Testing with public fingerprint databases, such as the databases from NIST Special Database 4 and 14, is a very important task to show the ability of the proposed approach. We will use the some famous criteria to evaluate the performance of the Gabor filter-based approach.. Table 1. The results of Fig. 11. 1st layer 2nd layer 900 1350 00 A T L R 1914 2672 5906 37667 1164 792 709 13505 3690 19935 1311 5138 748 15540 10021 22468 2590 2355 1085 20331 13539 10665 1069 2744 2170 7206 9365 10050. - 978 -. Class W 5670 13804 16645 7599 16262. A L R T W.
(5) REFERENCES 1. Rao, K., Balck, K.: Type Classification of Fingerprints: A Syntactic Approach. IEEE Trans. Pattern Analysis Machine Intelligent, Vol. 2, No. 3. (1980) 302-314 2. Kawagoe, M., Tojo, A.: Fingerprint Pattern Classification. Pattern Recognition, Vol. 17, No. 3, (1984) 295-303 3. Wilson, C.L., Candela, G.T., Watson, C.I.: Neural-Network Fingerprint Classification. Journal of Artificial Neural Networks, Vol. 1, No. 2. (1994) 203-228 4. Karu, K., Jain, A.K.: Fingerprint Classification. Pattern Recognition, Vol. 29, No. 3. (1996) 389-404 5. Jain, A.K., Prabhakar, S., Hong, L.: A Multichannel Approach to Fingerprint Classification. IEEE Trans. Pattern Analysis and Machine Intelligent, Vol. 21, No. 4. (1999) 348-359 6. Cappelli, R., Lumini, A., Maio, D., Maltoni, D.: Fingerprint Classification by Directional Image Partitioning. IEEE Trans. Pattern Analysis and Machine Intelligence, Vol. 21, No. 5. (1999) 402 –421 7. Park, C.H., Park, H.: Fingerprint Classification Using Fast Fourier Transform and Nonlinear Discriminant Analysis. Pattern Recognition, Vol. 38, No. 4. (2005) 495-503 8. Park, C.H., Lee, J.J., Smith, M. J.T., Park, K.H.: Singular Point Detection by Shape Analysis of Directional Fields in Fingerprints. Pattern Recognition, Vol. 39, No. 5. (2006) 839-855 9. Daugman, J.G.: Uncertainty Relation for Resolution in Space, Spatial Frequency, and Orientation Optimized by Two-Dimensional Visual Cortical Filters. J. Opt. Soc. Amer. A, Vol. 2, No. 7. (1985) 1160-1169 10.Lee, C.J., Wang, S.D.: Fingerprint Feature Reduction by Gabor Basis Function, Pattern Recognition, Vol. 34, No. 11. (2001) 2245-2248 11.Lee, C.J., Wang, S.D., Wu, K.P.: Fingerprint Recognition Using the Responses of Principal Gabor Basis Functions. Proceedings of Third International Conference on Information, Communications & Signal (2001) 12.Lee, C.J., Wu, K.P.: Fast Core Point Detection in Raw Fingerprint Image. Proceedings of the 17th Conference of Computer Vision, Graphics, and Image Processing (2004) 13.Watson, C.I., Wilson, C.L.: NIST Special Database 4, Fingerprint Database. U.S. National Institute of Standards and Technology (1992). - 979 -.
(6)
數據


相關文件
² Stable kernel in a goals hierarchy is used as a basis for establishing the architecture; Goals are organized to form several alternatives based on the types of goals and
Chou, “The Application on Investigation of Rice Field Using the High Frequency and High Resolution Satellite Images (1/3)”, Agriculture and Food Agency, 2005. Lei, “The Application
Then they work in groups of four to design a questionnaire on diets and eating habits based on the information they have collected from the internet and in Part A, and with
Students are asked to collect information (including materials from books, pamphlet from Environmental Protection Department...etc.) of the possible effects of pollution on our
A study on the spatial orientation ability for sixth grader students of elementary school― using three-dimensional views (Unpublished master’s thesis). National
- we can put photoresist on a wafer and then selectively expose regions to UV - then we can soak the entire thing in acid and only the parts of the photoresist that.. were exposed to
4: Damage (in Bytes) caused by 200-second large flows at different average flow rate R atk (in Byte/s) and duty cycle θ = 1.0 (flat large flows) under de- tection of different
By integrating data from a variety of government and commercial sources, we discovered 19,397 potential new commercial properties to inspect, based on the property usage types that
