Energy Management System for Convenience Stores
Wen-Hsiang Tseng, Cheng-Ting Lin, Chun-Yu Chen
Energy and Environmental laboratory, Industrial Technology research Institute
[email protected]
Abstract-
Five major chained convenience store groups in Taiwan singed a voluntary energy conservation letter of intent with the Bureau of Energy (BOE) and the Department of Commerce (DOC) of Ministry of Economic Affairs (MOEA) in 2006, and it showed that an effective energy management system for convenience store is highly targeted. Hence, this project aimed at designing an effective energy management system based on researching the energy consumption and the operation style of the convenience store. A long term investigation for power usage of convenience store was carried out within this project, and the collected data was then analyzed for the power management strategies. As the result, a low budget, specific software EMS architecture design for convenience stores was delivered.Keywords: Energy management, control strategy,
system architecture
1. Introduction
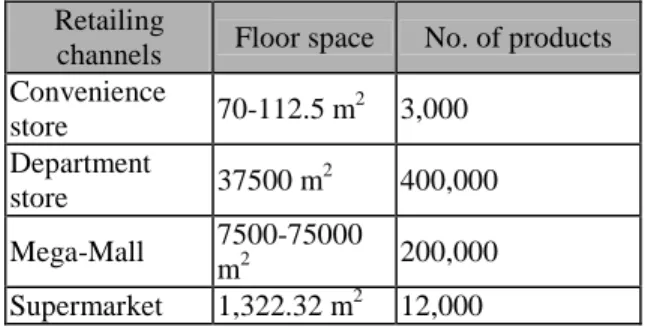
The so called retailing channels can be simply divided into four types: convenience store, supermarket, mega-mall and department stores and Table 1 shows the concepts of the retailing markets. The floor space of a convenience store is often around 75-112.5m2 and the number of products is about 3000 [1].
Table 1: The status number of different retailing channels
Retailing
channels Floor space No. of products Convenience store 70-112.5 m 2 3,000 Department store 37500 m 2 400,000 Mega-Mall 7500-75000 m2 200,000 Supermarket 1,322.32 m2 12,000
There are two major indices that can be used to define the level of energy consumption, and they
are:
1. kWh/m2.y: It generally indicates the geographic climate environment of a building, and this index means the energy consumption of a building, system operation efficiency (such as %, kW/RT, EER, COP and etc.), and size of the building. This index is often used to indicate the total power consumption of a mall, warehouse, and car park for visiting customers with the thought of operation hours. 2. W/m2: this index also represents the geographic climate environment of a building, including the energy consumption of a building skin, system operation efficiency (such as %, kW/RT, EER, COP and etc.), and size of the building. It is also be used as the index for total energy consumption of a mall, warehouse, car park for visiting customers without considering the operation hours. According to the indices mentioned above, it can be found that there does not exist a total energy consumption index, and often several indices are required for crossing examination to define the energy consumption level due to the complexity of the situation. Hence, the most popular method used in Taiwan is to sample the general indices such as kW, kWh and m2 to calculate the value of kWh/m2.y and W/m2for evaluation. In Table 2, the average values of kWh/m2.y of different retailing channels are shown, and this values for a convenience store is about 1757 kWh/m2.y.
Table 2: The average power consumption for different retailing channels
Types National wide N. Taiwan Mid. Taiwan S. Taiwan Department store 445 496 348 501 Supermarket 1097 1113 1001 1233 Convenience store 1757 1704 1865 1767 It can be found that although the floor space of a convenience store is not huge, the energy
consumption index is the highest around these channels. Hence, it was necessary to investigate the details of the power demand in a store and then find out the proper solutions to improve it.
The power demand of a convenience store can generally divided into several categories such as lighting, air conditioner, refrigerator and freezer, heating and others. In addition, the power demand of lighting is aggregated from arcade, shopping area and the preparation areas, and due to the size of the shopping space, two or three air conditioners can be installed in a store. In the part of refrigerator and freezer, several machines were used to fulfill different service conditions; hot dog machine, microwave and coffee machine are aiming at heating tasks and for rest of the devices used such as fax machine and copy machine are categorized in others. Due to the numbers and types of devices of a store, the power consumption of a convenience store can be very complicated to classify and build the model.
Before designing the EMS for convenience stores, it is essential to understand the power consumption of different devices in stores in order to find out the better operation modes for devices as well as the operation time [2]. In the following sections, an energy monitoring system aimed at collecting the power consumption and environmental information will be introduced. Afterwards, the concepts of energy saving for a convenience store will be shown. Finally, an EMS software architecture which is easy to maintain, and very little modification for the program is needed for function updating will be also introduced.
2. Energy monitoring system
Figure 1 is the architecture design of this energy monitoring system [3], and the network used between the controller and the data collectors such as sensors and digital power meters is Modbus and the physical layer used is RS485. For RS485, which is differential signaling, it has better noise resistance and the signal can be sent to a longer distance. The reasons to choose Modbus include that it is popular, fully open and many compatible products are available.
Building up the energy consumption model of a convenience store required lots of information. To achieve this, the meter reading of each device during different operation modes to be recorded, and they are also the basis for energy conversation strategies. For example, the real power consumption of a refrigerator while its fan is
working or not is different; air conditioners during different operation modes also required different power demands, and the information will then be used to profile the power consumption model [4-6]. In addition, by taking the reading of temperature and humidity sensors deployed both indoor and outdoor, the relationship between the power demand of heat exchanging devices and temperature difference can then be built.
Figure 1: the system architecture of energy management system
Here uses a real convenience store in Taipei as an example, and the power demand from different sections is shown as Figure 2. Figure3 shows the real time power consumption of a day, and it can be seen that the highest power demand appeared at 12-1PM. This is because of the use of microwave machine. In addition, as the recorded average outdoor temperature on that day was 24.6℃ and the highest temperature was 25℃, which was a comfortable temperature. Hence, the cashier shut the air conditioners off and also reduced the power demand at that time. In a store, the heating exchanging machines are constantly power consuming devices, and if proper load shedding plans can be applied, the power demand can be further reduced and the result of power saving can be achieved [7].
Figure 2: the power consumption analysis of a convenience store
A well designed energy management strategy should also take environmental conditions into
count, and it aims at maintaining the quality of the shopping space by modifying the device operation mode properly. Here uses the case mentioned above as an example. The modification of the AC operation mode should also consider the temperature and the real-time power demand. However, it might not be possible to ask cashier to check the meter and temperature sensor reading
regularly and then to modify the AC operation properly. It will be practical to code the operation rules into programs, and let the energy controller to monitor and control the power demand of a store during the regular peak hours or lots of customers rush in suddenly for effective power management. 5 10 15 20 25 00 01 02 03 04 05 06 07 08 09 10 11 12 13 14 15 16 17 18 19 20 21 22 23
(a) Total power consumption
0 2 4 6 00 02 04 06 08 10 12 14 16 18 20 22 (b) Air conditioners 0 2 4 6 8 10 00 02 04 06 08 10 12 14 16 18 20 22 (c) Chillers 0 1 2 00 02 04 06 08 10 12 14 16 18 20 22 (d) Freezer 0 2 4 6 00 02 04 06 08 10 12 14 16 18 20 22 (e) Microwave
Figure 3: the power consumption data on 2007/10/17 in the convenience store For Figure 3, it can be found that the power
consumption of several devices of a store is up and down from time to time, and it means that these devices did not require constant power. Hence, if the energy management strategies based on the found factors of power shocking could be built, a better result of demand control can then be achieved, as many devices will not operate at the same time. Another found was that the chiller of refrigerator required a lot of power,and the demands from the chillers can cause problems as it may appear at the rush hours in other stores, and if proper scheduling methods can be implemented,
the contract demands of the stores can be further cut to save the power bill.
RS-485 is a highly stable and low cost communication media, however, it also some drawbacks during system installation and the sensor connection. With the advancing of communication technologies, wireless solutions are getting popular and it is believed that in the near future the wired communication and control network will be replaced by the wireless solutions.
While developing the energy management system, a flexible architecture, which could be easy to maintain and allows function expansion
with minimum modification work, is considered as the key to market pervasion. Furthermore, the quality of control strategy will not only affect the uniformity and shocking scale of power demand, but also influence the comfortableness of the shopping space. Although stores of a same chained group have similar business model, the characteristics of power demand can still be affected by locations and operation styles. It can be concluded that the development of energy management strategy should be carried out from two aspects: the first one is the common properties and the second one is the unique characteristics. The first issues aimed at covering the requirement from most stores, such as demand control strategies, and the second issue was to fulfill some specific objects for special stores. This is the reason why the function expansion mechanism is required by the EMS.
Due to the issues mentioned above, an architecture design which can meet all needs of the EMS for convenience stores is displayed in Figure 4. Inside the architecture, there are seven major objects, and they are energy management strategy, human machine interface, strategy container, communication interface, data collection, strategy execution and paradox. Each of them will be explained in the following sections.
Figure 4: robust system design for EMS
1. Energy management strategy
Every single management strategy is implemented as an individual object, and each object should include its own initial conditions and strategic output. The key point is that an object is representing a rule of control strategy, and therefore, the modification of a rule or adding new rule will not influence other existing rules.
2. Strategy container
The time interval of each execution objects might not be the same due to their properties of the rules, and this object is used to manage the initiation and execution of these strategic rules. In addition, this object is also used to update the
environmental conditions of the store and the information is the input value for energy management rules.
3. Paradox
Since the objects and the outcome result of every strategy rule are individual, paradox mechanism appears to be important. While a device is targeted by tow or more outcome results, there is a need of a management mechanism to handle the paradox due to the output results of different rules. The advantage of this object is that rules will not influence each other and the priority of the output is managed by this object. If the priority of the output has been changed due to specific conditions, only this object needs to be modified and rest of the rules can be remain the same.
4. Strategy execution
After the output result was produced by the rules, and approved by paradox object, the execution object will then be called. This type of architecture design, separating this object from others, is aiming at easy to maintain and manage.
5. Data collection
This object will record the most up-to-date environmental information for human-machine interface and energy management strategy.
6. Human machine interface
This object is to take the configuration setting from users, and display the collected environmental information and the results of output actions. All the data is provided by the data collection object. The independence of this object can allow designers to change the appearance of the program without any influence to the core of program, and this EMS can still work even this object is deleted.
7. Communication interface
Currently, the Modbus protocol is implemented in this object for data collection object to use. In the future, if the media or protocol are changed, only this object needs to be modified, and no other objects will be affected.
After the initial parameters are loaded, the sequences of actions taken by this EMS are: 1.requiring and collecting setting data by the human machine interface. 2.strategy container and execution objects require communication interface
to update the environmental data and manage the outcome results. 3. paradox processing 4.execting the final outcome result.
3. Conclusions
The most common method to achieve energy saving is through the replacement of the old equipments, and this method can actually improve the power consumption. However, the device replacement is not affordable for most of the stores due to the expense. Moreover, the life cycle of high efficient device can be shortened and energy waste can be happened due to incorrect usage. Hence, applying the concepts of system management and strategy control onto the field of energy conservation is the main idea of this article. Through observation and analysis of relationship between the individual device power consumption, device operation modes and environmental factors, the rules of proper operation for devices can be found. The operation rules focus on when and how the devices should be operated, and no further device replacement is needed. By following this concept, a robust software system architecture was proposed, and it allowed new strategic rules to be added in to improve the energy saving results and required minimized system modification work only.
References
[1] RL Chen, YS Tsai, WL Li, “Research on the building energy consumption for hospital and department stores, Minister of interior 2000. [2] Energy conservation technical manuals for
convenience stores, BOE MOEA.
[3] D. J. Marihart, “Communications technology guidelines for EMS/SCADA systems,” IEEE Transactions on Power Delivery, vol. 16, No. 2, Apr. 2001.
[4] Y. H. Fung, V. M. Rao Tummala, 1993, “Forecasting of electricity consumption: a comparative analysis of regression and artificial neural network models”, The 2nd International Conference on Advances in Power System Control, Operation and Management, Hong Kong, Vol.2, pp.782 — 787
[5] A. G. Bakirtzls et al, 1996, “A neural network short term load forecasting model for the Greek power system” , IEEE Transactions on Power Systems, Vol.11, No.2, pp.858-863
[6] W. Charytoniuk, M. S. Chen, 2000, “Very short-term load forecasting using artificial neural networks”; IEEE Transactions on Power Systems, Vol.15, No.1, pp.263-268
[7] Q. Chen et al, 2001, “Implementation and performance analysis of very short term load forecaster based on the electronic dispatch project in ISO New England”; 2001 Large Engineering Systems Conference on Power Engineering, Halifax, Canada, 11-13 July, pp.98-104
![Figure 1 is the architecture design of this energy monitoring system [3], and the network used between the controller and the data collectors such as sensors and digital power meters is Modbus and the physical layer used is RS485](https://thumb-ap.123doks.com/thumbv2/9libinfo/8914904.261094/2.918.484.741.283.456/figure-architecture-monitoring-controller-collectors-digital-modbus-physical.webp)


