Low Complexity Formant Estimation Adaptive
Feedback Cancellation for Hearing Aids
Using Pitch Based Processing
Yi FanChiang, Cheng-Wen Wei, Yi-Le Meng, Yu-Wen Lin, Shyh-Jye Jou, Senior Member, IEEE, and
Tian-Sheuan Chang, Senior Member, IEEE
Abstract—This paper proposes a novel algorithm and
archi-tecture for the adaptive feedback cancellation (AFC) based on the pitch and the formant information for hearing aid (HA) applications. The proposed method, named as Pitch based For-mant Estimation (PFE-AFC), has significantly low complexity compared to Prediction Error Method AFC (PEM-AFC). The proposed PFE-AFC consists of a forward and a backward path processing. The forward path processing includes a low com-plexity pitch based formant estimator for decorrelation filter coefficients update and a pitch based voice activity detector for speech detection, which facilitates the feedback cancellation filter in the backward path to reduce feedback component and maintain speech quality. From system point of view, the PFE-AFC has low complexity overhead since it is easy to share computation resource with other components in the HA system, such as noise reduction and auditory compensation. In addition, the PFE-AFC is suitable for hardware implementation owing to its regular structure. Complexity evaluations show that the PFE-AFC has four orders lower complexity than the PEM-AFC. Simulation results show that the PFE-AFC and the PEM-AFC can achieve similar PESQ (perceptual evaluation speech quality) and ASG (added stable gain). Moreover, the proposed PFE-AFC can outperform the conventional AFC.
Index Terms—Adaptive feedback cancellation, hearing aid
ap-plication, voice activity detection.
I. INTRODUCTION
A
COUSTIC feedback, mainly caused by the closed loop resulted from the venting of hearing aids (HAs), yields annoying howling (or oscillation) and greatly reduces the willingness to use HAs. To solve this problem, many solutions have been proposed [1][2], such as subband gain suppression, frequency or phase modulation control, and adaptive feedback cancellation (AFC). The subband gain suppression reduces the gain of subbands where oscillations are detected, hence imme-diately eliminating howling. However, reducing gain usually Manuscript received October 06, 2013; revised January 29, 2014; accepted May 21, 2014. Date of publication May 29, 2014; date of current version June 25, 2014. This work was supported by the National Chip Implementation Center, and National Science Council, R.O.C., under Grant NSC101-2220-E-009-004. The associate editor coordinating the review of this manuscript and approving it for publication was Prof. DeLiang Wang.The authors are with the Department of Electronics Engineering and Insti-tute of Electronics, National Chiao Tung University, Hsinchu 30050, Taiwan (e-mail: [email protected]; [email protected]).
Color versions of one or more of the figures in this paper are available online at http://ieeexplore.ieee.org.
Digital Object Identifier 10.1109/TASLP.2014.2327300
degrades the auditory prescription and speech quality may be downgraded as well. Frequency and phase modulation control adjust the frequency or phase of signal in the subbands where oscillations are present, thereby avoiding oscillation caused by the gain or phase margin of the Nyquist stability criterion [3]. This method can provide better performance compared to gain suppression methods. However, it also degrades speech quality, since the signal phase and magnitude spectrum are changed. In addition to the degradation of prescription and quality, both the subband gain suppression and frequency or phase modulation control may start their operations after oscillation is large enough to be detected. Therefore, these methods are not able to avoid the annoying feeling for HA users.
In contrast to above methods, the AFC tries to prevent system oscillation by using an adaptive algorithm to mimic feedback component and then subtract it from the input signal. The AFC cancels feedback without directly modifying subband gain and signal spectrum. Therefore, the AFC methods, according to [2], can provide better performance and speech quality compared to subband gain suppression and frequency or phase modula-tion methods. However, the AFC in HA system confronts bias problem. Tonal and speech signal lead to correlation between microphone and speaker signal [2][4]. The bias problem causes the adaptive filter tend to minimize tone or speech input rather than feedback components resulted from feedback channel.
To eliminate the bias problem, several methods have been proposed. For instance, a constraint adaptation [5] is proposed to directly constraint feedback filter such that its transfer function is not updated too far away from a pre-defined one. This method is effective for system robustness; however, this method is not able to deal with the conditions if feedback channel is changed a lot, such as a phone handset is placed near the aided ear. Thus, a more effective solution, named as filtered-x method [6][7] which is shown in Fig. 1, is proposed to remove speech com-ponent in error signal before adaptive updating by using a pre-defined bandstop filter . The and are feedback channel and feedback cancellation filter in the backward path of HA, respectively. Both the and are modeled as finite impulse response filters. The forward path in HA is mod-eled as a frequency dependent gain . The transfer function generally adopts the inverse of long-term average speech spectrum, hence being called as decorrelation filter. However, it is reasonable that the decorrelation filter should be adaptively adjusted according to speech variation. Therefore, a prediction error method based AFC (PEM-AFC), as shown in Fig. 2, is 2329-9290 © 2014 IEEE. Personal use is permitted, but republication/redistribution requires IEEE permission.
FANCHIANG et al.: LOW COMPLEXITY FORMANT ESTIMATION AFC FOR HEARING AIDS 1249
Fig. 1. The block diagram of the filtered-x method.
Fig. 2. The block diagram of the PEM-AFC method.
derived for decorrelation and feedback cancellation filter de-sign based on the concept of linear prediction coefficients [8] or prewhitening method [9]. The linear prediction coefficients and the prewhitening methods can achieve an effective approxima-tion for speech energy distribuapproxima-tion. Therefore, the PEM-AFC is proven to have better performance and speech quality [1]–[8]. The major shortcoming of the PEM-AFC is high computational complexity [2], since it should estimate linear prediction coeffi-cients by using Burg method [8] or calculate prewhitening filter using recursive least squares (RLS) [9] method. The high com-plexity leads to the fact that the PEM-AFC may not be suitable for real-time applications [2] or mobile devices, especially for HA applications.
In this work, we propose a low computational complexity implementation for the PEM-AFC. The proposed Pitch based Formant Estimation AFC (PFE-AFC) utilizes the forward path information of HA system for decorrelation filter approxima-tion. A pitch based processing instead of linear prediction co-efficients or RLS is also proposed for decorrelation filter coef-ficients update. A pitch based voice activity detection (VAD) is
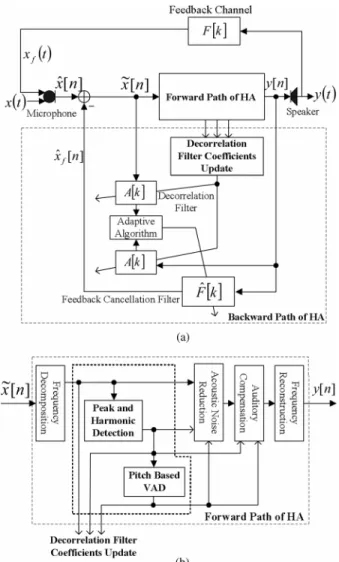
Fig. 3. The block diagram of (a) the pitch based HA system and (b) the forward path processing.
also presented to facilitate the AFC update. To provide the pitch information for the PFE-AFC, an efficient pitch detection circuit is proposed.
The pitch based processing has been proven to be an efficient way to perform robust VAD and noise reduction in stationary and nonstationary noisy environment [10]. From implementa-tion point of view, the pitch based processing has low com-plexity and regular architecture which is very suitable for hard-ware implementation. Thus, this paper also proposes an archi-tecture design for the pitch based processing.
The rest of this paper is organized as follows. Section II presents the detail of the proposed PFE-AFC and the pitch based HA system. Section III provides the complexity and performance comparisons among the PFE-AFC and other AFC methods. Conclusion is finally drawn in Section IV.
II. THEPROPOSEDPFE-AFC ALGORITHMS
A. The Pitch Based HA System
Fig. 3 illustrates the block diagram of the pitch based HA consisting of a forward path and a backward path. The back-ward path, performing the AFC, has a similar structure as that of the PEM-AFC, except that coefficients of the decorrelation filter are updated by the forward path information. The forward path,
Fig. 4. (a) Magnitude of speech spectrum and (b) the slope of (a). being the main part of HA, includes six blocks which can be divided into two groups. The first group is a pitch computation processing (marked by dotted line) which is proposed for speech discrimination and the pitch information calculation. The pitch information is used by the decorrelation filer coefficients update (in the backward path). The second group can be viewed as con-ventional blocks in HA and is designed to reduce background noise and provide the hearing prescription. The second group includes frequency decomposition and reconstruction, acoustic noise reduction and auditory compensation. This group may en-hance speech based on the pitch information provided by the first group, or adopt conventional methods [11]–[13] for noise suppression and speech intelligibility improvement.
In this paper, we use 256 data sample as a frame with zero padding technique to perform length-1024 fast Fourier trans-form (FFT) to provide 23 Hz frequency resolution at 24 kHz sampling rate. The using of 256 data sample as a frame has 10.67 ms time delay and can meet HA application. 50% overlap between two successive FFTs is exploited for the continuity of speech signal. The 23 Hz resolution is derived from the min-imum resolution of ANSI S1.11 filter bank [14].
B. The Peak and Harmonic Detection in the Forward Path
The peak and harmonic detection are used to estimate the speech spectrum for the decorrelation filter and to provide speech information for the pitch based VAD. For the peak detection in the forward path, an efficient slope based method is proposed and is illustrated in Fig. 4. Fig. 4(a) depicts an example of magnitude spectrum for speech signal, and Fig. 4(b) draws its slope and corresponding zero crossings which mark spectral peaks. For clarity, only the bandwidth from 0 Hz to 6 kHz is plotted. To find peaks, slope between each two samples can be calculated as:
(1)
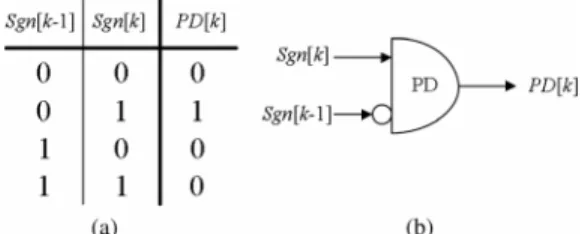
Fig. 5. Peak detection, (a) truth table and (b) corresponding PD circuit.
Fig. 6. The circuit design of peak detection.
where is the frequency index, is the magnitude response of input signal . is FFT length and is set to 1024 in our case.
With , the peaks can be detected by simply tracking along frequency axis from 0 Hz to 12 kHz and finding the locations where they change from positive value to nega-tive value. This method can be simplified to detect the change of slope’s sign bit in a 2’s compliment number system. Fig. 5 shows its truth table and corresponding detection circuit, named as peak detection (PD). The PD is simply composed by a NOT gate and an OR gate shown as (2).
(2) where is the sign bit of . For the length- FFT, only - PDs are required as illustrated in Fig. 6 owing to the symmetry feature of magnitude spectrum. Peaks can be found by detecting which the PD outputs are high, as shown in (3).
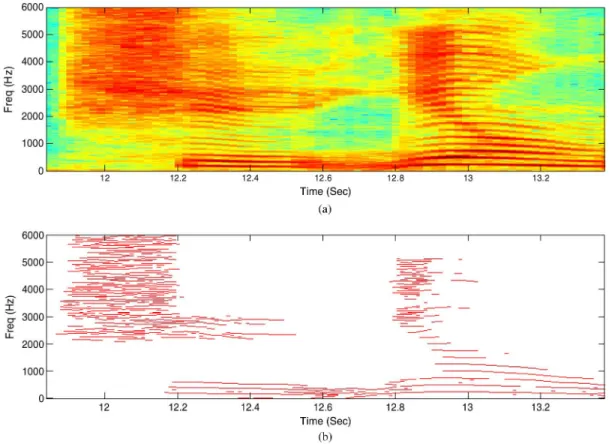
(3) where is a vector containing the frequency index of all detected peaks at time . means 50% overlap of length . is computed once for each frame. Fig. 7 illustrates an example of result for Chinese 2-characters “Shi-Yong.” For clarity, only the bandwidth from 0 Hz to 6 kHz is drawn.
The peak detection circuit finds all peaks in magnitude spec-trum. However, some of detected peaks are not the harmonics,
FANCHIANG et al.: LOW COMPLEXITY FORMANT ESTIMATION AFC FOR HEARING AIDS 1251
Fig. 7. An example of peak detection, (a) the spectrogram of input signal which is a Chinese 2-characters “Shi-Yong” and (b) the corresponding result of peak detection, .
especially in high frequency. A two-steps method is proposed to select the appropriate harmonics. The first step selects candi-date peaks for speech harmonics based on an adaptive threshold as below:
(4) where is the magnitude of each element in , is the expectation (mean) operator. The lower bound is an empirical constant and is set to 0.003 in our case. The lower bound scheme is designed for speech absent condition. Using
, the candidate of peaks can be detected as below.
(5) where contains the frequency index at time for all peaks whose magnitude are greater than . Fig. 8 depicts the detection results of Fig. 4, where and the detected peaks are marked by dash line and circle, respectively.
Based on the candidate of peaks, the second step discrimi-nates vowel harmonics by exploiting two features, namely har-monic structure and frequency modulation (FM). The harhar-monic feature indicates the vowel energy is primarily distributed at fre-quency and its multiples as below:
(6)
Fig. 8. Detection results of Fig. 4, (a) magnitude of speech spectrum, (b) and (c) candidates of peaks.
where is the fundamental frequency. Therefore, vowel can be detected if three candidates satisfy the harmonic features de-fined in (6). With respect to discrete frequency domain, (6) can be modified as (7):
(7) where and are integer constants. and are de-signed to provide tolerance range for discrete frequency, since
the fundamental frequency, second harmonics, and third har-monics may not exactly be located at and its multiples. Here, and are set to 1 and 3, respectively. The detected peak index to fulfill (7) is written in (8).
(8)
(9)
where , and contain the harmonic
index at time . The harmonic features described above can provide a good speech discrimination [10]–[16]. However, for several cases there may be more than one candidate peak in the neighborhood of , and . Therefore, a tracking scheme based on the FM feature of speech harmonics is adopted to im-prove the discrimination accuracy. The FM features indicate that the vowel harmonics of spectrogram prolong and slowly change, as shown in Fig. 7. Therefore, the tracking scheme treats peaks as speech harmonics if it meets prolonging and difference requirement shown in (10). In which, the harmonic peak index in current frame is limited to less than one index difference from the harmonic index in the previous frames.
(10) For the case that at least two peaks meet (10), the detector chooses the smallest for . Hence, the final detected result is written as:
(11) The detected frequency index in (11) and corresponding mag-nitude are exploited in the PFE-AFC, or in the noise reduction and the auditory compensation for further pro-cessing, as depicted in Fig. 3(b). The peak detection also leads to an efficient VAD algorithm, which will be described in the pitch based VAD subsection.
C. The Decorrelation Filter Coefficients Update
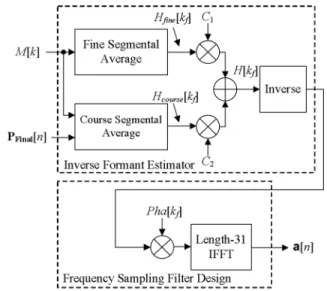
Fig. 9 depicts the proposed algorithm in the forward path for the coefficients update of the decorrelation filter. For low com-putational complexity, the proposed method exploits the results of in (1) and in (11). In addition, we propose an efficient algorithm by using the segmental average and constant multiplications instead of conventionally adopted linear predic-tion or RLS algorithm. The proposed method can be divided into two steps, inverse formant estimator and frequency sam-pling filter design.
The inverse formant estimator is proposed to estimate speech energy distribution based on the segmental average, as shown
Fig. 9. The block diagram of the proposed decorrelation filter coefficients up-date in the forward path.
in Fig. 9. The upper part is a fine segmental average, as shown in (12), to estimate the shape of speech formant.
(12)
where is a frequency index and is set to . can be viewed as a decimation-by-32 version of magnitude spec-trum . The decimation ratio is adopted empirically to pro-vide compromise between the speech quality and the computa-tional complexity. Furthermore, for real-valued data, only the computations from 0 Hz to half sampling rate are needed to be carried out owing to the even symmetry of magnitude spectrum.
Hence, only 16 samples ( ) are calculated
for each operation.
Although can provide an estimation of the for-mant shape, the forfor-mant estimation can be improved by using a nonuniform coarse segmental average, as depicted in the lower path of Figs. 9 and 10. The coarse segmental average, as shown in (13), adopts the similar average scheme as the fine segment average except that the coarse segment average only uses for average calculation.
Hz kHz if
kHz kHz if
kHz kHz if
kHz kHz if
(13)
where is designed based on a nonuniform scheme which has two 2 kHz segments ( and ) in low frequency and two 4 kHz segments ( and ) in high frequency. The nonuniform scheme is used to achieve an efficient estima-tion, since speech energy mainly distributes in low frequency. For high frequency, there is almost no speech harmonic, hence making the coarse segment average in those bandwidths tend to zero.
FANCHIANG et al.: LOW COMPLEXITY FORMANT ESTIMATION AFC FOR HEARING AIDS 1253
Fig. 10. An example for vowel spectrum and corresponding estimation. is interpolated to 16 uniform samples by
re-peating to obtain and then linearly
combined with to generate the estimated formant as (14).
(14) where and are constants. Then, is used to generate the inverse formant estimation for the second step, as follows.
(15) The second step is the frequency sampling filter design which computes filter coefficients based on IFFT. The frequency sam-pling method [17][18] consists of two blocks, a phase multipli-cation and a length-31 IFFT as shown in (16).
(16) where is a constant phase defined as (17).
(17) The length of IFFT is fixed and thus can be implemented with the Winograd [19] technique, which consumes 160 multiplica-tions [20] for each frame. The phase multiplication costs 30 multiplications for each frame because is even symmetry and is complex conjugate. Since all of those multipli-cations are constant operations, several low power techniques, such as shift-and-add transformation [21], are easy to be ap-plied to reduce the power consumption. The low power methods adopted by [14][22] are also good choices to significantly re-duce power consumption.
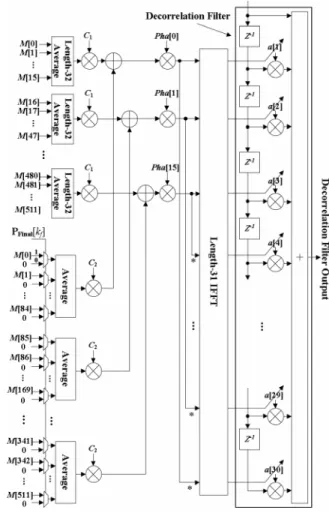
Fig. 11 depicts the circuit design of the decorrelation filter coefficients update, where the decorrelation filter is plotted to show entire architecture. “Average” blocks consist of simple
Fig. 11. The circuit design of the proposed decorrelation filter coefficients up-date, and the decorrelation filter, where asterisk means conjugate.
shifters and accumulators. The accumulators as well as the decorrelation filter can be implemented by using the carry save adder [21] for high speed and regular architecture. Therefore, the proposed decorrelation filter algorithm has a regular archi-tecture and thus is suitable for hardware implementation.
D. The Adaptive Feedback Cancellation in Backward Path
Estimated coefficients of the decorrelation filter is ex-ploited in the backward path for speech filtering, to aid feedback cancellation filter to be more insensitive to input speech energy. The feedback cancellation filter adopts conventional nor-malized least mean square (NLMS) method as shown in (18) for feedback channel approximation.
(18) where is the coefficients of feedback cancellation filter, is the step size, and is the error signal which is generated by filtering feedback cleaned input through decorrelation filter as (19):
(19) where is a convolution operator. is shown as below:
Fig. 12. The block diagram of pitch based VAD. is the result of filtered by as below:
(21) Starting from system initialization, the feedback cancellation continuously operates no matter it is speech or noise segment. To further improve speech quality, a VAD-aid- -control, shown in (22), is adopted for speech frames.
if
if (22)
where is a preset constant and is set to 0.001. is set to 0.25 and can be implemented by a 2-bits shifter. It is an at-tenuation gain to slow down update speed if speech is present. is the VAD detection result which will be described in the next subsection.
E. Pitch Based VAD in Forward Path
VAD is an important block in HA system, since it facilitates the operation of noise reduction and speech enhancement [28]. The proposed PFE-AFC also utilizes the VAD results to im-prove speech quality as shown in (20). The proposed pitch based VAD detects voice activity based on peak detection results. The pitch based VAD, as shown in Fig. 12, can be divided into two parts, namely vowel detection and consonant detection.
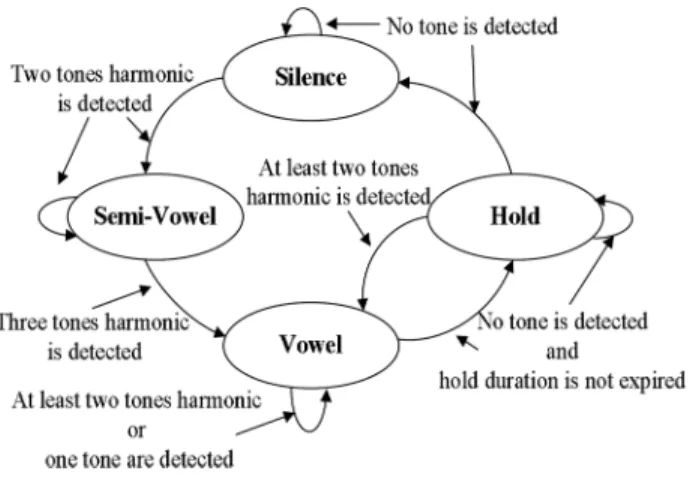
The vowel detection discriminates speech vowel by detecting harmonic structure based on (1)-(11). Using those results, a fi-nite state machine (FSM), depicted in Fig. 13, is designed to perform vowel detection. The FSM denotes signal frame as four states, namely, silence, semi-vowel, vowel and hold state. If no tone is detected, the frame is denoted as silence frame. The silence state lasts until speech harmonic structure is detected. However, the VAD treats those frames having two tones har-monic structure (one fundamental and one harhar-monic tone) as semi-vowel frames. For the PFE-AFC, the semi-vowel is also treated as the vowel and thus VAD-aid-μ-control is enabled. During semi-vowel frames, the VAD does not denote the frame as the vowel state until the harmonic requirements described in (8) and (9) are confirmed. Additionally, in the vowel state, har-monic tracking presented in (10) and (11) is also utilized to assist the vowel detection. The FSM departs from the vowel state, if (8)-(11) are not confirmed. Since several frames next to vowel frames may still contain weak speech energy without satisfying (8)-(11), a hold state is designed for those frames to improve
Fig. 13. The FSM of vowel detection.
vowel detection. During the hold frames, the VAD continuously searches for harmonic structure. If (8) and (9) are confirmed again, the FSM directly enters the vowel state without entering the semi-vowel. On the other hand, the FSM backs to the si-lence state if a preset duration for hold state is expired. For the PFE-AFC, the hold state is also viewed as vowel to activate the VAD-aid- -control for quality improvement. The summary of the vowel detector is shown in (23).
if
-if
(23) The vowel detection cannot find consonant which does not have harmonic structures. Fortunately, the proposed peak de-tection can also achieve the consonant dede-tection. As depicted in Fig. 7, the consonant between 11.9 s and 12.2 s has highly con-centrated peaks in high frequency. By exploiting this feature, a consonant detector is proposed with consonant state and empty state. The consonant state is detected by checking if the number of peaks ( ) above 3 kHz is larger than a preset constant. Otherwise, the state is denoted as empty state. The consonant detector is summarized as (24).
if
if (24)
and are computed once every frame and are ORed to obtain a final result , as shown in Fig. 12.
III. COMPLEXITY ANDPERFORMANCEEVALUATION
A. Complexity Comparison
Although power consumption may rely on implementation techniques, the computational complexity of the algorithm still plays an important role for power dissipation. This section provides the complexity of the proposed PFE-AFC in terms of the number of additions (ADD), multiplications (MUL) and divisions (DIV). In addition, the PEM-AFC using the RLS method [23] is selected for comparison because of its good performance. The comparison focuses on the complexity of decorrelation filter coefficients update, since we can assume that both the PFE-AFC and the PEM-AFC use the same AFC.
FANCHIANG et al.: LOW COMPLEXITY FORMANT ESTIMATION AFC FOR HEARING AIDS 1255
TABLE I
THECOMPLEXITY OFDECORRELATIONFILTERCOEFFICIENTS
UPDATE FOR THEPFE-AFC
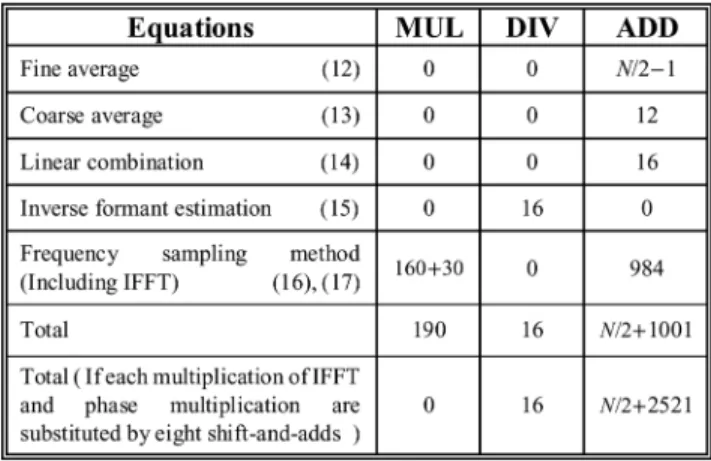
Table I shows the complexity of decorrelation filter coeffi-cients update for the PFE-AFC, where is the FFT length and is 1024 in our case. The complexity in (16) is caused by phase multiplications (30 MULs) and length-31 Winograd IFFT (160 MULs and 984 ADDs) [20]. Those multiplications are constant operations, and thus are easy to be implemented by dedicated hardware to significantly reduce complexity. In the compar-isons, we replace the complexity of each multiplication for IFFT and phase multiplication by eight shift-and-adds, assuming mul-tiplier width is 16-bits. Furthermore, the binary DIV complexity is the same order as the binary MUL. Therefore, the total com-plexity is equivalent to 16 MULs and 3033 ADDs when is 1024. Moreover, the decorrelation filter coefficients update is a frame based method and updates once for each frame. Hence, from the sample based point of view, its complexity can be di-vided by 128 and thus is much lower than that of the PEM-AFC. Table II provides the complexity of the RLS algorithm for comparisons, where is the length of decorrelation filter which is 21 in our case. In addition, the divisions by are not counted since they are constant operations and do not dominate complexity. The RLS can perform fast convergence at the expense of complexity, which is much more than the of NLMS adopted by feedback cancellation filter. Therefore, the RLS decorrelation filter dominates the computa-tional complexity of the PEM-AFC. However, low complexity design for RLS is relatively difficult than that of the proposed method, as its huge number of non-constant multiplications.
Table III summaries the comparisons of total complexity, where and are substituted by 1024 and 21, respectively. The PFE-AFC significantly reduces the complexity of decor-relation filter coefficients update. This complexity is further reduced by 128 from the sample based point of view, because the PEM-AFC is a sample based algorithm. As a result, the decorrelation filter of the PFE-AFC has about four orders lower complexity compared to that of PEM-AFC.
B. Performance Evaluation
This section provides performance comparisons for speech quality and AFC performance. The speech quality is evaluated in terms of the PESQ [24]. PESQ is being used as an accepted standard, even though it shows weakness with tonal languages.
TABLE II
THECOMPLEXITY OFDECORRELATIONFILTERCOEFFICIENTS
UPDATE USINGRLS METHOD
TABLE III
THECOMPARISON OFCOMPLEXITY FOR THEDECORRELATIONFILTER
UPDATE OF THEPEM-AFCAND THEPFE-AFC
The PESQ ranges from 1.0 to 4.5, where higher score implies a better perceptual quality. With respect to the AFC performance, added stable gain (ASG) [8] is applied for robust comparisons. Both of the adopted parameters are derived from the estimated feedback channel and real one . The ASG, defined as (25), is the maximum additional gain that HA can provide.
(25) where maximum stable gain (MSG) is the maximum allowable gain of HA [25], if the HA’s frequency response is assumed to be flat. The MSG is defined as follows.
(26) The MSG can be viewed as the largest remainder of feedback component that the AFC cannot cancel, which decides the max-imum achievable gain of HA. From another perspective, the MSG represents the minimum distance between 0 dB gain and the feedback cancellation remainder. HA gain larger than the MSG makes the loop gain exceed 0 dB and may thus cause os-cillation. The term in (25) can be treated as a special case of (26) when the AFC is not available. Therefore, the ASG represents the added gain provided by the AFC and is an impor-tant parameter for HA application.
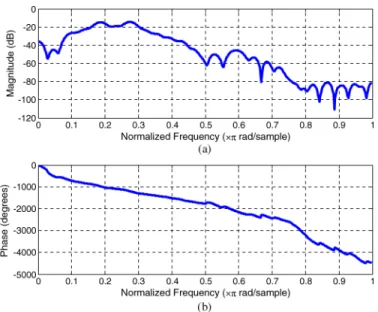
In this paper, we adopt the feedback channel measured by [26] as channel model for simulations. The channel is modeled as a FIR filter with length of 75 at 24 kHz sampling rate. Fig. 14 depicts its frequency response. For comparisons, three AFC methods are adopted, the conventional AFC without
Fig. 14. The frequency response of feedback channel, (a) magnitude response and (b) phase response.
decorrelation filter (C-AFC), the PEM-AFC and the proposed PFE-AFC. The PEM-AFC uses the RLS for decorrelation filter coefficients updating [23]. With respect to the feedback cancellation filter update, all of the methods adopt NLMS method with the same setting for fair comparisons. In addition, many simulation parameters are from [8]. For example, the filter length of feedback cancellation filter is set to 75, which is the same as the feedback channel length. The decorrelation filter length for the PEM-AFC is 21, whereas the one for the PFE-AFC is 31. The forgetting factor of the RLS is set as 1-(1/240), whereas the step size of NLMS is set to 0.001.
1) PESQ: In simulations, 27 2-characters Chinese recording
chosen from Academia Sinica Balanced Corpus is adopted [27]. The length of 27 2-characters Chinese is 46.12 seconds. The gender of the speaker is female. White noise, babble noise, car noise and factory noise provided by NOISEX-92 are used as noise source. The simulation results are evaluated by PESQ [28] at six SNRs (0 dB, 3 dB, 5 dB, 7 dB, 10 dB, clean speech) for comparisons.
Table IV shows comparisons of PESQ for three AFC methods. Simulation results show that the PEM-AFC and the PFE-AFC provide the better speech quality, while the C-AFC performs the worst speech quality. The C-AFC, without the aid of decorrelation filter, tends to attenuate input speech when speech is present, hence being easy to cause distortion. On the other hand, the proposed PFE-AFC reduces speech disturbance with decorrelation filter, thereby can achieve the PESQ score of 3.96. To further analyze the contribution of VAD control, the PESQ of PFE-AFC with perfect VAD and without VAD control is provided. It shows the PESQ of PFE-AFC without VAD control has slight degradation and the PFE-AFC is not sensitive to VAD performance due to the decorrelation filter. Moreover, the PESQ is decreased when the SNR of input signal is increased, which is caused by the more serious bias problem. Fig. 15 and Fig. 16 show the simulation results of the input signal , which is the clean speech, and the output of the PEM-AFC, the PFE-AFC and the C-AFC. The temporal
TABLE IV
THEPESQOFFIVEAFC METHODS
Fig. 15. The temporal waveform of (a) input speech and the output signal of (b) PEM-AFC, (c) PFE-AFC and (d) C-AFC.
waveform in Fig. 15 reveals that all methods cause speech distortion. However, the distortion caused by the C-AFC is much more obvious and serious. On the contrary, the proposed PFE-AFC and the PEM-AFC significantly reduce speech dis-tortion by the decorrelation filtering. The spectrogram shown in Fig. 16 also reveals similar results. The PEM-AFC and the proposed PFE-AFC have similar output spectrogram with that of input. In contrast, the C-AFC spectrogram evidently illustrates difference between the others.
Listening to the processed sound provides another per-spective for speech distortion. The speech processed by the PEM-AFC can provide good speech quality, while the PFE-AFC sometimes has small and high frequency artifacts in the beginning of each sentence. This is because the decorrela-tion filter coefficients update of the PFE-AFC is frame based and cannot immediately respond to the onset of each sentence. For the C-AFC, the artifacts become even worse since the feedback filter update is continuously impacted by speech signal. Thus, low frequency artifacts sometimes appear after high frequency ones occur. The low frequency artifacts cause smeared and obscure feeling which reduces speech quality. The artifacts can be used to prove that without the protection of
FANCHIANG et al.: LOW COMPLEXITY FORMANT ESTIMATION AFC FOR HEARING AIDS 1257
Fig. 16. The spectrogram of (a) input speech and the output signal of (b) PEM-AFC, (c) PFE-AFC and (d) C-AFC.
decorrelation filtering, the feedback cancellation filter tends to eliminate the input speech.
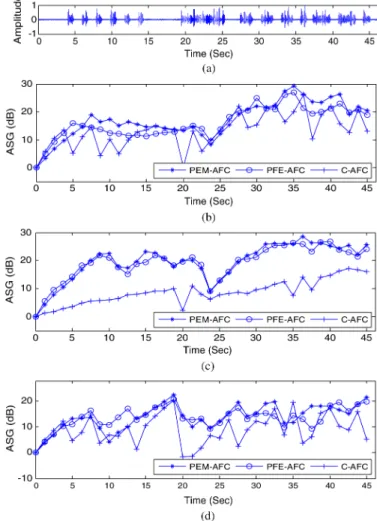
2) ASG: Fig. 17 shows the ASG simulations in SNR 0 dB
white noise, 0 dB babble noise, and clean speech environments. In the beginning of the simulation, the feedback cancellation filters are set to zero. At the 23 seconds of the simulation, the feedback path gain is increased by 10 dB, which is to simulate the scenario of bringing a telephone handset to the aided ear, to investigate the convergence behavior. During 0 to 23 seconds, the feedback path is denoted as original feedback path. There-fore, the ASG progressively increases from 0 dB to its steady range, i.e. the PFE-AFC is about 11 dB for original feedback path in 0 dB white noise.
Fig. 17(a) shows the clean speech and the rest figures of Fig. 17 show the ASG results of the three methods in different scenarios. Generally, in the speech segment, the ASG gradu-ally increases or decreases owing to the adaptive filter update. Among three AFC methods, the PEM-AFC and the PFE-AFC could perform the stable ASG and there are about 2 dB dif-ferences in white noise. In babble and clean speech environ-ments, the PEM-AFC and the PFE-AFC achieve comparable re-sults. However, the ASG of C-AFC has larger variation caused by speech disturbance. In addition to ASG variation, the max-imum ASG is also an important system parameter, which is limited by the minimum value of each curve. For example, in Fig. 17(b), during the steady range in original feedback path, the PEM-AFC has the best ASG performance (about 13 dB), while the PFE-AFC has similar performance (about 11 dB). The C-AFC has the worst ASG performance (about 0.3 dB).
3) VAD Accuracy: In the VAD evaluations, the speech
sig-nals used in PESQ simulation are adopted. VAD accuracy in terms of percentage (%) is provided to show the VAD accuracy rate. Table V lists the simulation results of the VAD accuracy. The average accuracy of the proposed VAD is 74.26%, 84.67%, and 86.53% at SNR of 0 dB, 5 dB, and 10 dB, while the overall average VAD accuracy is 82.39%. General speaking, the VAD
Fig. 17. (a) the clean speech signal, (b) the results of ASG simulation in 0 dB white noise, (c) the results of ASG simulation in 0 dB babble noise, and (d) the results of ASG simulation for clean speech.
TABLE V
THEEVALUATION OFVAD PERFORMANCE
accuracy rate increases when SNRs are increased. It can be ob-served that the VAD accuracy can achieve similar performance at SNR of 10 dB and its accuracy in white and car noise is higher than in babble and factory noise. The features of the proposed VAD can be described by two aspects. First, the vowel detector in the pitch based VAD discriminates speech according to har-monic structure which is one of the most important speech fea-tures. Second, although the consonant detection is easily im-pacted by large noise, the hold state designed for speech pro-tection still reduces VAD error. It is because that the hold state
covers most of the highly polluted consonants, except the onset of first Chinese character in each sentence. Therefore, the accu-racy does not significantly degrade in low SNR scenarios.
IV. CONCLUSION
In this paper, a low complexity PFE-AFC based on the pitch and formant information has been proposed for HA applica-tions. Based on the pitch and the harmonic detection, a high accurate pitch based VAD has also been proposed to assist the PFE-AFC. According to simulation results, the PFE-AFC can achieve the comparable PESQ and ASG compared with the high complexity PEM-AFC. In addition, the PFE-AFC outperforms the C-AFC in all evaluations. Note the complexity of the pro-posed decorrelation filter coefficients update which dominates the PEM-AFC complexity is significantly reduced by about four orders. From the system point of view, the proposed PFE-AFC has a regular architecture and low overhead since it can share computation resource with other HA processing units. Thus, the proposed algorithm is suitable for hardware implementations and HA applications.
ACKNOWLEDGMENT
The authors would like to thank Prof. S. T. Young for pro-viding speech database as well as professor T. S. Chi for con-structive discussions.
REFERENCES
[1] J. M. Kates, Digital hearing aids. San Diego, CA, USA: Plural, 2008. [2] T. V. Waterschoot and M. Moonen, “Fifty years of acoustic feedback control: state of the art and future challenges,” Proc. IEEE, vol. 99, no. 2, pp. 288–327, Feb. 2011.
[3] H. Nyquist, “Regeneration theory,” Bell Syst. Tech. J., vol. 11, pp. 126–147, 1932.
[4] J. Hellgren and U. Forssell, “Bias of feedback cancellation algorithms in hearing aids based on direct closed loop identification,” IEEE Trans.
Speech Audio Process., vol. 9, no. 7, pp. 906–913, Nov. 2001.
[5] J. M. Kates, “Constrained adaption for feedback cancellation in hearing aids,” J. Acoust. Soc. Amer., vol. 106, no. 2, pp. 1010–1019, Aug. 1999. [6] J. Hellgren, “Analysis of feedback cancellation in hearing aids with filtered-x LMS and direct method of closed loop identification,” IEEE
Trans. Speech Audio Process., vol. 10, no. 2, pp. 119–131, Feb. 2002.
[7] J. M. Kates, “Feedback cancellation in a hearing aid with reduced sen-sitivity to low-frequency inputs,” U.S. patent 6,831,986, Dec. 14, 2004. [8] A. Spriet, I. Proudler, M. Moonen, and J. Wouters, “Adaptive feed-back cancellation in hearing aids with linear prediction of the desired signal,” IEEE Trans. Signal Process., vol. 53, no. 10, pp. 3749–3763, Oct. 2005.
[9] T. V. Waterschoot, “Design and evaluation of digital signal processing algorithms for acoustic feedback and echo cancellation,” Ph.D. disser-tation, Dept. Elect. Eng., Leuven Univ., Leuven, Belgium, 2009. [10] Y. J. Chen, C. W. Wei, Y. FanChiang, Y. L. Meng, Y. C. Huang, and
S. J. Jou, “Neuromorphic pitch based noise reduction for monosyllable hearing aid system application,” IEEE Trans. Circuits Syst. I, vol. 61, no. 2, pp. 463–475, Feb. 2014.
[11] C. W. Wei, C. C. Tsai, T. S. Chang, and S. J. Jou, “Perceptual multi-band spectral subtraction for noise reduction in hearing aids,” in Proc.
Asia Pacific Conf. Circuits Syst., Kuala Lumpur, Malaysia, 2010, pp.
692–695.
[12] Y. T. Kuo, T. J. Lin, W. H. Chang, Y. T. Liu, and C. W. Liu, “Com-plexity-effective auditory compensation for digital hearing aids,” in
Proc. Int. Symp. Circuits Syst., May 2008, pp. 1472–1475.
[13] K. C. Chang, Y. T. Kuo, T. J. Lin, and C. W. Liu, “Complexity-ef-fective dynamic range compression for digital hearing aids,” in
Proc. IEEE Int. Symp. Circuits Syst., Paris, France, Jun. 2010, pp.
2378–2381.
[14] Y. T. Kuo, T. J. Lin, Y. T. Li, and C. W. Liu, “Design and implemen-tation of low-power ANSI S1.11 filter bank for digital hearing aids,”
IEEE Trans. Circuits Syst. I, vol. 57, no. 7, pp. 1684–1696, Jul. 2010.
[15] T. Nakatani and H. G. Okuno, “Harmonic sound stream segregation using localization and its application to speech stream segregation,”
Speech Commun., vol. 27, no. 3–4, pp. 209–222, Apr. 1999.
[16] K. Nakadai, K. Hidai, H. G. Okuro, and H. Kitano, “Real-time speaker localization and speech separation by audio-visual integration,” in
Proc. IEEE Int. Conf. Robotics Autom., Washington, D.C., USA, 2002,
pp. 1043–1049.
[17] A. V. Oppenheim, R. W. Schafer, and J. R. Buck, Discrete-time signal
processing, 2nd ed. Upper Saddle River, NJ, USA: Prentice-Hall,
2009.
[18] V. K. Ingle and J. G. Proakis, Digital signal processing using Matlab, 4th ed. ed. Boston, MA, USA: PWS, 1997.
[19] S. Winograd, “On computing the discrete fourier transform,” Math.
Comput., vol. 32, pp. 175–199, 1978.
[20] I. Selesnick, Apr. 10, 2010, Winograd’s short DFT algorithms, [On-line]. Available: http://cnx.org/content/m16333/latest/
[21] B. Parhami, Computer arithmetic: algorithms and hardware designs, 2nd ed. ed. New York, NY, USA: Oxford Univ. Press, 2009. [22] A. Wang and A. Chandrakasan, “A 180-mV subthreshold FFT
pro-cessor using a minimum energy design methodology,” IEEE J.
Solid-State Circuits, vol. 40, no. 1, pp. 310–319, Jan. 2005.
[23] T. V. Waterschoot, G. Rombouts, and M. Moonen, Oct. 2005, Soft-ware for double-talk robust acoustic echo cancellation, [Online]. Available: ftp://ftp.esat.kuleuven.be/pub/SISTA/vanwaterschoot/ab-stracts/05-162.html
[24] “Perceptual evaluation of speech quality (PESQ), and objective method for end-to-end speech quality assessment of narrowband telephone net-works and speech codecs,” ITU-T Recommendation, 2000, p. 862. [25] J. M. Kates, “Room reverberation effects in hearing aid feedback
can-cellation,” J. Acoust. Soc. Amer., vol. 109, no. 1, pp. 367–378, Jan. 2001.
[26] J. Yang, M. T. Tan, and J. S. Chang, “Modeling external feedback path of an ITE digital hearing instrument for acoustic feedback cancella-tion,” in Proc. IEEE Int. Symp. Circuits Syst., Kobe, Japan, 2005, vol. 2, pp. 1326–1329.
[27] [Online]. Available: http://rocling.iis.sinica.edu.tw/CKIP/engversion/ 20corpus.htm
[28] P. C. Loizou, Speech Enhancement, Theory and Practice. Boca Raton, FL, USA: CRC, 2007.
Yi FanChiang received the B.S. degree in electrical engineering from National Central University, Taoyuan, Taiwan, in 2006 and M.S. degree from National Tsing Hua University, Hsinchu, Taiwan in 2008. He is currently working toward the Ph.D. de-gree in electronic engineering from National Chiao Tung University (NCTU,) Hsinchu, Taiwan, since 2008. His research interests include digital signal processing, speech processing, and bio-electronic circuit.
Cheng-Wen Wei received the B.S. and M.S. degrees in electrical engineering from Yuan Ze University, Taoyuan, Taiwan, in 1998 and 2000. He received the Ph.D. degree in electronic engineering from National Chiao Tung University (NCTU,) Hsinchu, Taiwan in 2013.
From 2000 to 2006, he was an engineer and worked on Delta Sigma data convertor, speech signal processing and VLSI design, with the Product Development Division/Digital Circuit Design Dept. (DCD,) Elan Microelectronics Corporation (EMC,) Hsinchu, Taiwan. He is currently a research and design manager in the Digital Circuit Division of ZEITEC semiconductor, Hsinchu, Taiwan, where he is designing algorithms and digital circuits for low power signal enhancement and noise reduction. His research interests include digital signal processing, speech processing, data conversion and low power VLSI design.
Dr. Wei received the Gold Medal Award at the 2013 Merry Electroacoustic Thesis Award.
FANCHIANG et al.: LOW COMPLEXITY FORMANT ESTIMATION AFC FOR HEARING AIDS 1259
Yi-Le Meng received the B.S. and M.S. degrees in electronic engineering from National Chiao Tung University (NCTU,) Hsinchu, Taiwan, in 2008 and 2011. His research interests include low-power digital IC design and speech processing.
Yu-Wen Lin received the B.S. electronic engi-neering from National Chiao Tung University (NCTU,) Hsinchu, Taiwan, in 2012. He is cur-rently working toward M.S. degree in electronic engineering from National Chiao Tung University (NCTU,) Hsinchu, Taiwan, from 2012.
His research interests include low-power digital IC design and speech processing.
Shyh-Jye Jou (S’86–M’90–SM’97) received his B.S. degree in electrical engineering from National Chen Kung University in 1982, and M.S. and Ph.D. degrees in electronics from National Chiao Tung University in 1984 and 1988, respectively.
He joined Electrical Engineering from 1990 to 2004 and became a Professor in 1997. Since 2004, he has been a Professor of National Chiao Tung University and became the Chairman of Department of Electronics Engineering from 2006 to 2009. From 2011, he becomes the Vice President, Office of International Affair, National Chiao Tung University. He was a visiting research Professor in the Coordinated Science Laboratory at University of Illinois, Urbana-Champaign, during 1993-1994 and 2010 academic years. In
the summer of 2001, he was a visiting research consultant in the Communi-cation Circuits and Systems Research Laboratory of Agere Systems, USA. He received Outstanding Engineering Professor Award, Chinese Institute of Engineers and Chinese Institute of Electrical Engineering in 2011 and 2013, respectively.
He is an active contributor in IEEE, especially, CAS Society. He served as Chapter Chair of IEEE Circuits and Systems Society Taipei Chapter, 2006, Dis-tinguished Lecturer of CAS society, 2009-2010, Guest Editor of IEEE JOURNAL OFSOLIDSTATECIRCUITS, Nov. 2008, and was Track Chair of Nanoelectronics and Gigascale Systems and Technical Committee member of VLSI Systems and Applications, 2011-2013. He served as the Conference Chair of IEEE ternational Symp. on VLSI Design, Automation and Test (VLSI-DAT) and In-ternational Workshop on Memory Technology, Design, and Testing. He also served as Technical Program Chair or Co-Chair in IEEE VLSI-DAT, Interna-tional IEEE Asian Solid-State Circuit Conference, IEEE Biomedical Circuits and Systems, and other international conferences. He has published more than 100 IEEE journal and conference papers. His research interests include design and analysis of high speed, low power mixed-signal integrated circuits, com-munication and Bio-Electronics integrated circuits and systems.
Tian-Sheuan Chang (S’93–M’06–SM’07) received the B.S., M.S., and Ph.D. degrees in electronic engineering from National Chiao Tung University (NCTU,) Hsinchu, Taiwan, in 1993, 1995, and 1999, respectively.
He was a Deputy Manager with Global Unichip Corporation, Hsinchu, from 2000 to 2004. In 2004, he joined the Department of Electronics Engineering, NCTU, where he is currently a Professor. In 2009, he was a Visiting Scholar in IMEC, Heverlee, Belgium. His current research interests include system-on-a-chip design, VLSI signal processing, and computer architecture.
Dr. Chang was a recipient of the Excellent Young Electrical Engineer from Chinese Institute of Electrical Engineering in 2007, and the Outstanding Young Scholar from Taiwan IC Design Society in 2010. He has been actively involved in many international conferences as an organizing committee or technical pro-gram committee member. He is currently an Editorial Board Member of the IEEE TRANSACTIONS ONCIRCUITS ANDSYSTEMS FORVIDEOTECHNOLOGY.