Relationship Between Local Structural Entropy and
Protein Thermostability
Chen-Hsiung Chan,1Han-Kuen Liang,2,3Nai-Wan Hsiao,1Ming-Tat Ko,3Ping-Chiang Lyu,1Jenn-Kang Hwang2,4* 1Department of Life Sciences, National Tsing Hua University, Hsinchu, Taiwan
2Department of Biological Science and Technology, National Chiao Tung University, Hsinchu, Taiwan 3Institute of Information Science, Academia Sinica, Nankang, Taiwan
4Institute of Bioinformatics, National Chiao Tung University, Hsinchu, Taiwan
ABSTRACT We developed a technique to com-pute structural entropy directly from protein se-quences. We explored the possibility of using struc-tural entropy to identify residues involved in thermal stabilization of various protein families. Examples include methanococcal adenylate kinase, Ribonuclease HI and holocytochrome c551. Our
re-sults show that the positions of the largest struc-tural entropy differences between wild type and mutant usually coincide with the residues relevant to thermostability. We also observed a good linear relationship between the average structural en-tropy and the melting temperatures for adenylate kinase and its chimeric constructs. To validate this linear relationship, we compiled a large dataset com-prised of 1153 sequences and found that most protein families still display similar linear relationships. Our results suggest that the multitude of interactions involved in thermal stabilization may be generalized into the tendency of proteins to maintain local struc-tural conservation. The linear relationship between structural entropy and protein thermostability should be useful in the study of protein thermal stabilization. Proteins 2004;57:684 – 691. ©2004 Wiley-Liss, Inc. Key words: structural entropy; structural
conserva-tion; thermal stability; thermophilic pro-teins; mesophilic proteins
INTRODUCTION
Protein thermal stabilization has been the focus of many experimental and theoretical research works,1–23but the
molecular basis of thermal stability appears to be of diverse origin. Although thermophilic proteins and their mesophilic homologues share a high degree of similarity in both sequence and three-dimensional structure, thermo-philic proteins are intrinsically more stable than their mesophilic homologues. Structural analysis has revealed various structural features that characterize the thermal stability of proteins. Thermophilic proteins tend to have stronger electrostatic interactions (more surface charged residues, surface salt bridges, hydrogen bonds, dipole– dipole interactions or cation- interactions), more disul-fide bridges, higher degrees of hydrophobic packing in the core regions, more pronounced bias in amino acid content on the exposed regions, shorter loop structures, higher conformational rigidity and more secondary structural
elements such as␣-helices and -sheets. However, despite these many structural features, no single outstanding feature can adequately account for the thermal stabiliza-tion of proteins. This is because net thermal stability may result from a multitude of weakly stabilizing interactions, and different protein families may adopt different struc-tural devices for stabilization. Another difficult issue fac-ing the structural analysis of thermal stability is the insufficient amount of structural data available for compre-hensive comparison of different thermophilic proteins and their mesophilic homologues. Given that there are far more sequences than structures available, elucidating the relationship between sequences and protein thermal stabil-ity should be useful in the study of protein thermostabiliza-tion.
MATERIALS AND METHODS Structural Profiles
A sequence pattern a of length l is denoted by a ⫽ (a1,a2,…,ai), where ai 僆 {20 types of amino acids}. The
structural profile of the sequence pattern a is written in the form of a matrix Ma:
Ma⫽ 共p1a,p2a,. . .pia兲.
Here the structural profile vector pi
a⫽ ( 1i a, 2i a,…, ni a) is
the probability distribution of n structural descriptors at
ai, whereji
ais the observed probability of the jth
struc-tural descriptor at ai. The probabilityjiais computed using
jia⫽ cji a cia (1) where cji
ais the occurrences of the jth structural descriptor
for ai, and ci a ⫽
冘
j⫽1 n cji a.In principle, structural descriptors can be any structure-related properties, such as secondary structural elements, backbone torsion angles and accessible solvent areas (ASA).
Chen-Hsiung Chan and Han-Kuen Liang contributed equally to this paper.
*Correspondence to: Jenn-Kang Hwang, Institute of Bioinformatics, National Chiao Tung University, Hsinchu, Taiwan. E-mail: [email protected]
Received 8 April 2004; 15 June 2004; Accepted 16 June 2004 Published online 4 October 2004 in Wiley InterScience (www.interscience.wiley.com). DOI: 10.1002/prot.20263
However, the backbone torsion angles ( and ) are not ideal structural discriminators. The distribution of val-ues for most␣-helices, -sheets and coils lie in the same range of⫺30° to ⫺180°. The distributions of are distinct for ideal ␣-helices (0–⫺60°) and -sheets (120–180°). However, the distributions of for realistic helical, sheet and coil structures are considerably overlapped with each other in the Ramanchandran plot. In the case of ASA, the prediction error using neural networks increases as the residues become more exposed. For example, for residues with less than 10% exposure, the prediction error is within 12%; however, for residues with 70 – 80% exposure, the prediction error increases to 40%.24It has been shown that
the exposed residues depend more on surrounding resi-dues than on neighboring sequences.24,25This means that
local sequences contain uneven distributions of the infor-mation content of ASA. Consequently, this makes ASA a less desirable structure descriptor. Secondary structural elements such as ␣-helices contain explicit information about local interactions (i.e. hydrogen bonds between i and
i⫹ 4 amino acids), and -sheets contain implicit
informa-tion about long-range interacinforma-tions (i.e. one strand implies the existence of another strand hydrogen-bonded to the former). Hence, in this work the structural descriptors were characterized by eight secondary structure types defined by DSSP,26 -bridges, extended -sheets, 3
10
-helices,␣-helices, -helices, bends, turns and others. The number of structural descriptors is n⫽ 8. For patterns with lower occurrence, the Bayesian prediction method27
was used to estimate the probabilities. Introducing a pseudocount Bi a, we rewrite eq. (1) as jia⫽ cji a⫹ B i a ji 0 cia⫹ Bia (2)
whereji0is the background probability of the jth
struc-tural descriptor at position i and Bia ⫽
冑
cia. Structural Entropy ProfileGiven the structural profile of the sequence fragment a, we compute its structural entropy Siausing the following
equation: Si a⫽ ⫺
冘
j⫽1 n⫽8 ji aln ji a (3) The value of Sia is 0 for a perfectly structure-conserved
position, and the value is⬇2.08 for a completely structure-random position. In practice, we compute the structural entropy of a specific residue by averaging over l successive sequence windows along the protein sequence. We illus-trate the computational procedure with an example: Given a sequence “…CRLPGTPEAICATYTGCII…,” imagine we are interested in computing the structural entropy at the “I” position for this sequence. If l ⫽ 4, there are four sequence windows covering this particular residue I, whose structural profile vectors are given by p4
PEAI, p 3 EAIC, p 2 AICA and p1
ICAT, respectively (see Fig. 1). We compute the
average structural profile vector at I by
p ⫽1 4(p4 PEAI⫹ p 3 EAIC⫹ p 2 AICA⫹ p 1 ICAT) (4)
This is equivalent to a weighted average over a seven-residue window where the nearer neighboring seven-residues are given more weight. The structural entropy S at I for the query sequence is then computed by
S⫽ ⫺
冘
j⫽1 8
jlnj (5)
wherejis the jth component of p . We built the library of
structural profile using the SCOP-35 dataset,28which is
the non-redundant subset comprised of sequences with pairwise sequence identities⬍35%. Using the SCOP-35 dataset can help avoid sampling bias due to homologue redundancy. For sequence fragments with lengths 3,4 and 5, the numbers of distinct patterns are 8⫻ 103, 1.6⫻ 105
and 3.2⫻ 106, respectively, and their coverage by SCOP-35
is 99%, 86% and 19%, respectively. In this work, the structural profile library is built for tetrapeptides (l⫽ 4) for the consideration of sufficient sequence coverage and sequence patterns. For sequences of lower occurrence, we used the pseudocount method [eq. (2)] described before to estimate the occurrence probability. The complete flow-chart for computing the structural entropy of a query sequence is shown schematically in Figure 2.
RESULTS AND DISCUSSION
Figure 3 shows the average structural entropy values for the 20 amino acids. Nonpolar amino acids generally have
Fig. 1. An example to compute the structural entropy of a particular residue (I) in a protein sequence. If the length of the sequence window is
l⫽ 4, there are four possible sequence windows covering the residue:
PEAI, EAIC, AIAC and ICAT. The structural profile vectors of I for these sequence fragments are p4
PEAI, p 3 EAIC, p 2 AICAand p 1
ICAT, respectively. The
structural entropy of I can be computed using eqs. (4) and (5).
smaller structural entropy because of their preference to be buried in the core, while charged or polar amino acids have higher structural entropy because of their preference to be on the surface. The smallest amino acid, glycine, has the highest average structural entropy, and this may due to its small size allowing it to adopt a variety of conforma-tions with little steric hindrance. Among the aromatic amino acids, phenylalanine has the highest
hydrophobic-ity29and the lowest average structural entropy. However,
Figure 3 provides only a simplified picture of the general trends in structural entropy of the 20 amino acids. The structural entropy of a particular amino acid is in fact significantly affected by its neighboring sequences, as will be shown in a later section. In cytochrome c551, an F34Y
mutation actually results in the lowering of the structural entropy, despite the fact that phenylalanine has a lower average entropy than tyrosine.
To explore the relationship between structural entropy profile and protein thermal stability, we present three examples: methanococcal adenylate kinases and their chimeric constructs,21,30 ribonuclease HIs and their
chi-meric constructs,31and holocytochrome c
551and its single/
multiple amino acid mutants.6
Case 1: Methanococcal Adenylate Kinases
The methanococcal adenylate kinases (AKs) provide a good model system to study protein thermostabiliza-tion.21,30 The mesophilic Methanococcus voltae (AKvol)
and the extremely thermophilic Methanococcus jannaschii (AKjan) share 61% sequence identity but differ
signifi-Fig. 2. The schematics of calculating the structural entropy profile of a query sequence. We built the tetrapeptide library to include secondary structural elements from the SCOP-35 and DSSP databases. We then built a library of structural profiles for all tetrapeptides. For a query sequence, we can compute the structural entropy of each position from the structural profile library by averaging four successive sequence windows, indicated by four stacked thick lines.
cantly in their thermal stability (their melting tempera-tures are 69°C and 103°C respectively). The structure of AK is characterized by the CORE domains (residues 1–38, 86 –134 and 145–192), the nucleoside monophosphate (NMP)-binding domain (residues 39 – 85) and the LID domain (residue 135–144). Figure 4 shows the computed structural entropy profiles of AKjan (SAKjan) and AKvol
(SAKvol) as well as their entropy difference⌬S ⫽ SAKjan⫺
SAKvol. Most residues of the AKjan sequence have lower
structural entropy than those of the AKvol sequence, especially in the CORE domains. We observed that most of the residues (filled circles) involved in the thermal stabili-zation of AKs21,30 occur at or close to the ⌬S minima.
Figure 5(a,b) shows the colorimetric mapping of⌬S on the tertiary structure of AK (1KI9).21The color of the sphere in
the figure represents the sign of⌬S (red for negative and blue for positive). The size of the spheres indicates the magnitude of ⌬S. As seen in the figures, the large red spheres (or the residues with large negative ⌬S) are usually in close proximity to each other, especially in the N- and C-terminal regions. These results are encouraging, since they indicate that our approach may provide a simple, straightforward means of identifying the residues involved in thermal stabilization.
Case 2: Ribonuclease HI
Kimura and coworkers31have constructed a variety of
chimeric proteins of Escherichia coli ribonuclease HI (EI RNase HI) by substituting the corresponding R1–R9
re-gions from Thermus thermophilus RNase HI (TH RNase HI), an exceptionally thermal stable protein. The enzymes share a 52% sequence identity. It has been shown31that
the replacement of each of four regions (R4–R7) results in
an increase in protein thermostability. R4contains a single
residue P63 located at the loop between helix I and sheet C, R5 covers part of helix II, R6 covers the loop region
between helices III and IV, and R7 contains the region
from helix IV to sheet E. Since these regions are relatively far apart in space, the effect of each replacement on thermostability is independent of the others. The
simulta-neous replacement of all four regions results in the most stable protein, raising the melting temperatures from 52.0°C to 68.7°C. Figure 6 compares the structural entropy profiles of EI RNase HI and the chimeric R4–R7protein.
The structural entropy profile of the chimeric protein also shows very large entropy reduction in the R5, R6and R7
regions of the four substitution regions.
Case 3: Holocytochrome c551
Hasegawa and coworkers6have systematically
substi-tuted the amino acids of Pseudomonas aeruginosa cyto-chrome c551(PA c551) based on the structure of
thermo-philic Hydrogenobacter thermophilus cytochrome c552(HT
c552). Their strategy was based on the observation 32that
small hydrophobic cores in HT c552 are more tightly
packed because of the occupancies of A5, M11 and I76,
Fig. 4. The structural entropy profiles of AKjan (SAKjan, red line), AKvol
(SAKvol, blue line) and their entropy difference (⌬S, black line). Filled
circles show the residues related to thermostabilization.21,30The domains
of AK are indicated by the lines above the x-axis.
Fig. 5. The colorimetric mapping of⌬S between AKjan and AKvol on the tertiary structure of the methanococcal AK (1KI9).21The color and size
of the sphere represent the sign (red for negative and blue for positive) and the magnitude of⌬S, respectively. Two views are shown (a and b); the latter is rotated by 180° from the first. The figures were produced by RASMOL.50
while in PA c552the corresponding amino acids are F7, V13
and V78. In PA c552, F7 overfills the cavity and forces V13
to be displaced from the hydrophobic core.32However, in
HT c552, the occupancy of A5 makes a smaller cavity,
which is filled with M11 without excess void spaces. Using this strategy, they succeeded in constructing several single and multiple amino acid mutants of increased thermosta-bility compared to PA c551. Figure 7 compares the
struc-tural entropy profiles of PA c551and the mutant proteins
(F7A, V13M, F34Y, E43Y and V78I). As shown in the figure, two mutations F7A and F34Y show the largest entropy reduction, which is consistent with the experimen-tal result that these two mutations have the largest⌬Tm
values of all single amino acid mutants. Structural
analy-sis6 shows that the F7A mutation results in tighter
hydrophobic packing, and the F34Y mutation forms a new hydrogen bond between the hydroxyl group of the tyrosine residue and the guanidyl base of R47.
Relationship Between Structural Entropy and Thermal Stability
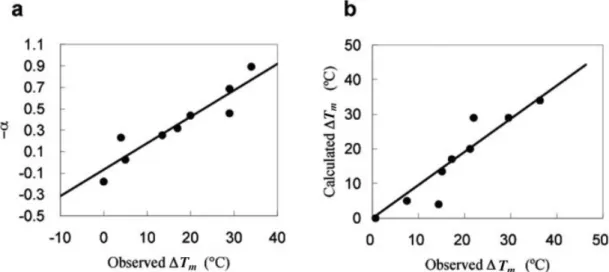
Haney and coworkers30 constructed a number of
chi-meric proteins with melting temperatures varying from those of AKjan and AKvol. These sequences share 68% to 81% sequence identity, and their melting points range from 69°C to 103°C (Table I). Figure 8(a) shows the plot of ⌬Tm versus ␣ for these sequences, where ⌬Tm is the
difference between the melting temperatures of a
particu-Fig. 6. Structural entropy profiles of RNase HI (blue line), the R4–R7mutant proteins (red line) and their
entropy difference⌬S (black line). The residues of the R4, R5, R6and R7regions are shown as filled circles. 31
Fig. 7. Structural entropy profiles of PA c551(blue line) and its mutant proteins (red line) and their entropy
lar sequence and the reference sequence (AKvol), and␣ is the difference in the average structural entropies per amino acid. We use linear regression to model the relation-ship between⌬Tmand␣. The regression line is obtained by
the method of least-squares. Note that in Figure 8(a) the slope of the line is positive, indicating that lower struc-tural entropy is related to higher thermostability. With the linear regression equation, we can compute the predicted melting temperatures. Figure 8(b) compares the observed melting temperatures⌬Tm
o with those computed from the
linear model⌬Tm
c. We observed a very good linear
relation-ship between them. The fitting linear equation for AKs is ⌬Tm
c ⫽ 1.0622⌬T m
o ⫺ 2.5196 and the linear regression
correlation coefficient is r⫽ 0.934.
If the entropy linear model is a general one, the struc-tural entropy will provide a useful measure of the thermal stability. To check this, we compiled a comprehensive dataset comprised of 1153 protein sequences with varying melting temperatures. These sequences included members
of the following families: adenylate kinases,30cytochrome
c551,6RNase HI,31 staphylococcal nuclease,1
alpha-amy-lase,23arc repressor,33rubredoxin variant (PFRD-XC4)34
and human fibroblast growth factor 1,35 ligase,36
gluta-mate dehydrogenase,37alcohol dehydrogenase,38
histone-like bacterial DNA-binding protein,39Fyn SH3 domain,40
cold-shock protein Bs-CspB,12,41malate dehydrogenase,42
cytochrome P450,43WW domain,44bovine pancreatic
tryp-sin inhibitor45,46 and phytase47 and other families from
the ProTherm database.48 Each family contains highly
homologous sequences: the wild-type protein and its mu-tants (either single/multiple point mutations or chimeric constructs). These sequences are listed in the supplemen-tary material. For each family, we computed the linear regression of ⌬Tm on ␣. From this linear model, we
computed their melting temperatures. Figure 9 compares the calculated and observed melting temperatures of the sequences of the dataset. The linear regression correlation coefficients between the calculated and observed melting temperatures are r⫽ 0.721 and p ⫽ 0.143 ⫻ 10⫺3.
On close examination of the results, we found that, for the sequences displaying the best linear relationship be-tween␣ and ⌬Tm, the mutated residues usually result in
more hydrophobic packing1,30 or conformational
rigid-ity.33,34,36,38 On the other hand, if the mutated residues
are involved in electrostatic interactions, some examples, such as rubredoxin34 still show relatively good linear
relationships. Experiment34has shown that the
thermosta-bilization of the mutant rubredoxin comes from a surface salt bridge involving the protein’s backbone, which re-duces the entropic cost. However, other examples, such as the cold shock protein Bs-CspB,12,41show little correlation
between␣ and ⌬Tm. The increased thermal stability of
mutant Bs-CspB is due to electrostatic networks arising from the mutated surface residues. The linear entropy model computed from sequences obviously cannot account for the long-range stabilization from such intricate struc-tural features. We noticed that the linear entropy model
Fig. 8. (a) The⫺␣ vs. ⌬Tmplots for AKjan, AKvol and their chimeric proteins.⌬Tmis in degrees Celsius, and␣ is in arbitrary units. (b) Comparison of the calculated melting temperature computed from the linear model and the observed melting temperature. The correlation coefficients of both plots are
r⫽ 0.934.
TABLE I. Melting Temperatures of AKs and Their Chimeric Constructs Proteinsa T m(°C) AKvol 69.0 J36V 73.0 V160V 74.0 JVJ 89.0 V36J 98.0 J160V 96.0 VJV 82.5 AKjan 103.0
aThe melting temperatures of AKvol, AKjan and their chimeric
constructs.30A 36 residue N-terminal residue region (1–36) or a 32
residue C-terminal region (161–192) was swapped to produce the chimeric proteins. The notation J36V represents AKjan sequence through residue 36 followed by the remaining AKvol sequence. For the double chimera like JVJ, it represents AKjan through residue 36, AKvol through 160, and AKjan residues 161–192. Similar logic applies for the nomenclature of the other chimeras.
may also be inapplicable to some polymeric proteins, such as malate dehydrogenase,42 whose stabilization comes
from ionic interactions across the dimer– dimer interface. Though various interactions enhancing protein thermo-stability exhibit themselves as different structural fea-tures. Our results show that local structural entropy may be used as a generalized measure of thermal stability. Since structure conservation reflects the effects of both the intrinsically stable (context-independent) sequence pat-terns and the long-range generic contributions (context-dependent) from surrounding residues,49 structural
en-tropy provides a convenient structural measure of thermal stability. Although the structural entropy profile alone could be related to functional factors as well as structural factors, the structural entropy differences between meso-philic and thermomeso-philic homologues augment information from structural features involved in structural stabiliza-tion. Our approach offers a straightforward way to com-pute the structural entropy directly from the query se-quence and may be used as a useful tool to screen mutant candidates for thermophilic sequences in a high through-put way.
Website
Both the web-implemented program and the compiled entropy library are available at http://SDSE.life.nctu. edu.tw/.
ACKNOWLEDGMENTS
This work was supported by the National Science Coun-cil, the National Genomic Medicine Project and a UST-VGH grant. We acknowledge both hardware and software support from the Structural Bioinformatics Core Facilities at NCTU and NTHU.
REFERENCES
1. Tanaka A, Flanagan J, Sturtevant JM. Thermal unfolding of staphylococcal nuclease and several mutant forms thereof studied by differential scanning calorimetry. Protein Sci 1993;2:567–76. 2. Delboni LF, Mande SC, Rentier-Delrue F, Mainfroid V, Turley S,
Vellieux FM, Martial JA, Hol WG. Crystal structure of recombi-nant triosephosphate isomerase from Bacillus
stearothermophi-lus. An analysis of potential thermostability factors in six
isomer-ases with known three-dimensional structures points to the importance of hydrophobic interactions. Protein Sci 1995;4:2594 – 604.
3. Lim JH, Yu YG, Han YS, Cho S, Ahn BY, Kim SH, Cho Y. The crystal structure of an Fe-superoxide dismutase from the hyper-thermophile Aquifex pyrophilus at 1.9 Å resolution: structural basis for thermostability. J Mol Biol 1997;270:259 –74.
4. Chang C, Park BC, Lee DS, Suh SW. Crystal structures of thermostable xylose isomerases from Thermus caldophilus and
Thermus thermophilus: possible structural determinants of
ther-mostability. J Mol Biol 1999;288:623–34.
5. Haney PJ, Badger JH, Buldak GL, Reich CI, Woese CR, Olsen GJ. Thermal adaptation analyzed by comparison of protein sequences from mesophilic and extremely thermophilic Methanococcus spe-cies. Proc Natl Acad Sci USA 1999;96:3578 –3583.
6. Hasegawa J, Shimahara H, Mizutani M, Uchiyama S, Arai H, Ishii M, Kobayashi Y, Ferguson SJ, Sambongi Y, Igarashi Y. Stabilization of Pseudomonas aeruginosa cytochrome c(551) by systematic amino acid substitutions based on the structure of thermophilic Hydrogenobacter thermophilus cytochrome c(552). J Biol Chem 1999;274:37533–37537.
7. McDonald JH, Grasso AM, Rejto LK. Patterns of temperature adaptation in proteins from Methanococcus and Bacillus. Mol Biol Evol 1999;16:1785–1790.
8. Cambillau C, Claverie JM. Structural and genomic correlates of hyperthermostability. J Biol Chem 2000;275:32383– 6.
9. Das R, Gerstein M. The stability of thermophilic proteins: a study based on comprehensive genome comparison. Funct Integr Genom-ics 2000;1:76 – 88.
10. Declerck N, Machius M, Wiegand G, Huber R, Gaillardin C. Probing structural determinants specifying high thermostability in Bacillus licheniformis alpha-amylase. J Mol Biol 2000;301:1041– 57.
11. Kumar S, Tsai CJ, Nussinov R. Factors enhancing protein thermo-stability. Protein Eng 2000;13:179 –91.
Fig. 9. The calculated⌬Tmversus the observed⌬Tmfor 1153 protein sequences. The calculated⌬Tmis computed from the linear regression of⌬Tmon a for each family. The linear regression correlation coefficients are r⫽ 0.721 and p ⫽ 0.143 ⫻ 10⫺3.
12. Perl D, Mueller U, Heinemann U, Schmid FX. Two exposed amino acid residues confer thermostability on a cold shock protein. Nat Struct Biol 2000;7:380 –3.
13. Szilagyi A, Zavodszky P. Structural differences between meso-philic, moderately thermophilic and extremely thermophilic pro-tein subunits: results of a comprehensive survey. Structure Fold Des 2000;8:493–504.
14. Kreil DP, Ouzounis CA. Identification of thermophilic species by the amino acid compositions deduced from their genomes. Nucleic Acids Res. 2001;29:1608 –1615.
15. Kumar S, Sham YY, Tsai CJ, Nussinov R. Protein folding and function: the N-terminal fragment in adenylate kinase. Biophys J 2001;80:2439 –54.
16. Kumar S, Tsai CJ, Nussinov R. Thermodynamic differences among homologous thermophilic and mesophilic proteins. Biochem-istry 2001;40:14152– 65.
17. Lehmann M, Wyss M. Engineering proteins for thermostability: the use of sequence alignments versus rational design and di-rected evolution. Curr Opin Biotechnol 2001;12:371–5.
18. Vieille C, Zeikus GJ. Hyperthermophilic enzymes: sources, uses, and molecular mechanisms for thermostability. Microbiol Mol Biol Rev 2001;65:1– 43.
19. Chakravarty S, Varadarajan R. Elucidation of factors responsible for enhanced thermal stability of proteins: a structural genomics based study. Biochemistry 2002;41:8152– 61.
20. Rosato V, Pucello N, Giuliano G. Evidence for cysteine clustering in thermophilic proteomes. Trends Genet 2002;18:278 –281. 21. Criswell AR, Bae E, Stec B, Konisky J, Phillips GN, Jr. Structures
of thermophilic and mesophilic adenylate kinases from the genus
Methanococcus. J Mol Biol 2003;330:1087–99.
22. La D, Silver M, Edgar RC, Livesay DR. Using motif-based methods in multiple genome analyses: a case study comparing orthologous mesophilic and thermophilic proteins. Biochemistry 2003;42:8988 –98.
23. Machius M, Declerck N, Huber R, Wiegand G. Kinetic stabiliza-tion of Bacillus licheniformis alpha-amylase through introducstabiliza-tion of hydrophobic residues at the surface. J Biol Chem 2003;278: 11546 –53.
24. Ahmad S, Gromiha MM, Sarai A. Real value prediction of solvent accessibility from amino acid sequence. Proteins 2003;50:629 –35. 25. Gromiha MM, Oobatake M, Kono H, Uedaira H, Sarai A. Role of structural and sequence information in the prediction of protein stability changes: comparison between buried and partially buried mutations. Protein Eng 1999;12:549 –55.
26. Kabsch W, Sander C. Dictionary of protein secondary structure: pattern recognition of hydrogen-bonded and geometrical features. Biopolymers 1983;22:2577–2673.
27. Tatusov RL, Altschul SF, Koonin EV. Detection of conserved segments in proteins: iterative scanning of sequence databases with alignment blocks. Proc Natl Acad Sci USA 1994;91:12091–5. 28. Brenner SE, Koehl P, Levitt M. The ASTRAL compendium for protein structure and sequence analysis. Nucleic Acids Research 2000;28:254 –256.
29. Black SD, Mould DR. Development of hydrophobicity parameters to analyze proteins which bear post- or cotranslational modifica-tions. Anal Biochem 1991;193:72– 82.
30. Haney PJ, Stees M, Konisky J. Analysis of thermal stabilizing interactions in mesophilic and thermophilic adenylate kinases from the genus Methanococcus. J Biol Chem 1999;274:28453– 8. 31. Kimura S, Nakamura H, Hashimoto T, Oobatake M, Kanaya S.
Stabilization of Escherichia coli ribonuclease HI by strategic replacement of amino acid residues with those from the thermo-philic counterpart. J Biol Chem 1992;267:21535– 42.
32. Hasegawa J, Yoshida T, Yamazaki T, Sambongi Y, Yu Y, Igarashi Y, Kodama T, Yamazaki K, Kyogoku Y, Kobayashi Y. Solution structure of thermostable cytochrome c-552 from Hydrogenobacter
thermophilus determined by 1H-NMR spectroscopy. Biochemistry
1998;37:9641–9.
33. Brown BM, Sauer RT. Tolerance of Arc repressor to multiple-alanine substitutions. Proc Natl Acad Sci USA 1999;96:1983– 8. 34. Strop P, Mayo SL. Contribution of surface salt bridges to protein
stability. Biochemistry 2000;39:1251–5.
35. Culajay JF, Blaber SI, Khurana A, Blaber M. Thermodynamic characterization of mutants of human fibroblast growth factor 1 with an increased physiological half-life. Biochemistry 2000;39: 7153– 8.
36. Georlette D, Damien B, Blaise V, Depiereux E, Uversky VN, Gerday C, Feller G. Structural and functional adaptations to extreme temperatures in psychrophilic, mesophilic, and thermo-philic DNA ligases. J Biol Chem 2003;278:37015–23.
37. Vetriani C, Maeder DL, Tolliday N, Yip KS, Stillman TJ, Britton KL, Rice DW, Klump HH, Robb FT. Protein thermostability above 100 degrees C: a key role for ionic interactions. Proc Natl Acad Sci USA 1998;95:12300 –5.
38. Bogin O, Peretz M, Hacham Y, Korkhin Y, Frolow F, Kalb AJ, Burstein Y. Enhanced thermal stability of Clostridium beijer-inckii alcohol dehydrogenase after strategic substitution of amino acid residues with prolines from the homologous thermophilic
Thermoanaerobacter brockii alcohol dehydrogenase. Protein Sci
1998;7:1156 – 63.
39. Kawamura S, Abe Y, Ueda T, Masumoto K, Imoto T, Yamasaki N, Kimura M. Investigation of the structural basis for thermostabil-ity of DNA-binding protein HU from Bacillus stearothermophilus. J Biol Chem 1998;273:19982–7.
40. Northey JG, Di Nardo AA, Davidson AR. Hydrophobic core packing in the SH3 domain folding transition state. Nat Struct Biol 2002;9:126 –30.
41. Martin A, Kather I, Schmid FX. Origins of the high stability of an in vitro-selected cold-shock protein. J Mol Biol 2002;318:1341–9. 42. Dalhus B, Saarinen M, Sauer UH, Eklund P, Johansson K,
Karlsson A, Ramaswamy S, Bjork A, Synstad B, Naterstad K, Sirevag R, Eklund H. Structural basis for thermophilic protein stability: structures of thermophilic and mesophilic malate dehy-drogenases. J Mol Biol 2002;318:707–21.
43. Yano JK, Blasco F, Li H, Schmid RD, Henne A, Poulos TL. Preliminary characterization and crystal structure of a thermo-stable cytochrome P450 from Thermus thermophilus. J Biol Chem 2003;278:608 –16.
44. Jiang X, Kowalski J, Kelly JW. Increasing protein stability using a rational approach combining sequence homology and structural alignment: Stabilizing the WW domain. Protein Sci 2001;10:1454 – 65.
45. Yu MH, Weissman JS, Kim PS. Contribution of individual side-chains to the stability of BPTI examined by alanine-scanning mutagenesis. J Mol Biol 1995;249:388 –97.
46. Kuroda Y, Kim PS. Folding of bovine pancreatic trypsin inhibitor (BPTI) variants in which almost half the residues are alanine. J Mol Biol 2000;298:493–501.
47. Jermutus L, Tessier M, Pasamontes L, van Loon AP, Lehmann M. Structure-based chimeric enzymes as an alternative to directed enzyme evolution: phytase as a test case. J Biotechnol 2001;85:15– 24.
48. Gromiha MM, Uedaira H, An J, Selvaraj S, Prabakaran P, Sarai A. ProTherm, thermodynamic database for proteins and mutants: developments in version 3.0. Nucleic Acids Res 2002;30:301-2. 49. Compiani M, Fariselli P, Martelli PL, Casadio R. An entropy
criterion to detect minimally frustrated intermediates in native proteins. Proc Natl Acad Sci USA 1998;95:9290 – 4.
50. Sayle R, Bissel A. RasMol: A program for fast realistic rendering of molecular structures with shadows. Proceedings of the 10th Eurographics UK’92 Conference 1992.