手徵性液晶分子之極性排列和外場誘導轉向之能量學研究
計劃編號: NSC89-2112-M-009-069
執行期限: 民國八十九年八月一日至九十年十月三十一日
主持人: 黃中垚
傳真: 03-5716631
電子郵遞地址: [email protected]
執行機關: 交通大學光電工程研究所
摘要
在本年度報告中我們報導以各種配向技術製作之液晶薄膜的錨定能量、分子排 列、 和場致轉向之最近研究成果。光致配向可產生與摩擦配向一樣大之液晶錨定能。 在九十度扭轉角之液晶薄膜研究中,我們發現表面錨定能不能單純的分解成簡單的傾 角與扭角錨定能之和。在一百八十度扭轉的液晶薄膜內,液晶分子並不以指向矢方向 為旋轉軸作自由旋轉。 在液晶薄膜的應用中,場致轉向的詳細過程是瞭解液晶薄膜光學反應的必備知 識。我們應用時析富氏轉換紅外吸收光譜和拉曼散射光譜術於一百八十度扭轉的液晶 薄膜,發現液晶分子內各官能基在場致轉向過程並不依循剛體旋轉之模式。因此對液 晶分子內部各官能基在場致轉向過程的瞭解有助於研究人員進一步改進液晶元件之動 態響應。我們計畫將此技術延伸於探討鐵電性與反鐵電性液晶薄膜,以促進前瞻性平 面顯示器物理之研究。Ener getic Studies of Polar Alignment and Field-Induced Re-or ientation of
Chir al Liquid Cr ystal Molecules
NSC89-2112-M-009-069
(Aug. 1, 2000 to Oct 31, 2001)Investigator: Jung Y. Huang
Organization: Institute of Electro-Optical Engineering Chiao Tung University
Hsinchu, Taiwan 30050, R.O.C. Tel: 03-5719755
Fax: 03-5716631
E-mail: [email protected]
Abstr act
In this annual report, we present our recent research results of the anchoring energetic, molecular alignment and field-induced re-orientation in a thin LC film on varying polymeric alignment layers. The photo-induced anisotropy on a photo-alignment film can be controlled by varying the exposure of incident linearly-polarized ultraviolet light. The resulting anchoring properties were studied with optical retardance-voltage (RV), optical transmission-voltage (TV) measurements, polarized infrared absorption spectroscopy and Raman scattering spectroscopy. Our results indicate that the surface anchoring energy on a UV-defined layer can be as large as that on a rubbed polymeric surface. In addition, the anchoring energy in a twist nematic cell can not be decomposed into a simple summation of azimuthal and polar anchoring terms. The LC molecules in a twist pi-cell were found to
exhibit a biased rotation with an angular distribution of f(γ)=cos2γ relative to the LC director.
An important question is that how liquid crystal molecules are reoriented during field-induced switching. It is still unclear about the detailed reorientation process of the chain and core parts of liquid crystal. To understand the underlying dynamics at the molecular level, we are employing time-resolved Raman scattering and Fourier transform infrared absorption spectroscopy to produce time-resolved spectra of liquid crystal molecules. Based on the primitive results with a twist pi-cell useful information about the field-induced reorientation dynamics of each atomic segment on the LC molecule can indeed be deduced. Further applications on antiferroelectric and ferroelectric liquid crystals are currently undertaken.
Contents
I. IntroductionII. Anchoring Properties of Homogeneously Aligned Liquid Crystals
2.1 Polar Anchoring Energy of Homogeneously Aligned Liquid Crystals on a Photo-defined Polymeric Surface
2.2 Pretilt Measurement 2.3 T-V Curve Measurement 2.4 Photo-stability Study 2.5 Thermal Stability Study
III. Polar Alignment and Field-Induced Re-orientation in a Chiral Pi-Cell 3.1 Molecular Alignment of Liquid Crystal Molecules in a Chiral Pi-Cell 3.2 Polarized Fourier-Transform Infrared Absorption Spectroscopy 3.3 Time-Resolved Raman Scattering Spectroscopy
IV. Conclusions and future prospect References
I. Introduction
Thin functional films, such as polymers, liquid crystals, and ferroelectric materials, possess high application potential. However, usefulness of these thin film systems critically depends on the orientation and spatial distribution of their constituents. The information unfortunately is quite difficult to be obtained. In this annual report, a variety of techniques are specifically developed for probing the anchoring energetic and orientation distribution of functional liquid crystal films. These techniques include optical retardance measurement, polarized and time-resolved Fourier-transform infrared (FTIR) absorption and Raman spectroscopy.
With the optical retardance measurement method, the anisotropy in the plane of a thin film can be deduced. The in-plane optical anisotropy reflects the distribution of molecular segments that possess most polarizable electronic structure and therefore significantly contribute to the index of refraction of the material. To answer which functional groups are involved to produce the observed optical anisotropy; polarized FTIR with the molecular specificity is employed to provide more detailed picture. Usually structure and orientation of atomic groups on thin complex films determine the properties related to applications.
Specific application of these methods on a twist pi LC cell is presented. From the analysis of polarized FTIR spectra, we show that the LC molecules are not freely rotating along the director. Instead a biased rotation with a cosine square distribution is better to fit into the observed infrared intensity and dichroic ratio measurements.
Finally, to reveal the dynamics of a field-induced reorientation in a liquid crystal film, we construct a time-resolved Raman and FTIR spectroscopies. From this primitive study, the underlying reorientation process in the twist pi-cell at the molecular level can indeed be deduced. In the near future, we hope by combining these techniques to answer how surface anchoring, molecular chirality, and polar alignment in an antiferroelectric (ferroelectric) LC film affect the field-induced switching of the chiral liquid crystal
molecules.
II. Polar Anchoring Properties of Homogeneously Aligned Liquid Crystal Molecules The orientation of liquid crystal molecules is usually depicted within the formalism of the mean-field theory with appropriate free energies of various deformations. To further improve the accuracy of the model on the surface-induced alignment phenomena, a surface free energy term is included [1]
=
∫
+ + d s s bdz f f d f F 0 ) ( ) 0 ( , (2.1.1)where
f
b denotes the free energy density of bulk elastic deformation, andf
s(0),f
s(d
) represent surface free energy per unit area for the upper and lower boundaries. A suitable model can be employed to deduce the detailed form off
s. (ˆ ˆ)2 2 1 e n A fs = − ⋅ , (2.1.2) where A denotes the anchoring strength of liquid crystal molecules on the alignmentsurface. The typical magnitude of the anchoring strength on a polymeric alignment layer is approximately A=10-6→10-3 pN/µm [2]. In the case of a weak anchoring strength, the surface liquid crystal molecules can be pulled away from their original direction by an externally applied field (see the Figures shown below).
Fig. 2-1 Schematic showing the field-induced reorientation of liquid crystal molecules in homogeneously aligned LC cells with different anchoring strengths.
The polar-angle profiles of the director n in a homogeneously aligned LC cell with different
anchoring strengths are depicted in the following
polar anchoring energy = 1×10⁻³(J /m2) 0V
3.8V
2.0V
polar anchoring energy =1×10⁻⁵(J /m2)
Fig. 2.2 The polar-angle profiles of the director n in a homogeneously aligned LC cell with different anchoring strengths.
Several techniques [1][3][4] exist for probing the polar anchoring strength. Most of these methods utilize the field-induced variations in the optical properties of liquid crystal cell. For a liquid crystal cell with finite anchoring strength, all molecules in
bulk and on alignment surfaces can be oriented to be parallel to an applied electrical field at a sufficiently high strength. This voltage is termed as the saturated voltage and can be related to the anchoring strength of liquid crystal molecule [3]. This can be implemented by measuring the field-induced phase retardation a function of applied voltage (i.e., the R-V method). The underlying principle can be depicted as follows:
The free energy of an elastically deformed liquid crystal medium under an applied electrical field can be expressed as
[( cos sin )( ) ] 2 1 2 2 33 2 11 0 0 E D dz d K K dz f F d d b = + − • =
∫
∫
θ θ θ , (2.1.3) where ( sin ) 2 1 2 1 2 2 0 2 ⊥ • + ∆ − = fθ ε E ε θ ε fb , (2.1.4) 0V 1.3V 2.0V 3.3Vand D=ε0(ε⊥E+∆ε(n•E)n). (2.1.5) By applying Euler-Lagarange Equation
=0 ∂ ∂ − ∂ ∂ • θ θb b f dz d f , (2.1.6)
we can discover the director profile that leads to minimum free energy. Eq.2.1. 6 can be further simplified as
[( ) ] ) sin cos ( 2 2 sin 2 0 2 33 11 2 33 2 11 2 2 z E K K K K dz d θ ε ε θ θ θ θ − + ∆ + − = • . (2.1.7)
Note that the normal component of the electrical field Ez can be deduced from the applied voltage via
∫
=∫
+∆ = ⊥ d d z z D dz E V 0 0 2 0 sin 1 θ ε ε ε . (2.1.8)On the alignment surfaces, the free energy per area fs and the bulk restoring force produces a torque balance equation [5]
) sin ( ) cos ( ) ( 2 sin 2 1 2 33 2 11 0 0 θ θ θ θ θ K K A dz d e z + − − = = (2.1.9) ) sin ( ) cos ( ) ( 2 sin 2 1 2 33 2 11 θ θ θ θ θ K K A dz d e d z + − = = . (2.1.10)
Here
θ
edenotes the easy direction on the alignment layer. Eq. 2.1.7 to 2.1.10 can be solved under given applied voltages to deduce the director profiles and therefore the corresponding optical retardance. Some simulated results are shown in Fig. 2-3.0.00 0.05 0.10 0.15 0.20 0.25 Inverse Voltage (1/V) 0 20 40 Re tar d an c e ( De gree s ) K11=7 pN Az=5 pN/um K11=7 pN Az=50 pN/um K11=7 pN Az=500 pN/um K11=7 pN Az=20 pN/um K11=7 pN Az=10 pN/um K11=7 pN Az=30 pN/um
HN Cell Cell thickness=10 um
Fig. 2.3 Calculated retardance-inverse voltage curves of homogeneously aligned liquid crystals with varying polar anchoring energies.
2.1 Polar Anchor ing Ener gy of Homogeneously Aligned Liquid Cr ystals on a
Photo-Defined Polymer ic Sur face
Homogeneously aligned liquid crystal cells had been assembled with Rolic 5021 photo-polymer as the alignment layer. The photo photo-polymer was used for controlling the surface anchoring strength by exposing the alignment layers to linearly polarized ultraviolet light (LPUV, wavelength centered at 325 nm with 100-nm bandwidth) with varying energy exposure. Polarized optical microscopy was employed to examine the alignment effect on LC cells with varying exposure.
Uniform alignment can be reliably achieved with an exposure larger than 0.9J/cm2.
The polar anchoring at an exposure of 2.25 J/cm2 is measured and the result is presented in
Fig. 2-4. From the Figure, we can determine the polar anchoring strength on the Rolic 5021 photo alignment layer to lie between 4-6×10⁻⁴pN/µm.
Fig. 2-4 Measured (symbols) and calculated curves of optical retardance as a function of inverse voltage.
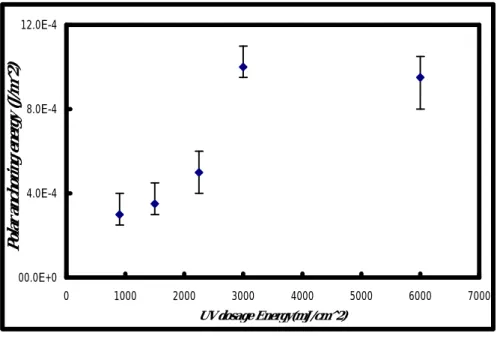
The polar anchoring strength can also be changed with the LPUV exposure on the alignment layers. The measured results are summarized in Fig. 2-5.
Fig. 2-5 The resulting anchoring strength as a function of LPUV exposure.
00.0E+0 4.0E-4 8.0E-4 12.0E-4 0 1000 2000 3000 4000 5000 6000 7000 UV dosage Energy(mJ /cm^ 2)
Polar anchoring energy (J/m^2)
UV 2250(mJ/cm^2)_R-1/V 0 5 10 15 20 25 30 35 0.01 0.02 0.03 0.04 0.05 0.06 0.07 1/V Optical Retardation(deg)
From the Figure, we found that the polar anchoring strength on an LPUV-exposed Rolic 5021 layer can be as large as 10-3 J/m2 (1 J/m2=1 pN/µm). Note that this anchoring strength approaches the alignment power provided by a rubbed polymer surface.
2.2 Pretilt Measur ement
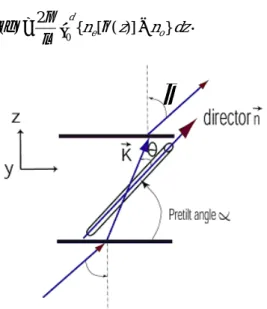
The optical retardance of a light beam propagating through a uniaxially aligned liquid crystal film can be calculated to be [6]
( ) 2 d{ne[ (z)] no}dz 0
∫
− = θ λ π φ δ . (2.2.1)Fig. 2.6 Schematic showing the beam propagation direction and LC pretilt geometry
Fig. 2.7 Beam propagation geometry in a uniaxial slab
In a homogeneously aligned LC cell, the index of refraction of the e-ray can be expressed as 1 cos ] 1 ) / [( ) ( 2 2− + = θ θ o e e eff n n n n , (2.2.2)
where θ is the angle between
K
ev
and the LC director at thickness z.
cosθ(z)=nv•Kv =cosαsinϕe+sinαcosϕe, (2.2.3) The difference between the optical path lengths of o-ray and e-ray becomes
dz d o o o n e e eff n o e− =
∫
− − − 0 )] sin tan cos ( ) sin tan cos ) ( [( ϕ ϕ ϕ ϕ ϕ ϕ θ l l =∫
d neff e−no o dz 0( (θ)cosϕ cosϕ ) . (2.2.4) Assuming the pretilt is independent of z, then] sin sin cos sin 1 sin cos sin cos sin cos sin ) ( [ 2 ) ( 2 2 2 2 2 2 2 2 2 2 2 2 2 2 2 2 2 ϕ α α ϕ α α α α ϕ α α λ π ϕ δ − − + − + + + − = o e o e o o e e o o e n n n n n n n n n n n d (2.2.5)
The maximum of the optical retardance occurs at φ =φx
0 sin sin ) sin cos ( sin sin cos sin cos sin ) ( 2 2 2 2 2 2 2 2 2 2 2 2 2 2 = − + + − + − − x o x e o x e o x e e o o e n n n n n n n n n n ϕ ϕ α α ϕ α α ϕ α α (2.2.6)
When the pretilt is small, Eq. (2.2.6) can be reduced to
x o e n n ϕ αα 1 sin sin 0 +
≅
→ , (2.2.7)Experimentally, φ can be easily determined by measuring the optical transmission throughx a 45o
-oriented LC cell, which is inserted between a cross polarizer-analyzer set up )] ( 2 1 [ sin 2 1 ) (ϕ = 2 δ ϕ T . 0 0.05 0.1 0.15 0.2 0.25 0.3 0.35 0.4 0.45 0.5 -55 -50 -45 -40 -35 -30 -25 -20 -15 -10 -5 0 5 10 15 20 25 30 35 40 45 50 55 x
ϕ
Fig. 2.8 Measured transmission curve T(ϕ) as a function of the incident angle ϕ.
For larger pretilt (α > 15o
), the optical transmission curve can be calculated to be
]} sin sin cos sin 1 sin cos sin cos sin cos sin ) ( [ 2 { 2 1 sin 2 1 ) ( 2 2 2 2 2 2 2 2 2 2 2 2 2 2 2 2 2 2 ϕ α α ϕ α α α α ϕ α α λ π φ − − + − + + + − = o e o e o o e e o o e n n n n n n n n n n n d T . (2.2.8)
We can apply Eq. (2.2.8) to deduce the pretilt angle from the measured T(ϕ) curve when the cell gap d is known.
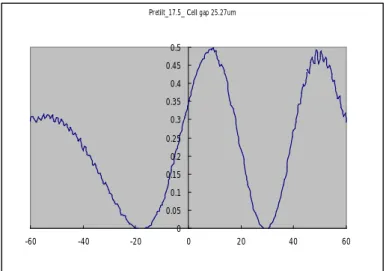
For an illustration, Fig. 2.9 presents a measured T(ϕ) curve for a LC cell under an applied voltage of 1.2 V.
Pretilt_17.5_ Cell gap 25.27um
0 0.05 0.1 0.15 0.2 0.25 0.3 0.35 0.4 0.45 0.5 -60 -40 -20 0 20 40 60
Fig. 2.9 Measured T(ϕ) curve for a homogeneously aligned LC cell with an applied voltage of V=1.2 V.
By using Eq. (2.2.8), we can produce a simulated curve (see Fig. 2.10) with a pretilt angle of 17.5o and cell gap of d=25.3 µm to match to the measured curve. The comparison
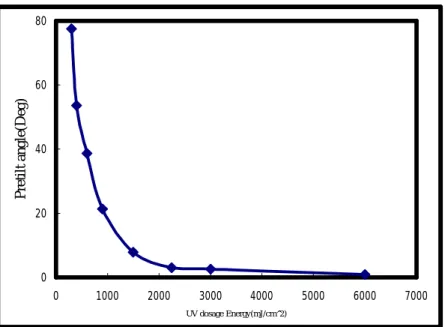
Fig. 2.10 Calculated T(ϕ) for a LC cell with a pretilt angle of 17.5o and cell gap of d= 25.3 µm We employed the technique to measure the pretilt angle of LC cells, which were aligned with Rolic 5021 films at different UV exposure. The results are presented in Fig. 2.11.
Fig. 2.11 Pretilt angle of LC cells aligned with Rolic 5021 films exposed to LPUV at different exposure
It shows that the pretilt closes to 80o
at very low UV light exposure on this photo-polymer surface. The pretilt angle decreases as the UV exposure is increased and the alignment is improved.
2.3Tr ansmission-Voltage (T-V) Measur ement
T-V curve carries the information about the reorientation of LC molecules at varying
0 20 40 60 80 0 1000 2000 3000 4000 5000 6000 7000 UV dosage Energy(mJ/cm^2) Pretilt angle(Deg)
applied voltage. Strong anchoring implies that the anchoring direction of LC molecules on the alignment layer is more difficult to be changed with an external field. Therefore the anchoring properties of LC molecules can affect the T-V profile. Fig. 2.12 shows the calculated and measured T-V curves with a LC cell, which was prepared with Rolic 5021 films exposed to 1.5 J/cm2. From the comparison, the anchoring strength of the LC cell is more near to 1×10⁻⁴
pN/µm. By increasing the LPUV exposure to 3 J/cm2
, the resulting TV curve changes as expected from an increasing anchoring strength A=10−4→10−3pN/µm.
The comparison is presented in Fig. 2.13.
UV 1500mJ_TVcurve 0 0.1 0.2 0.3 0.4 0.5 3 4 5 6 7 8 9 10 V T 實驗 模擬W10^-3 模擬_W10^-4
Fig. 2.12 Calculated (lines) and measured (symbols) T-V curves for a LC cell homogeneously aligned with Rolic 5021 film exposed to 1.5 J/cm2.
0.08 0.12 0.16 8 8.5 9 9.5 10 V T
UV 3000mJ_TVcurve 0 0.1 0.2 0.3 0.4 0.5 3 4 5 6 7 8 9 10 V T 實驗 模擬W10^-3 模擬W10^-4
Fig. 2.13 Calculated (lines) and measured (symbols) T-V curves for a LC cell homogeneously aligned with Rolic 5021 film exposed to 3 J/cm2
2.4Azimuthal Anchor ing Ener gy in a Twist Nematic Liquid Cr ystal Cell
In a twist 90o
nematic LC cell, the easy axes of the alignment layers are normal to each other. The polar and azimuthal anchoring properties can be modeled with a surface free energy density. A proper form of the surface free energy is expressed as
2 (ˆ ˆ)2 2 1 ) ˆ ˆ ( 2 1 z n A y n A fs = a ⋅ + p ⋅ . (2.4.1) The director profile n[θ(z),φ(z)] in a TN cell can be determined from Euler-Lagrange equation 0 ) 2 sin( ) ( ) ( ) ( 0 ) 2 sin( ) 2 sin( ) ( 2 1 ) ( 2 1 ) ( 2 1 ) ( 2 2 2 2 2 0 2 2 2 2 = + + = + ∆ ⋅ + − + dz d k dz d dz d d dh dz d h dz d k z E dz d d dh dz d d df dz d f θ θ φ θ θ φ θ φ θ θ ε ε φ θ θ θ θ θ , (2.4.2) where θ θ 2θ 22 2 11cos sin ) ( K K f = + , θ θ θ 2θ 33 2 22 2 ( cos sin cos ) ( K K h = + , and k2 =−2πK22 p with p
denoting the pitch of chiral dopant added. The equations can be solved with boundary conditions from surface torque balance equations
0.06 0.09 0.12 0.15
) 2 sin( ) ( cos | ) ( ] sin )[ 2 sin( | ) ( 2 0 2 0 φ θ φ θ φ θ θ θ a z p a z A dz d h A A dz d f = − = = = ) 2 sin( ) ( cos | ) ( ] sin )[ 2 sin( | ) ( 2 2 φ θ φ θ φ θ θ θ a d z p a d z A dz d h A A dz d f = − − = = = . (2.4.3)
Eqs. (2.4.2) and (2.4.3) have been solved to yield the director profile at varying surface anchoring strengths. The results of the field-free condition are presented in Fig. 2.14.
0 5 10 15 20 z position ( µm ) 0 4 8 P o la r A n g le ( De g .) A(phi)=3 pN/um A(phi)=10 pN/um A(phi)=30 pN/um Aθ=300 pN/um 0 5 10 15 20 z position ( µm ) -90 -45 0 A z imu th a l A n g le ( De g .) A(phi)=3 pN/um A(phi)=10 pN/um A(phi)=30 pN/um Aθ=300 pN/um
Fig. 2.14 The polar and azimuthal profiles in a twist nematic LC cell with different azimuthal anchoring.
It clearly shows that as the azimuthal anchoring strength is weak, the azimuthal angle deviates from the easy axis of the alignment layer. The actual twist angle ∆φ can be related to the azimuthal anchoring strength by [7]
)] 2 sin[ ) 2 ( 22 φ π φ π φ ∆ − ∆ − = e d K A . (2.4.4) To determine the azimuthal anchoring strength from Eq. (2.4.4), the twist angle has to be measured accurately. Unfortunately, this is difficult to achieve. The angular deviation also leads to light leakage through TN cell locating between a cross polari zer-analyzer combination (see Fig. 2.15).
0 20 40 60 80
Azimuthal Anchoring Energy (pN/µm)
10-2 10-1 Tr a nsm issi o n T(V=0) (P0-A0) Tmin (P45-A135)
Fig. 2.15 Optical transmission through a TN cell inserted between a cross polarizer-analyzer combination.
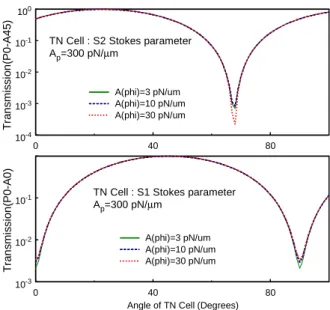
This provides another way to deduce azimuthal anchoring strength via Stokes parameter measurement technique. Analytical result presented in Figure 2.16 indicates that the minimum value of S1 and S2 is sensitive to the azimuthal anchoring strength, therefore the
ratio of the extreme values can be employed to deduce the azimuthal anchoring strength.
0 40 80 10-4 10-3 10-2 10-1 100 T ra n s m is si o n (P0 -A4 5 )
TN Cell : S2 Stokes parameter Ap=300 pN/µm
A(phi)=3 pN/um A(phi)=10 pN/um A(phi)=30 pN/um
0 40 80
Angle of TN Cell (Degrees) 10-3 10-2 10-1 T ra n s m is si o n (P0 -A0 )
TN Cell : S1 Stokes parameter Ap=300 pN/µm
A(phi)=3 pN/um A(phi)=10 pN/um A(phi)=30 pN/um
Fig. 2.16 The angular variations of Stokes parameters S1 and S2 for a TN cell with varying azimuthal
anchoring strength.
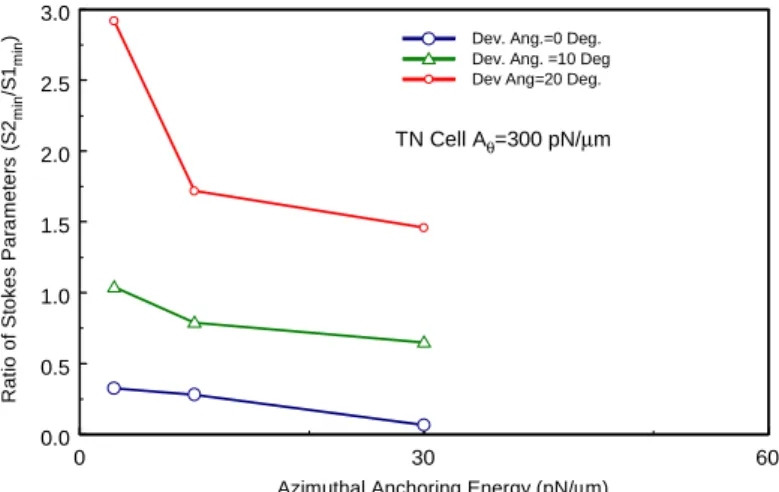
cell is chosen to be 90o (Dev. Ang.=0 o ), 80 o (Dev. Ang.=10 o ), and 70 o (Dev. Ang=20 o ). The results support the approach that uses Stokes parameter measurement for azimuthal anchoring determination.
0 30 60
Azimuthal Anchoring Energy (pN/µm) 0.0 0.5 1.0 1.5 2.0 2.5 3.0 Rati o of St okes Par a m et er s (S2 m in /S 1m in
) Dev. Ang.=0 Deg.
Dev. Ang. =10 Deg Dev Ang=20 Deg.
TN Cell Aθ=300 pN/µm
Fig. 2.17 Calculated values for the extreme ratio of S1/S2. The twist angle of TN cell is chosen to be 90 o (Dev. Ang.= 0 o ), 80 o (Dev. Ang.= 10 o ), and 70 o (Dev. Ang= 20 o ).
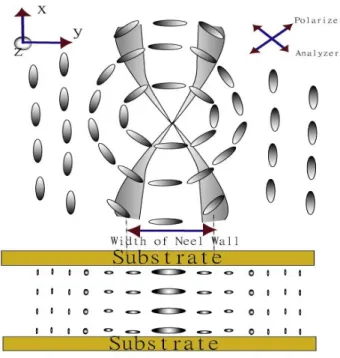
In a homogeneous aligned LC cell with very weak azimuthal anchoring strength can exhibit Neel wall defects [8-9]. This can be understood by considering the free energy density
∫
∫
∞ ∞ − + ∞ ∞ − ⋅ = d fb dy W sin2 dy F φ φ . (2.4.5) The profile of azimuthal angle that minimizes the free energy satisfiesφ ξd sinφ
y =−
∂ ∂
Fig. 2.18 Schematic showing the structure near an Ne'el wallin a homogeneously aligned nematic LC cell. Here 2 11 0 11 11 33 11 2 sin 1 2 φ ξ ξ φ φ = ⋅ ≈ − + ⋅ ⋅ = W K d K K K W K d . (2.4.7) We therefore can deduce the azimuthal anchoring strength from the wall width wn as 2 211 n w K d Aφ = ⋅ . (2.4.8) We have used LC cells homogeneously aligned by LPUV-defined polyvinyl cinamate (PVCi) layers and found thatNe'el wallindeed appears in very weak anchoring, but disappears as the azimuthal anchoring is increased above 25 J/cm2. The measurement
Pvci_Azimuthal anchoring - Exposure time 000.0E+0 1.0E-6 2.0E-6 3.0E-6 4.0E-6 5.0E-6 6.0E-6 7.0E-6 8.0E-6 0 5000 10000 15000 20000 25000 UV Exposure energy(mJ/cm^2) Azimu_anchoring(J/m^2)
Fig. 2.19 Neel wall defect and the azimuthal anchoring strength of LC cells homogeneously aligned with LPUV-exposed PVCi films
PhotoAlignment _3000(mJ/cm^2)TN_TVcurve 0 0.05 0.1 0.15 0.2 0.25 0.3 0.35 0.4 0.45 0.5 0 0.5 1 1.5 2 2.5 3 V T
Fig. 2.20 Measured and calculated T-V curves for TN LC cell with photo-defined Rolic 5021 alignment layer
As shown in the previous section, the LPUV-defined Rolic 5021 layer with an exposure
Photo-aligned TN
3.8×10⁻⁵J /m2
模擬
of 3 J/cm2 can exhibit a polar anchoring as large as 1×10⁻³ J/m2. To test the effectiveness of the alignment layer for a twist nematic LC configuration, we prepared a 90o TN cell and
measured its TV curve. The result is shown in Fig. 2.20. Based on the TV measurement, we estimate the polar anchoring strength to be only 3.8×10⁻⁵
J/m2
. This value is much lower than that in a homogeneously aligned cell, indicating that the surface anchoring energy in a TN cell can not be decomposed into a simple Rapini-Papoula form. More accurate expression for the surface free energy density has to be developed. This work is currently undertaking.
For a weak azimuthal anchoring, LC molecules tend to orient along the easy axis but with a fairly broad width
2 2
0) /2
( w
e
−φ−φ [10]. This causes light leakage through LC cell, which is inserted between a cross polarizer-analyzer setup. The degree of light leakage can be expressed as = I δ∫
2π φ e−φ w dφ 0 / ) ( 2 0 2 2 ) 2 sin( ) 2 ( sin I(w) . (2.4.9)LC cells homogeneously aligned with LPUV-exposed Rolic 5021 layers had been prepared and the light leakage was monitored. The result is presented in Fig. 2.21, indicating that the azimuthal anchoring stength is also increased with LPUV exposure.
Fig. 2.21 Light leakage through a polarizer (0o
)-LC(45o
)-analyzer(90o
with Rolic 5021 alignment layers exposed to LPUV at different exposure.
2.5 Photo-stability Study
Fig. 2.22 Laser annealing effect on the pretilt and light leakage for a LC cell homogeneously aligned with Rolic 5021 layer exposed to 3 J/cm2
. The lines are drawn for eye-guiding only
The information about the alignment variation in a photo-aligned LC cell with laser illumination is of importance from the point of view of applications. We have conducted such an investigation. The TV curve before and after irradiation exhibits no detectable change. Although polar anchoring strength shows no change from TV measurement, the pretilt and light leakage measurements shown in Fig. 2.22 indicate that the LC alignment after irradiation at 514.5 nm is indeed improved from laser annealing. The decrease in light leakage suggests the azimuthal distribution of LC molecules on the alignment surface becomes narrower. But the improvement appears to saturate at an irradiation of 2.6×10⁵ J/cm2
.
2.6 Ther mal Stability Study
Thermal stability of a LC alignment technique plays an important role and in many cases 0.00 0.50 1.00 1.50 2.00 2.50
0.00E+00 8.59E+04 1.72E+05 2.58E+05 3.44E+05 Ar - Gun 514nm exposure Energy(J/cm^2)
Pretilt angle(theda) 0 1 2 3 4 5 6 7 8 light leakage(mV) pretilt angle light leakage
26
could limit the usefulness of the technique. Because of the need for photochemical ability, photo polymer usually has lower molecular weight and therefore exhibits less thermal stability. We had investigated this thermal stability problem and the results are presented in this section. 0.0E+00 2.0E-03 4.0E-03 6.0E-03 8.0E-03 1.0E-02 1.2E-02 1.4E-02 1.6E-02 1.8E-02 2.0E-02 80 90 100 110 120 130 140 T(攝氏溫度) 被破壞面積比
Fig. 2.23 Optical transmission images taken on photo-aligned (Rolic 5021) LC cells with cross polarizer-analyzer setup after the cells had been heated to various temperatures for 20 minutes. The total area of the
alignment degradation is evaluated and plotted as a function of temperature.
The total area of the alignment degradation can be evaluated and the result is found to follow to the equation
A = A0e−K(T)t . (2.6.1) Here A is the area of LC film, and t the heating time. K(T) is the temperature-dependent decay constant, which can be related to temperature via an activation energy parameter
E
aKT K T e Ea/kT
0( )
)
( = − (2.6.2) By substituting Eq. (2.6.1) into (2.6.2), we can obtain
( ) 1 log( ) 0 0 w A A A t T K − = . (2.6.3)
The measured value of the undamaged area at varying temperature can be fitted into Eq. (2.6.3) to yield the activation energy. The result is shown in Fig. 2.24 with the activation energy is determined to beEa 2.147 10 erg 1.342 10 eV 134meV
1
13 = × =
×
Fig. 2.24 Activation energy determination from the fit to Eq. (2.6.3) with the measured undamaged areas
This energy, which is about five times of room-temperature thermal energy, indicates the degree of the thermal stability of the LC alignment on a photo-defined film. It is therefore a useful parameter for the alignment applications with photo polymers.
III Polar Alignment and Field-Induced Re-or ientation in a Twist Pi-Cell 3.1 Molecular Alignment of Liquid Cr ystal Molecules in a Twist Pi-Cell
Twisted-nematic (TN) liquid crystal cell has been widely used in the active matrix liquid crystal display (AMLCD) technology. Unfortunately, two serious problems of slow response and angular dependence of the image quality were encountered in the TN configuration. To overcome the drawbacks, pi-cell [11] (or optical compensated birefringence, OCB, see Fig. 3.1.1) LCD [12] had been proposed. However, a common problem in a pi-cell or OCB device is the unstable bend configuration at low driving field. A more stable splay configuration appears first and thereby a few minutes of warm-up period is required to transform the LC device from the splay state to the bend state. In the multiplexed display application, it is difficult to convert the inter-pixel LC molecules from splay to bend configuration. Consequently disclinations appear in the inter pixel regions [11], and therefore degrades the display performance. To solve the problem polymer
Log(K(T))= -1.3581-1556.14702* (1/T)
-5.9 -5.6 -5.3 -5
2.40E-03 2.50E-03 2.60E-03 2.70E-03 2.80E-03 2.90E-03
1/T
chains are added with small mole fraction into LC films to stabilize the bend configuration. Unfortunately, this scheme produces hysteresis in optical transmittance and poor optical quality from light scattering due to the index mismatch between the liquid crystal and polymer. The other method is to adopt a high pretilt angle in the LC film. Although the stability of the bend configuration indeed increases with pretilt angle, the device’s response time has to be trade-off.
The flow behavior in a LC device is important for the LC switching dynamics. Optical bounce in a twisted nematic (TN) LCD, which had been attributed to from a back-flow effect, appears when the applied electrical field is switched-off. The back- back-flow-induced optical bounce was also observed in a chiral-homeotropic liquid crystal (CHLC) cell during its switch-on stage [13].
In this section, a twisted pi-cell with a stable bend configuration and fast response behavior is proposed. Switching dynamics of the twisted pi-cell is investigated in details. We found that in a twisted pi-cell LC flow can produce a fast optical response. Unlike TN and CHLC cells, optical bounces were observed not only in the homeotropic-to-planar transition but also in the planar-to-homeotropic transition. The optical bounces accelerate the optical response. We calculated the transient transmittance of the twisted pi-cell with Erickson-Leslie theory and the results agree well with our observations. Our simulation also shows that the backflow causes an abnormal LC twist, which then results in the observed fast optical responses during the switch-on and switch-off processes.
Samples of pi-cell and twisted pi-cell were assembled with two ITO-coated glass plates under the same condition. The substrates were coated with a 700~800 Å thick SE-3310 (Nissan co.) alignment layer, which produces a pretilt angle of 3º for the LC molecules used. The substrates were then rubbed in the same direction. We use plastic pearl balls with 6-µm diameter to maintain the cell gap. The empty cells were then filled with liquid crystal of ZLI-2293 (Merk co.) in vacuum. To produce 180°-twist in the twisted pi-cell,
S-811 chiral molecules were added into the liquid crystal. The LC cells were enclosed with UV-cured sealant.
We insert the LC cells between two crossed polarizers. The rubbing direction of the front substrate is rotated 45° from the transmission axis of the incident polarizer. The transmittance-voltage (T-V) curves were measured by using a liquid crystal display panel evaluation device from Otsuka Electronics co.
The director configurations of the pi-cell are depicted in Fig. 3.1.1.
Fig. 3.1.1 Schematic of the LC director in a pi-cell under varying applied voltages.
The opposite alignment forms a splay structure in the pi-cell as shown in Fig. 3.1.1. When the applied voltage is increased to above the threshold voltage, the pi-cell first exhibits a transient splay configuration, and then an asymmetric splay is followed. A rather long holding time is needed to convert the splay state into the bend state (see Fig. 3.1.1). In a typical application of a Pi cell, transition between two bend states is employed. When the applied voltage is decreased from the bend state, a twist configuration instead of the splay state is resulted. This leads to a hysteresis behavior in the T-V curve as shown in Fig. 3.1.2.
Fig. 3.1.2 Optical transmission of a pi-cell as function of applied voltage. The dashed curve denotes the T-V characteristics with applied voltage increasing from 0 to 10 T-V; the solid curve represents the T-T-V curve of
decreasing voltage after the cell is hold at 10 V for a sufficient long time.
Here the dotted curve is the transmittance as a function of the applied voltage starting from the initial state. The solid curve represents the measured transmittance with voltage decreasing from the bend state after the bend state is secured at 10 V. We discovered domains are fairly easy to occur, which can become the major application obstacle of pi-cell.
The opposite surface anchoring alignment is more appropriate for fabricating a pi-cell with 180°-twist angle.
Fig. 3.1.3 Schematic showing the director of a twist pi-cell at varying voltages
We can add appropriate chiral molecules into liquid crystal medium to produce left-handed 180° twist from the lower substrate to the upper substrate. The stable 180°-twist liquid
crystal configuration at 0 V is depicted in Fig. 3.1.3. As the applied voltage increases above the threshold voltage, the LC configuration exhibits a director profile, which is voltage dependent. At the off-voltage (∼2.5 V), most of the angular twist occurs in the middle of the liquid crystal cell where the molecules are perpendicular to the substrate. It is interesting to note that the LC profile forms a symmetrical bend state, therefore the birefringences above and below the middle plane are self-compensating which allow fairly wide view angle. Transmittance-voltage curves of the twisted pi-cell were measured under the same condition as with the pi-cell and the results are presented in Fig. 3.1.4. The T-V curves with increasing and decreasing voltages are essentially overlapped; indicating that only one stable bend configuration exists.
Fig. 3.1.4 Optical transmission of a twist pi-cell as function of applied voltage.
We also investigated the switching processes of the pi-cell and the twisted pi-cell. The rising time (0% → 90%) of the optical transmittance for the twisted pi-cell is about 1.56 ms (Fig. 3.1.5(a)) and the decay time (100% → 10%) is 0.68 ms (Fig. 3.1.5(b)). For the pi-cell, the corresponding rising time is 3.37 ms and the decay is 0.90 ms. The total response time of the twisted pi-cell is about 50% of the pi-cell.
Fig. 3.1.5 The optical transmittance for a twisted pi-cell is plotted as a function of time after the applied voltage is changed from 2.5 V to 10 V at time 0. The decay time (100% → 10%) is about 0.68 ms. The
rising time is observed to be 1.56 ms after the applied voltage is increased 10 V to 2.5 V
In Fig. 4.1.5 the measured transient transmittance of the twisted pi-cell is presented and compares with the calculated results. Optical bounce can be observed after the applied voltage is changed from 10 V to 2.5 V (see Fig. 3.1.5(b)). For comparison, following the voltage change from 2.5 V to 10 V, a dip develops in the transient T-V curve (see Fig. 3.1.5(a)). The solid curves in these figures are the calculated results with the flow effect based on Ericken-Leslie theory being taking into account, while the dashed lines are the calculated results by considering rotation viscosity only without flow effect. By taking into account the flow effect successful reproduction of the optical bounce and valley can be achieved.
To probe into the underlying process of the field-induced optical bounce and valley, we analyze the dynamic director profile of the twisted pi-cell and the results are presented in Fig. 3.1.6.
Fig. 3.1.6 Calculated transient director profile of tilt angle (left) and twist angle (right) of a twist pi-cell after the applied voltage is switched from 2.5 V to 10 V at time 0. Here z is the axis perpendicular to the
substrates and d the cells gap.
The LC molecules near the two alignment surfaces are found to significantly tilt away from the surface normal at a low voltage. With a high voltage at 10 V, these LC molecules stand up rapidly as a result of a large torque being encountered here than that near the middle plane of the cell. The rapid tilt up of the director causes an abnormal twist motion (see Fig. 3.1.6(b), which starts with a swing at a smaller angle than the twist profile at 0 ms. The negative twist motion persists up to 0.6 ms. At this moment, the tilt profile achieves the vertical alignment state. After 0.6 ms, the twist profile reverses its twist direction while preserves the high tilt angle. A stable twist profile is achieved after 6 ms. From the switch-on to 0.6 ms, the optical properties of the LC cell is mainly determined by the tilt angle profile. The small LC twist near the two alignment surfaces leads to a decrease in the optical phase retardation. This accelerates the decreasing rate of the transmittance and thereby speeds up the optical response.
Fig. 3.1.7 Calculated transient director profile of tilt angle (left) and twist angle (right) of a twist pi-cell after the applied voltage is switched from 10 V to 2.5 V at time 0. Here z is the axis perpendicular to the
substrates and d the cell thickness
When the voltage applied is changed from 10V to 2.5 V, the flow velocity of the LC molecules near substrates can be fairly large due to strong anchoring on both alignment surfaces. This results in an abnormal twist motion near the upper and lower surfaces of the cell and a pure bend profile is obtained. The optical retardation increase is accelerated, and at this moment the twist motion has not yet arrived its stable profile.
In summary, we report a twisted nematic liquid crystal pi-cell with stable bend configuration and fast response time. It could be applied to any electro-optical device and display where wide view angle and video rate are needed. The field-induced flow effect results in a bounce and valley in the transient transmittance curve. The flow effect is shown to be in the positive side to accelerate the optical response of a twisted pi-cell.
3.2 Polar ized Four ier -Tr ansfor m Infr ared Absor ption Spectroscopy of Nematic Twist Pi-Cells
3,2,1 Theory of Polarized FTIR Spectroscopy
Considering the case of a laser beam propagating through a LC sample. The LC cell has a complex index of refraction ~n(ν)=n(ν)−iK(ν), will attenuate the infrared beam by
B N N Idl c h dl I K dI = ( ) = n'n''( n''− n') − ν ν , (3.2.1)
where Nn’ is the population of the n’ level. B is the Einstein B coefficient of the material
and can be related to the square of the transition moment from n to ' n''
2 ' '' 2 3 2 '' ' 2 '' ' 2 '' ' 2 3 '' ' |( ) | 3 ) 2 ( ] | ) ( | | ) ( | | ) ( | [ 3 ) 2 ( n n n n z n n y n n x n n h h B = π µ + µ + µ = π µ . (3.2.2)
From Eqs. (3.2.1) and (3.2.2), the extinction coefficient K(ν) can be then expressed as
' '' '' ' ' '' 2 3 | ) ( | ) ( 3 ) 2 ( ) ( nn Nn Nn nn ch Kν = π ν − µ . (3.2.3) Assuming Bn'n'' to be constant over the spectral line, we then have an integrated absorption
coefficient of
∫
= <|( ) ' ''|2> 3 ) ( g nn c N d Kν ν π µ , (3.2.4) where K K K g g g = +∑
Q ) ( ) 0 ( µ µ µ . A 2nd-rank absorbance tensor can be defined as
Φ =
∫
⋅E f ΩdΩ c N A [ gK ˆ] ( ) 3 ) ( π µ( ) 2 , (3.2.5)where Φ is the angle between the incident light polarization direction and the X-axis of the
laboratory coordinates system, f(Ω) denotes the orientational distribution of the dipole
moment derivative in the measurement spot. We can also deduce an anisotropic part from
the absorbance tensor [14]
aik Aik Tr(Aik)δik 3
1
−
= . (3.2.6)
In the molecular frame, the anisotropic absorbance tensor can be expressed in terms of a
1×5 vector [14]
Similarly, in the laboratory frame, the corresponding anisotropic absorbance tensor can be
found to be:
Wlab =( 3 2azz, 12(axx−ayy), 2axy, 2axz, 2ayz). (3.2.8)
F ig. 3.2.1 Schematic diagram showing the relationship between the molecular frame (ξηζ) and the laboratory
coordinates system (XYZ).
From Eq. (3.2.5) we can obtain simple relationships between the orientational averaged absorbance tensors from the molecular to the laboratory frames [14]
5 ,..., 2 , 1 , ) ( ) ( = > >< < = Ω Ω = Ω Ω >= <
∫
∫
l m where S W d f S W d f WWllab llab lmol ml mmol ml
. (3.2.9)
With a normal incident geometry on the XZ plane, the integrated absorbance is found to be Φ = − + 2 <cos2Φ > 3 2 2 1 3 1 ) ( A W1lab W2lab A . (3.2.10)
Based on the analysis, the orientational distribution of given functional groups in a complicated thin film can be deduced from a set of measured polarized Fourier-transform infrared (FTIR) absorption spectra. The procedure is detailed as follows:
(i)For a given normal mode vibration the integrated absorbance as a function of the incident infrared polarization direction A(Φ) is first calculated from measured FTIR spectra;
(ii) Fit the resulted A(Φ) to Eq. (IIa.10) to deduce W1lab and W2lab;
(iii) From > < + > < = − = > < + > < = = 22 2 12 1 2 21 2 11 1 1 ) ( 2 1 2 3 S W S W a a W S W S W a W mol mol Y X lab mol mol Z lab (3.2.11) and ] ) ( ) [( 2 1 ) ( 2 3 2 ) ( , 2 ) ( , 2 2 ) ( , 1 K g K g mol K g mol W W ς η ξ µ µ µ − = = (3.2.12)
the order parameters of molecular distribution, <S11 >,< S12 >,< S21 >,and < S22 >, can
then be determined. Note that <S11 >and <S12 >denote the orientational order
parameter and the transverse order parameter (which relates to the dichroic ratio), and
> < >
<S21 and S22 can reflect the bi-axiality of the film.
For simplicity, consider a uniaxial LC film with a normally incident infrared beam. The resulting infrared absorbance can be expressed as [15-18]
> + + < = = Φ > + + − < = = Φ 2 0 0 2 0 0 ] sin sin cos cos cos sin sin cos cos [sin ) 0 ( ] sin sin cos sin sin sin cos sin cos cos [ ) 90 ( φ β γ φ β θ β φ θ γ φ θ β φ γ β θ β φ γ A A A A , (3.2.13) where the bracket <… > denotes the orientational averages over the LC molecular distribution. The infrared dichroic ratio DR can then be calculated to be [15]
) 90 ( ) 0 (Φ= 0 Φ= 0 = = A A A A DR x y . (3.2.14)
Fig. 3.2.2 Measured optical transmission of a twist pi-cell as a function of applied voltage. The simulated TV curve (solid curve) and the underlying director profiles at 0 V, 2 V, 4 V, and 10 V are also
included for comparison
A twist pi-cell had been prepared and its optical transmission curves were measured. The results are shown in Fig. 3.2.2. For the optical transmission measurements, the LC cell was first subjected to an external electric field with voltage increasing from 0 to 10 V. The transmission obtained is plotted in terms of filled squares. After the LC cell was stabilized at the high voltage for 30 sec, the filed was then decreased from 10 V to 0 V and the result was shown with the open symbols. No hysteresis was observed, indicating the bend configuration is the most stable configuration. For probing more deeply, we perform theoretical simulation on the LC configuration at varying applied voltages. The resulting LC profiles at 0V, 2 V, 4 V and 10 V are also presented in the inset for comparison.
A typical Fourier-transform infrared absorption spectrum of the twist pi-cell at 0 V is presented in Fig. 3.2.3. The polarization direction of the incident infrared beam is oriented to along the rubbing direction. The major features in the IR spectrum are 1448, 1502, 1606, 2228, 2851, and 2924 cm-1
. The highest two peaks at 2851 and 2924 cm-1
are contributed from the symmetric and anti-symmetric stretches of CH2 along the alkyl chain of the LC
1502 cm-1
are mainly from the C=C stretch of the LC core. The 1448 cm-1
–peak can be ascribed to the combination of the C-C stretch and the in-plane wag of the C-H on the LC core. The mode assignments are summarized in Table 3.1 with some calculated results of molecular normal-modes of cyano biphenyl.
1000 1500 2000 2500 3000 3500 0.0 0.5 1.0 IR Ab s o rba nc e W avenum ber (cm-1)
Fig. 3.2.3 Fourier transform infrared absorption spectrum of the twist pi-cell at 0 V. The polarization direction of the incident infrared beam is oriented to along the rubbing direction.
Table 3.1Calculated molecular normal-mode frequencies of cyano biphenyl and the corresponding infrared absorption strengths
Nor mal Modes Vibr ation Frequency
(cm-1
)
IR Absor ption Symmetr y
1. C-H Stretch s-CH2 a-CH2 f-CH3 2851 (IR) 2851 (Raman) 2924 (IR) 2937 (Raman) 2. C1-N stretch 2237 (calc.) 2228 (IR) 2228 (Raman) 89.8 A1 3. Biphenyl C=C stretch 1605 (calc.) 1606 (IR) 1606 (Raman) 1502 (IR) 46.3 A1
C-H in-plane wag (b) C5-C8 stretch + C-H in-plane wag 1261 (calc.) 1285 (Raman) 1240 (Raman) 6.5 A1 5. C(biphenyl)-H in-plane wag 1095 (calc.) 1177(Raman) 13.9 A1 6. Biphenyl in-plane angular distortion 985 (calc.) 957 (Raman) 510 (calc.) 4.2 5.9 A1 7. C-H out-of-plane wag 507 (calc.) 544 (calc.) 664 (calc.) 713 (calc.) 705 (Raman) 742 (calc.) 818 (calc.) 790 (Raman) 821 (Raman) 9.9 6.3 42.8 11.8 45.7 23.2 B1
The peak intensities are presented in Fig. 3.2.4 as a function of the azimuthal angle between the infrared polarization and the rubbing direction of the cell for varying voltages applied. The three major peaks at 1502, 1606 and 2228 cm-1
are generated from the core of LC molecules and therefore exhibit very similar azimuthal patterns. The amplitude and dichroic ratio of these peaks also display significant voltage dependent. The voltage dependence of the dichroic ratio at various modes is summarized in Fig. 3.2.5(a) and the corresponding peak intensities are shown in 3.2.5(b).
Fig. 3.2.4 Azimuthal patterns of the infrared absorption peaks of the twist pi-cell at varying applied voltages. The azimuthal angle denotes the angle between the infrared polarization and the rubbing direction of the cell.
-2 0 2 4 6 8 10 12 Applied Voltage (V) 0.6 1.0 1.4 1.8 2.2 Inf rare d D ic h roic R at io 1448 cm-1 1502 1606 2228 2851 2924 f(γ)=cos2γ , β=720 f(γ)=cos2γ, β=680 f(γ)=1, β=700 f(γ)=1, β=540 -2 0 2 4 6 8 10 12 Applied Voltage (V) 0.0 0.4 0.8 1.2 IR Peak R ati o 1448 cm-1 1502 1606 2228 2851 2924 f(γ)=1, β=540 f(γ)=cos2γ, β=700 (a) (b)
Fig. 3.2.5 (a) Infrared dichroic ratio and (b) intensity ratios at the infrared absorption peaks are plotted as a function of voltage. Simulated curves with various orientational distributions of LC molecules were included
for comparison.
For comparison, simulation results using various orientation models of the LC molecules are included. The LC molecules are assumed to be either free rotation with f(γ)=1 or biased
rotation with f(γ)=cos2γ relative to the ξ-axis of the averaged orientation frames (ξηζ). The frame is assumed to be oriented according to the director profile calculated from the elastic theory of continuum medium (see Fig. 3.2.2). The stretch modes associated with the LC core part apparently suggest that the LC molecules do not rotate freely relative to the
ξ-axis in the twist pi-cell.
In Sec. 3.3, we further employ time-resolved Raman scattering spectroscopy for probing more deeply about the field-induced reorientation of the LC molecules in this interesting twist pi-cell.
3.3 Time-Resolved Raman Scatter ing Spectroscopy of Nematic Twist Pi-Cells For revealing the molecular orientation and composition, vibrational spectroscopy is better suited than absorption/luminescence spectroscopy owing to its finger printing capability. Vibrational spectroscopy based on Raman scattering process is suited for producing information about the molecular orientation and composition of a sample.
Considering a molecule, which is excited by a laser beam with a polarization along the X-axis and propagation along the Y-axis of the laboratory frame, the Raman signal along the Z-axis is proportional to [19]
( , ) 2 [ ( ) ( ) ] 2 [ 2 2 ] 3 3 2 2 3 3 > < + > < = > < + > < = YX XX s p Z Y s p p s s c Q Q c I ν ν π ν ν µ µ π ν ν α α . (3.3.1)
The Raman polarizability tensor for a rod-shape molecule usually possesses a single dominant component α . A free molecular rotation along the ς -axis leads to theςς following orientational averages of the squared polarizability component [20]
2 2 2 2 4 2 2 4 4 2 )] 2 sin( ) sin (cos ) 2 cos( sin cos 2 [ sin 4 1 ] sin sin cos [cos sin ςς ςς α φ φ θ α α φ φ θ α Φ − Φ + Φ Φ >= < Φ − Φ >= < YX YX . (3.3.2)
Here Φ is the azimuthal angle between the sample coordinates (xyz) and the laboratory frame (XYZ). By combining Eqs. (3.3.1) and (3.3.2), we therefore obtain the azimuthal-dependent Raman scattering intensity
Is(νs,νp)=Is0[1+<cos(2φ >cos(2Φ)]=Is0[1+Q⋅cos(2Φ)], (3.3.3) where Q is the azimuthal order parameter. Therefore the order parameter Q can be
deduced from Is(Φ=00) Is(Φ=900)=(1+Q) (1−Q).
3.3.1 Static Raman Spectroscopy of a Pi-Cell under var ying applied voltage
A twist pi-cell described in 3.3.1 was prepared and investigated with Raman spectroscopy. The Raman spectra taken with an exciting laser beam polarized along the rubbing direction are presented in Fig. 3.3.1. As shown by Fig. 3.1.1, the director of the LC molecules is twist by 180 degrees along the z-direction. This causes a decrease in the dichroic ratio of the C=C stretching mode of LC molecules at 1606 cm-1
. The order parameter of the mode at 0 V was found to be 0.52, comparing to 0.67 in a homogeneous 0o
configuration.
Fig. 3.3.1 Raman spectra from a twist pi-cell under varying applied voltages. The incident exciting laser beam is polarized along the rubbing direction of the pi-cell.
Fig. 3.3.2 Raman spectra from a twist pi-cell under varying applied voltages. The incident exciting laser beam is polarized perpendicular to the rubbing direction of the pi-cell.
Several other peaks can also been observed at 705, 790, 821, 957, 1177, 1240, 1285, 1606, and 2228 cm-1. The peaks at 705, 790, and 821 cm-1 are ascribed to the C-H
out-of-plane wag on the core part of the LC molecule. The angular distortion of the core appears at 957 cm-1. The coupled motions of the inter-core C-C stretch and the C-H in-plane wag
appear at 1177 and 1240 cm-1
, and the coupling between the intra-core C-C stretch and C-H in-plane wag was found to be 1285 cm-1
. The stretching modes of C=C and C≡N produce the major peaks at 1606 and 2228 cm-1
. It was found that the LC molecules tilt upward at near 90o when the applied voltage is above 4V. The high polar angle leads to the reduced
Raman intensities at 1177, 1285, 1606 and 2228 cm-1 .
0 2 4 6 8 10 Applied Voltage (V) 0.0 2.5 5.0 No rmal ized Ra man Inten sity I/ I(1 0 V) 806 cm -1 836 cm-1 972 cm-1 1192 cm-1 1300 cm-1 1621 cm-1 2240 cm-1 2860 cm-1 2946 cm-1
Fig. 3.3.3 Normalized Raman peak intensities versus applied voltage. The Raman intensities are normalized to the values at 10 V.
Near the C-H stretching region, two major peaks can be detected at 2851 (s-CH2 stretch) and 2937 (f-CH3). Unlike the vibrational features from the LC core, these C-H stretching peaks were found to increase with the applied voltage. This result also agrees with the FTIR result presented in Fig. 3.2.4 and suggests that the planes of the alkyl chains of the LC molecules are twisted by the electric field to yield a larger projection of the a-CH2 stretching mode on the film surface.
Fig. 3.3.4 Raman spectra near the C-H stretching region. The spectra were taken from a twist pi-cell under varying applied voltages. The incident exciting laser beam is polarized along the rubbing direction of the pi-cell.
3.3.2 Time-Resolved Raman Spectroscopy of a Pi-Cell under voltage switching
Fig. 3.3.5 Experimental setup for acquiring transient Raman spectra from a LC cell during the field-induced switching process.
Figure 3.3.5 depicts an experimental setup used to acquire the transient Raman spectra from a LC cell during the field-induced switching process. Twist LC pi-cell was chosen since its field-induced re-orientation dynamics remains unclear. The incident laser beam
with a wavelength of 523 nm is polarized along the rubbing direction of the pi-cell. The LC cell was switched at 500 Hz with a voltage of 10 V from 0 ms to 1 ms and 10V from 1 ms to 2 ms. The results are presented in Fig. 3.3.6.
Fig. 3.3.6 Raman spectra from a twist pi-cell at varying time. The applied voltage is switched from 0 V to 10 V at 0 ms and 10V to 0 V at 1 ms. The incident exciting laser beam is polarized along the rubbing direction of
the pi-cell.
It is interesting to note that the peak at 790 cm-1, which has been attributed to from the
out-of-plane wag of the C-H on the LC core, is significantly enhanced after the switching off period. The voltage applied and the peak intensities at 790, 1606 and 2228 cm-1 in Fig.
3.3.6 are plotted as a function of time in Fig. 3.3.7. By comparing to the results shown in Fig. 3.3.3, it indicates that the LC molecules do not return to their 0-V configuration. Instead, at 500 Hz the effective switching appears to be from 4 V to 10 V. This is also consistent with the optical transmission measurement shown in Fig. 3.3.8.
0.0 0.4 0.8 1.2 1.6 2.0 Time (ms) -0.5 0.5 1.5 2.5 3.5 Norm ali z ed I nt en s it y I(t)/I (10 V ) Voltage 806 cm-1 1621cm-1 2240cm-1
Fig. 3.3.7 Normalized Raman peak intensities versus time after voltage switching. The applied voltage is switched from 0 V to 10 V at 0 ms and 10V to 0 V at 1 ms. The Raman intensities are normalized to the values at 10 V. 0 10 20 30 40 -0.06 -0.04 -0.02 0.00 0.02 0.04 Time (msec) Op tica l T ra n sm issi o n ( a rb . u n its) -10 0 10 20 30 40 Ap p lie d v o lta g e ( V) freq.=50 Hz (a) (b)
Fig. 3.3.8 Optical transmission through a twist pi-cell lying between a cross polarizer and analyzer combination. The rubbing direction of the cell is oriented at 450
relative to the axis of the polarizer, and the applied voltage is switched from 0 V to 10 V at (a) 50 Hz, (b) 100 Hz, (c) 500Hz, and (d) 1-kHz.
(c) (d)
According to the simulated result shown in Fig. 3.1.7, it indicates that after the voltage is changed from 10V to 2.5 V, the flow velocity of the LC molecules near substrates could be fairly large since a strong anchoring is experienced on both alignment surfaces. Within the first 1 ms, the LC molecules near the upper and lower surfaces are twisted to along with the rubbing directions and therefore a pure bend profile is obtained. At this moment, the twist profile has not reached its final stable configuration. This rapid change in polar angle may play a role in producing the enhanced out-of-plane wag of the C-H near the LC core shown in Fig. 3.3.6. Similar enhanced response after switch-off was also found at the C-H2
and C-H3 stretching modes (see Fig. 3.3.9), indicating LC molecules do not response to the
Fig. 3.3.8 Raman spectra at the C-H stretching region taken from a twist pi-cell at varying time after voltage switching. The applied voltage is switched from 0 V to 10 V at 0 ms and 10V to 0 V at 1 ms. The incident
laser beam is polarized along the rubbing direction of the pi-cell.
IV Conclusions and Future Prospect
In conclusion, the anchoring energetic of LC molecules in homogeneous nematic cell, twist 90o
-nematic cell, and twist pi-cell with various alignment layers has been studied in detail. Optical techniques included retardance measurement, pretilt angle, optical transmission, and vibrational spectroscopies have been developed. These methodologies can be employed to provide detailed information about the anchoring properties, the depth profile of molecular alignment, and field-induced reorientation dynamics in various LC configurations. By applying these techniques to a twist pi-cell, we show that the rising and falling times with an external driving field can be as small as 1 ms. The fast response is originated from a flow effect which accelerates the optical response in the LC cell. However, the LC configuration does not settle down to its equilibrium configuration in 30 ms. Therefore a twist pi-cell can be used as a light shuttle instead of video rate applications.
We probe the switching dynamics with time-resolved Raman spectroscopy and polarized FITR to yield information about LC alignment with molecular specificity. The efficacy of these techniques has been proven with numerous applications reported in this annual report.
For our future research, these techniques developed will be applied for probing the anchoring properties, alignment, and field-induced switching dynamics of anti-ferroelectric and ferroelectric liquid crystal cells. The FLC and AFLC have a potential in producing true video rate display with wide viewing angle. The research tools and approaches developed in this annual program could serve as a useful platform for the future frontier LCDs development.
References
1. Nastishin Yu. A., Polak R.D., Shiyanovskii S.V., Bodnar V.H., Lavrentovich O.D., J. Appl. Phys. 86, 4199(1999).
2. Jerome B., Reports on Progress in Physics 54, 391(1991).
3. Sugimura A. Miyamoto T. Tsuji M. Kuze M., Appl. Phys. Lett. 72, 329(1998). 4. H. Yokoyama and H. A. Van Sprang. J. Appl. Phys. 57, 4520(1985).
5. Sugimura A., Ou-Yang Zhong-can. Physical Review E. 51, 784(1995). 6. G. Baur, V. Wittwer, D. W. Berreman, Phys. Lett. 56A,142(1976).
7. Ishizaki A. Abe H. Ando N. Iimura Y. Kobayashi S., Mol. Cryst. Liq. Cryst. 258, 277(1995)
8. Ryschenkow G.. and Kleman M., J. Chem. Phys. 64, 404(1976).
9. Xiang Tong Li., Dong He Pei., Kobayashi S., Iimura Y., Jpn. J. Appl. Phys. 36, L432(1997).
10. Acharya B.R., Jae-Hoon Kim and Kumar S., Physical Review E. 60, 6841(1999). 11. P. J. Bos, K. Rickey, and K. Beran, Mol. Cryst. Liq. Cryst. 113, 329 (1984). 12. T. Miyashita, C. L. Kuo, and T. Uchida, SID95, 797 (1995).
13. Shu-Hsia Chen, and Li-Yi Chen, Appl. Phys. Lett. 75, 3491 (1999).
14. H. Skupin, F. Kremer, S. V. Shilov, P. Stein, and H. Finkelmann, Macromolecules 32, 3746 (1999).
15. A. A. Sigarev, J. K. Vij, Yu. P. Panarin, and J. W. Goodby, Phys. Rev. B62, 2269 (2000). 16. W. G. Jang, C. S. Park, and N. Clark, Phys. Rev. E62, 5154 (2000).
17. W. G. Jang, C. S. Park, K. H. Kim, M. A. Matthew, A. Glaser, and N. Clark, Phys. Rev. E62, 5027 (2000).
18. A. Kocot, R. Wrzalik, B. Orgasinska, T. Perova, J. K. Vij, and H. T. Nguyen, Phys. Rev. E59, 551 (1999).
19. E. B. Wilson, Jr., J. C. Decius, and P. C. Cross, Molecular Vibrations, Dover
Publications, Inc. (New York, 1955).