Linear Metal Atom Chain on GaN(0001) by Chemical Vapor Deposition
Chien-Hua Lung, Shie-Ming Peng, and Che-Chen Chang*
Department of Chemistry, National Taiwan UniVersity, Taipei, Taiwan, R.O.C. 10617 ReceiVed: June 19, 2004; In Final Form: August 17, 2004
The adsorption, reaction, growth, and the bonding configuration of a trinuclear linear metal atom chain complex, tetrakis(2,2′-dipyridylamino)chromium(VI) chloride (DPCC, Cr3(µ3-dpa)4Cl2), on the GaN(0001) surface at 110 K were studied using synchrotron-induced X-ray photoelectron spectroscopy (XPS) and static secondary ion mass spectrometry (SIMS). XPS studies revealed three Cr chemical states of equal surface population present on the sample surface exposed to DPCC of low doses. The SIMS spectra showed main signals contributed from the sputter desorption of pyridine and the dipyridylamino ligand. Studies on small model molecules, such as pyridine and dipyridylamine (Hdpa), exposed to the sample surface showed that upon adsorption at 110 K, these small molecules were present on the sample surface in the molecular form only. They yielded the molecule-Ga adducts formed during SIMS detection. The absence of these adduct signals in the SIMS spectra taken from the DPCC-exposed surface indicated that DPCC chelates were not disintegrated upon adsorption. Instead, DPCC chelates of low doses reacted with the surface via bond rupture of one of the two terminal Cr-Cl bonds on their central Cr atom chains, leaving the Cl atom separated from DPCC to bond on the Ga site of the surface. The resulting chemisorbed DPCC chelate bonded to the surface via the terminal Cr atom of its trinuclear metal chain, resulting in one end of the chain anchored to the surface and the other oriented away from it. There was a change in the DPCC adsorption behavior as the exposure was increased to high doses. The DPCC layer grew molecularly by physisorption at high exposures and the chelates were present on the surface in an inclined configuration. The chelate effect from the presence of four chelating groups in DPCC may provide the chelate its large stability and chemical inertness.
1. Introduction
The last 40 years have witnessed astonishing advances in the field of microelectronics. Smaller and smaller devices with more capability and better performance were progressively developed. When the Intel 4004 was first introduced in 1971, the transistors per die for microprocessors were just over 2300. By the time the Intel Prescott was fabricated in the year 2004, the number increased to 125 million. In fact, Advanced Micro Devices was able to fabricate chips in 2002 which contained standard CMOS transistors with gate lengths of only 10 nanometers using a design known as the Fin Field Effect Transistor,1 and Intel targets the production-level realization of 20 nanometer transis-tors in computer chips for the year 2007.2 With continued shrinkage on the critical dimension in computer chips, it is predicted,3on the basis of the analysis of fundamental, material, device, circuit, and system limits, that soon, the performance of the Si-based integrated circuit will be based on a micropro-cessor which has the transistors per die in the trillion range.
Significant breakthroughs have also been made recently on the technology leading to chemically assembled electronic nanocomputers.4,5Redox-active molecules behaving as on/off switches were synthesized and molecular switches strung together to function as AND and OR logic gates were realized.6-8The technology allows a monolayer-thick crystalline layer, made of synthetic molecules, to absorb information in the form of an electrical charge and organizes it more efficiently than that etched onto silicon chips.4-8 With the advances of this new technology in the coming years, one may be able to build not only entire memory chips of just a few hundred atoms
wide, but also tiny processors that are billions of times faster than the current Prescott chip and better in terms of energy required to do a calculation.
The accelerated miniaturization of the integrated circuit in the Si-based technology and the advance in the new technology of molecular-based nanocomputers have, however, posed many great challenges in the fields of materials, processes and circuit designs. Among the challenges, the interface between nano-structures and the macroscopic world is one of the key issues to be solved. Taking the communication among the nanodevices in the chemically assembled electronic nanocomputer as an example, currently available signal wires are much bigger than the synthetic molecules created in the logic gate demonstrated for the nanocomputer.9It is essential, in this case, that the wires used for its nanostructures to communicate with the outside world and with one another be shrunk to a size with the diameter smaller or close to the size of the redox-active molecules that make up the logic gate in the nanostructure such that the ultimate capability offered by the nanocomputer can be fully utilized. The formation strategy10-13 and the electrical properties14-17 of interconnecting metal wires with nanometer to subnanometer diameters are thus being investigated vigorously.
To explore the possible formation of molecular metal wires by chemical vapor deposition of metal chelates, the present work studies the chemical bonding and the reaction chemistry involved in the adsorption, on the semiconductor surface, of the chelate which contains the atomic metal chain. The work was made possible because of the recent success in the synthesis of oligonuclear metal-chain complexes.18-21These complexes have an extended metal atom chain in the center, which is encaged by oligo-R-pyridylamino ligands. The ligands bind the * Corresponding author. Fax: +2 23636359. E-mail: [email protected].
10.1021/jp047324k CCC: $27.50 © 2004 American Chemical Society Published on Web 10/09/2004
Downloaded by NATIONAL TAIWAN UNIV on July 30, 2009
metal atoms in a linear fashion, with the number of the metal atoms in the string as high as thirteen. The success in synthesizing linear metal-chain chelates not only allows one to explore the fabrication of atomic metal wires by deposition, but also provides excellent model molecules for gaining fundamental understanding of the interaction of one-dimensional metal bonds with the solid surface.
The atomic metal chain chelate used in this work was a trinuclear chromium complex, tetrakis(2,2′ -dipyridylamino)-chromium(VI) chloride (DPCC, Cr3(µ3-dpa)4Cl2). As shown in Figure 1, the chelate has a central linear chain comprised of three Cr atoms and terminated at both ends by Cl atoms. The central metal chain is encaged by four dipyridylamino ligands, which wrap around the chain helically in a syn-syn configura-tion.22Each ligand contains two terminal pyridyl groups, bridged together by one N atom, and has the hydrocarbon portion of the group pointing away from the central metal chain. The two pyridyl groups bond separately to the two terminal Cr atoms of the chain and the bridging N atom bonds to the middle Cr atom. Results of the present study on the DPCC adsorption on the GaN(0001) surface showed that the chelate structure of DPCC was preserved upon adsorption at 110 K. At low doses, the Cr-Cl bond of DPCC was disrupted and the Cr-Cl-detached remnant of DPCC bonded chemically to the surface via the terminal Cr atom of the trinuclear central chain. The remnant resided on the GaN surface with the nonreacting end of the metal chain pointing away from the surface. The Cl atom detached from DPCC bound on the Ga site of the GaN surface. At high doses, DPCC physisorbed molecularly on the sample surface. The molecular axes of most physisorbed DPCC chelates may be inclined toward the surface.
2. Experimental Section
The experiments were performed in two different ultrahigh vacuum analysis systems. One of them was pumped by a 220 L/s ion pump and a titanium sublimation pump. It was equipped with a residual gas analyzer (from Inficon), a retarding field energy analyzer (from VG Microtech), a CLAM II electron energy analyzer (from VG Microtech), used for X-ray
photo-electron spectroscopy (XPS) studies, and an ion gun (from VG Microtech). The vacuum in the other system was maintained by a 500 L/s turbomolecular pump. It was equipped with a quadrupole mass spectrometer (1-300 amu, from Inficon), used for temperature-programmed desorption (TPD), another quad-rupole mass spectrometer (1-300 amu, from VG Microtech), used for static secondary ion mass spectrometry (SIMS), a retarding field energy analyzer (from VG Microtech), and an ion gun (from VG Microtech). An electron impact ionizer was integrated to the Inficon mass spectrometer for detecting neutrals. The details of the system design were described elsewhere.23
The GaN(0001) samples were acquired from Cree, Inc., and had a Ga-terminated surface. They were of 4 µm thickness
grown on sapphire and were undoped, with a carrier concentra-tion of 3.7× 1018cm-3. Prior to being placed under the vacuum, the samples were subjected to a wet-chemical cleaning process, including treatment of the surface with a 1 M NaOH solution for 1 min at room temperature followed by rinse with deionized water. After the treatment, the sample was clipped onto a thin tantalum sheet, which in turn was mounted to a XYZ sample manipulator using tantalum clamps. A pair of Chromel-Alumel thermocouples was spot-welded to the tantalum sheet for monitoring the sample temperature. For reference against the thermocouple, an optical pyrometer was used. Once under ultrahigh vacuum, the sample surface was sputtered by high-energy ions to remove impurities on the surface. To inhibit the formation of metallic gallium24on the GaN(0001) surface during sample cleaning, the sputtering was performed using nitrogen ions. Repeated cycles of sputtering (500 eV, 0.7 µA beam
current, 20 min) and annealing were carried out, with the annealing temperature of below 1050 K so as not to cause GaN decomposition in the high-temperature region.25 Sample an-nealing was obtained in this work by passing a high electrical current through the tantalum sheet, while cooling to 110 K was made possible by conduction from a nearby copper tank filled with liquid nitrogen. A well-ordered but facetted surface was obtained, as demonstrated by a hexagonal 1× 1 low-energy electron diffraction (LEED) pattern with satellite spots, after sample cleaning.26No oxygen and carbon contamination could be detected by Auger electron spectroscopy.
To admit DPCC molecules onto the GaN surface in the UHV system, a Knudsen cell deposition source was specifically designed. It was made of a tantalum sheet of 0.20 mm thickness wrapped into a cube, which may be heated by passing a high electrical current through the Ta wires attached to the back of the cube. Molecular evaporation of DPCC was verified by depositing in a vacuum a thick film of DPCC on a stainless steel plate and comparing its thermogravimetric analysis and fast atom bombardment spectra to those measured before evaporation. The dose reported in this study is the corresponding background exposure at the sample surface and expressed on the unit of langmuir (1 L ) 1× 10⁻⁶ Torr s). The exposure pressure was measured with an ionization gauge and was kept below ∼2 × 10⁻⁹ Torr. The reading of the gauge was uncorrected for the corresponding sensitivity.
XPS measurements were performed by means of synchrotron radiation on 6m HSGM beamline of National Synchrotron Radiation Research Center, Taiwan, with the photon energy of 250 eV for Cr 3p, Ga 3d, and Cl 2p and of 350 eV for C 1s. The incident angle of photons to the surface normal was 45°, and photoelectrons were collected with the analyzer normal to the sample surface. The single-component spectra shown in the XPS Ga 3d and Cl 2p plots in this article were extracted from
Figure 1. ORTEP drawing of the non-hydrogen atoms of Cr3(µ3-dpa)4
-Cl2, showing atom labeling and the bonding of the dipyridyl ligands to
the central Cr atom chain.
Downloaded by NATIONAL TAIWAN UNIV on July 30, 2009
the raw data by using a standard spin-orbit decoupling procedure27with spin-orbit energy splitting values of 0.45 and 1.60 eV and branching ratios of 3:2 and 2:1 for Ga 3d and Cl 2p, respectively. The background in all the XPS spectra was removed using Shirley’s algorithm28prior to the curve fitting with the Gaussian-broadened Lorentzian function. The binding energies in the spectra are referred to metallic Ga 3d5/2at 18.9 eV.29
SIMS measurements were performed with the sample posi-tioned in line-of-sight of the mass spectrometer (nondifferentially pumped). A primary beam of 2 keV energy was used to bombard the sample, with the impact angle measured from the surface fixed at 45 degrees. The ion gun was differentially pumped and operated at a pressure of 3× 10⁻⁹ Torr when SIMS spectra were recorded. With respect to the large cross section for sputter desorption and damaging, the ion flux was held within the 0.5-1.5× 10⁻⁹Amp/cm2range. A bias voltage of 22 V was applied to the sample to increase the measured yield of secondary ions. Data collection was accomplished using an interface system designed by VG Microtech. The typical data collection time was <10 min/spectrum.
3. Results and Discussion
3.1. DPCC Surface Reaction at 0.42 L. The reaction of
DPCC on the GaN(0001) surface at 110 K was initially studied by static secondary ion mass spectrometry. Presented in Figure 2 are the positive (on the left) and the negative SIMS (on the right) spectra taken from a GaN(0001) surface exposed to several different doses of DPCC. At the low dose of 0.42 L (Figure 2a), the positive SIMS spectrum obtained was dominated by two intense peaks measured at m/e 69 and 71. Their intensity
ratio revealed that these peaks resulted from the sputter desorption of Ga+isotopes from the substrate. A number of small peaks at m/e 52, 78, 130, 172, and 222 were also identified in the spectrum. As mentioned before, there are four dipyridyl-amino (NH4C5-N-C5H4N, designated as dpa herein, m/e 170) ligands in DPCC wrapping helically around the trinuclear Cr (m/e 52) atom chain, with each ligand containing two pyridyl (C5H4N, designated as py herein, m/e 78) groups. Considering various mass combinations for the possible sputtered species made up from segments of DPCC under ion bombardment showed that the m/e 172 peak observed in Figure 2a contained a contribution from desorption of the ligand in the form of dpaH2+. The mass signal observed at m/e 78 may be attributed to the pyridyl unit, py, breaking away from the dpa ligand. The
m/e 52 peak was ascribed to the emission of Cr+ions from the
DPCC-exposed surface. As will be discussed later, the observa-tion of the Cr+signal in the positive SIMS spectrum does not imply that most DPCC chelates adsorbed on the surface were completely dissociated to expose their central metal atoms to the probe ion. The lower ionization energy of the metal atom like Cr, as compared to the ionization energy of organic species, may result in the relatively large peak intensity observed in the positive SIMS spectrum at m/e 52 even at the surface electronic condition when the bombardment-induced Cr atom desorption is smaller than that of the organic neutrals. It may also facilitate the SIMS detection of other Cr-containing species, such as pyCr+(m/e 130) and dpaCr+(m/e 222), observed in the figure. The m/e 35 and 37 peaks observed in the negative SIMS spectrum were attributed to Cl-isotopes.
3.1.1. C5D5N Reaction. To better understand the
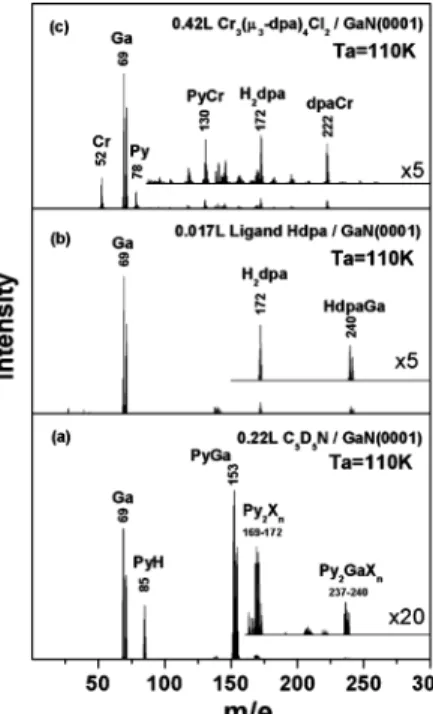
low-temperature adsorption behavior of DPCC on GaN(0001) and to verify the above assignments of the major peaks obtained in the positive SIMS spectrum of DPCC adsorbed on the sample surface, studies about the adsorption of the component molecules of DPCC, namely, the ligand molecule (Hdpa) and pyridine, on the sample surface were conducted. Presented in Figure 3a is the positive SIMS spectrum taken from the GaN(0001) surface
Figure 2. Positive (left) and negative (right) secondary ion mass spectra
of a GaN(0001) surface exposed to the indicated doses of DPCC. All spectra are recorded at 110 K.
Figure 3. Positive secondary ion mass spectra of a GaN(0001) surface
exposed to (a) C5D5N of 0.22 L, (b) Hdpa of 0.017 L, and (c) DPCC
of 0.42 L. All spectra are recorded at 110 K. The spectra have been normalized to a constant peak height at m/ e 69. Figure 3c was redrawn from Figure 2a for direct comparison.
Downloaded by NATIONAL TAIWAN UNIV on July 30, 2009
exposed at 110 K to C5D5N of 0.22 L. As shown in the figure, in addition to the peaks observed at m/e 69 and 71, due to the sputter desorption of Ga+isotopes, the SIMS spectrum taken from the deuterated pyridine-exposed GaN(0001) surface con-tained peaks at m/e 85, 153, and 155. Since hydrogen is a common impurity found in GaN,30,31the peak measured at m/e 85 in Figure 3a was ascribed to the sputter desorption of the hydrogenous pyridine, in the form of C5D5N-H+ (pyridine-H+), generated from the adsorbed deuterated pyridine molecule acquiring a surface H+species nearby during sputtering. The peaks detected at m/e 153 and m/e 155 was assigned as due to the sputtering of pyridine-Ga adducts (C5D5N-69Ga+and C5D5N-71Ga+) from the sample surface. Results of the study of C5D5N adsorption on the sample surface thus imply that, once formed from the decomposition of DPCC, the pyridine molecule may be stable and remain intact both in its presence at 110 K on the GaN(0001) surface and during its sputter desorption by the probe ion in SIMS. The observed stability of the pyridine molecule on GaN(0001) thus supports the ascription of the m/e 78 peak observed in Figure 2a to the intact pyridyl group of DPCC.
The m/e value of the pyridine signal obtained from the DPCC-exposed sample surface, however, indicated that the pyridine species detected in the SIMS spectrometer had a composition of C5H4N+(m/e 78), not of C5H5N-H+(m/e 80) as one would have predicted from the SIMS spectrum, shown in Figure 3a, obtained from the pyridine-exposed surface. The discrepancy may arise from the adsorbed DPCC undergoing the surface decomposition and/or the bombardment-induced bond rupture at low exposures. Defects including grain boundaries are known to be present on the GaN crystalline surface.32-35Upon DPCC adsorption at low exposures, the decomposition of DPCC on the GaN surface may be induced in the presence of these defects36,37to yield small fragments of DPCC, including possibly the pyridyl group (m/e 78), on the surface. On the other hand, during the time when the SIMS spectrum was taken, collision cascades, initiated by the probe ions, may be generated in or extended to the adsorbed, bulky DPCC molecule. Part of the ion energy may thus be dissipated inside the molecule. The chemical bonds holding the pyridyl group in position in DPCC may then be broken to cause sputter desorption of the m/e 78 species. In neither case were intact pyridine molecules generated. The SIMS spectrum taken from the DPCC-exposed surface thus did not exhibit a peak at m/e 80 (pyridine-H+). The fact that no pyridyl-Ga adducts (C5H4N-69Ga+
and C5H4N-71Ga+ , m/e of 147 and 149) were detected in the SIMS experiment done on the DPCC/GaN(0001) system (see Figure 2a), in contrast to that observed in the deuterated pyridine/GaN(0001) study (see Figure 3a), indicated that the bombardment-induced fragmentation of DPCC was more likely to occur than the surface defect-induced decomposition of DPCC. The chelate effect from the presence of four chelating dpa groups provides the DPCC complex molecule its large molecular stability and chemical inertness such that the chelate structure of DPCC did not disintegrate readily on the GaN surface at 110 K. Instead, as will be discussed later, only the terminal Cr-Cl bond on the central atom chain of DPCC may be cleaved during DPCC reaction at 110 K with the GaN surface.
The possibility of DPCC decomposition on the defect sites of the bare GaN surface, however, cannot be completely ruled out. In this case, the pyridyl groups generated from the defect-induced DPCC decomposition may bind chemically to the surface. They are not readily converted thermodynamically to the pyridine molecule because of the large diffusion barrier38-40 of the hydrogen atoms present, as the residue or via DPCC
decomposition, on the GaN surface. It may thus contribute to the SIMS signal at m/e 78, instead of at m/e 80, as shown in Figure 2a.
3.1.2. Hdpa Reaction. Results of the studies on the reaction of the ligand molecule on the sample surface also support the peak assignments made above for Figure 2a and show that the presence of the dpaH2+signal in Figure 2a is not mainly due to the DPCC decomposition on the GaN surface. Figure 3b shows the positive SIMS spectra taken from the GaN(0001) surface exposed to Hdpa of 0.017 L at 110 K. As shown in the figure, exposing Hdpa onto the sample surface gave rise to SIMS peaks at m/ e 69, 71, 172, 240, and 242 exclusively. The peaks observed at m/e 69 and 71 resulted from the sputter desorption of Ga+. The observation of the SIMS peak at m/ e 172 in Figure 3b from the Hdpa-exposed GaN(0001) surface supports our early ascription of the peak observed at the same m/e position in Figure 2a to dpaH2+. The intensity ratio for the doublet peaks observed at m/e 240 and 242 in Figure 3b was close to that for the peaks measured at m/e 69 and 71, indicating that the m/e 240 and 242 peaks were contributed from the sputtered species containing Ga isotopes. These two peaks, obtained from the Hdpa-exposed sample surface, were thus assigned as due to HdpaGa+. As shown in Figure 2a, there were no signals detected at these two m/e values from the GaN(0001) surface exposed to DPCC at 110 K, however. Similar to the arguments made previously based on the SIMS spectrum obtained from the pyridine-exposed GaN(0001) surface, the presence of the dpaH2+peak and the absence of the HdpaGa+ (or dpaGa+) signal in the SIMS spectrum taken from the DPCC-exposed surface indicated that the chelate structure of the DPCC molecules may remain intact upon their adsorption at 110 K on the GaN(0001) surface. The DPCC decomposition to form isolated dpa species bonded on the surface may not be the main process taking place that led to the observation of the m/e 172 peak in Figure 2a. Instead, the dpa ligands may be sputter desorbed from the adsorbed DPCC molecules during SIMS measurement. The attribution of the major SIMS peaks obtained in Figure 2a to the bombardment-induced bond rupture, due to the dissipation of the probe ion energy in the large admolecule, of the stable DPCC adsorbed on the sample surface also explained the presence of the pyCr+(m/e 130) and dpaCr+(m/e 222) peaks, instead of the pyGa+ and dpaGa+ peaks, in the SIMS spectrum shown in Figure 2a.
As mentioned before, the possibility of the adsorbed DPCC molecule undergoing the defect-induced surface decomposition on the GaN surface cannot be completely ruled out. Results of the studies about the ligand reaction on GaN(0001), however, showed that the possibility was very slim. As shown in Figure 3b, no pyridine signal (py+at m/e 78 or pyridine-H+at m/e 80) was detected from exposing Hdpa to the sample surface. Only a few peaks corresponding to molecular adsorption of Hdpa were observed in the SIMS spectrum. The ligand molecule, thus, did not decompose on the GaN(0001) surface at 110 K. It indicated that the m/ e 78 peak observed in Figure 2a did not result from the decomposition of the dpa ligand already severed from the adsorbed DPCC chelate, if DPCC had fragmented on the sample surface at 110 K. The m/e 78 (py+) and the m/e 172 (dpaH2+) signals shown in Figure 2a were, therefore, not produced sequentially in a series of surface reactions. Examining the DPCC structure shows that the pyridyl group is bound tightly in the DPCC chelate, via a C-N bond to the rest of the dpa ligand and a N-Cr bond to the central metal atom chain. Without scission of the dpa ligand from DPCC by fragmentation first, an intact pyridyl group may not be easily generated in the
Downloaded by NATIONAL TAIWAN UNIV on July 30, 2009
surface reaction of DPCC. The exclusion of the formation of m/e 78 from the surface decomposition of the ligand, as revealed in Figure 3b, thus further diminishes the possibility that the DPCC complex may decompose on the GaN surface at 110 K. For a direct comparison of the adsorption chemistry involved for the GaN(0001) surface exposed to DPCC and Hdpa, respectively, the positive SIMS spectrum shown in Figure 2a is redrawn in Figure 3c. Assuming that the bonding strengths of dpa-M (M ) Ga or Cr) are similar41,42 and the surface potentials for positive ion formation in these two chemical systems studied identical, the relative signal intensities observed in the spectra taken from these two systems should reflect to some extent the surface concentration of the adsorbate species, i.e., DPCC or Hdpa, in each system. To facilitate visual inspection/extrapolation of the adsorbate concentration present on the surface, the spectra in Figure 3 were normalized according to their m/e 69 signal intensities. Since in these two systems, the intensity of the m/e 172 peak increased at the expense of that of the m/e 69 peak at increasing exposures, the observed similar intensity ratios, I172/I69, of these two peaks shown in Figure 3b obtained from 0.017 L Hdpa exposure and in Figure 3c from 0.42 L DPCC exposure indicated that an exposure roughly 25 times higher for DPCC than for Hdpa was required to achieve similar surface coverage. This analysis suggests that, since a DPCC molecule can block more surface Ga atoms from being detected by SIMS than a Hdpa molecule because DPCC is more bulky, the sticking probability of DPCC on GaN(0001) may be far less than that of Hdpa at 110 K.
3.2. DPCC Surface Reaction between 0.8 and 21 L. As
the DPCC exposure was increased from 0.42 to 2.9 L, the relative SIMS signal intensities, shown in Figure 2, of the Cr+ (m/e 52), py+(m/e 78), and dpaH2+(m/e 172) peaks observed in the positive SIMS spectrum and of the Cl-(m/e 35 and 37) peaks in the negative spectrum increased along with a large decrease in the relative intensity of Ga+(m/e 69 and 71) signals. There was a change in the SIMS intensity distribution as the exposure was further increased to 3.4 L and higher. The relative intensities of the Cr+(m/e 52), pyCr+(m/e 130), and dpaCr+ (m/e 222) peaks, compared to the dpaH2 (m/e 172) peak intensity, increased substantially with the DPCC exposure, whereas those of the py+(m/e 78) and Cl-(m/e 35 and 37) peaks decreased. It indicated that there may be a change in the DPCC adsorption behavior on GaN(0001) at the exposure between 2.9 and 3.4 L.
3.2.1. Adsorption Chemistry below 2.9 L. 3.2.1.1. Cr 3p and Bonding Configuration. The chemistry that caused the change in the SIMS intensity distribution observed at increasing DPCC exposures was studied using synchrotron radiation-induced XPS. Shown in Figure 4 are the Cr 3p XPS spectra taken from the GaN(0001) surface exposed at 110 K to DPCC of the indicated doses. A broad XPS profile, with the full width at half-maximum of∼2.5 eV, was obtained as the sample surface was exposed to DPCC of 0.82 L. Its intensity increased with the DPCC exposure. The fact that the XPS profile obtained from the sample, which was not a metallic substrate, was not quite symmetric indicated that there was more than one chemical state associated with the Cr atoms present in the DPCC-exposed GaN-(0001) system.
In DPCC, the two Cr atoms on both ends of the central metal chain have the identical chemical environment. Each Cr at the end of the chain is bound to a Cl atom on one side and to a Cr atom on the other, in addition to its Cr-N bonding to the pyridyl group of the dpa ligand. The Cr atom at the center of the trinuclear metal chain, on the other hand, has a different
chemical environment. It is tied to two Cr atoms of the chain, in addition to its Cr-N bonding to the N bridge of the dpa ligand. A free DPCC molecule should thus possess two different Cr chemical states. As discussed above, the SIMS spectra taken from the GaN surface exposed to DPCC revealed that the chelate structure of DPCC adsorbed on the sample surface remained mostly intact at 110 K. The prediction based on the intramo-lecular bonding structure of DPCC and the SIMS results thus also support the above statement that there should be more than one oxidation state for the Cr atoms present in the DPCC chelate adsorbed on the GaN surface.
Deconvolution of the Cr 3p XPS profiles by peak fitting was carried out. It showed that the Cr 3p spectra obtained at DPCC exposures of less than ∼2.9 L could not be fitted well with only two component peaks each. The best fit of these spectra was obtained when at least three subpeaks, positioned at 43.6, 44.7, and 45.9 eV, respectively, were assumed in the fitting. It indicated that there were three chemical states associated with the Cr atoms present on the sample surface in the low DPCC exposure regime of less than∼2.9 L. The result was against the prediction, based on the DPCC intramolecular structure, of only two Cr oxidation states present in the system if DPCC had adsorbed physically as an intact molecule on the GaN surface. The observation of three subpeaks in the Cr 3p XPS profiles obtained at low DPCC doses thus indicated that chemical reactions of DPCC with the GaN surface may take place upon its adsorption at 110 K. It may lead to Cr bonding chemically to the GaN surface and bring about a new chemical state for the bonding Cr atom, which was in a chemical environment different to those of the unreacted Cr atoms in DPCC.
3.2.1.2. Cl 2p3/2 and Cr-Cl Bond Rupture. The reaction leading to Cr bonding to the GaN surface was investigated by examining the Ga XPS spectra taken from the DPCC-exposed sample surface. Since in DPCC, Cl atoms are bound to the ends of the Cr atom chain, the Cl XPS spectra were also examined to better understand the DPCC bonding configuration on GaN. Presented in Figures 5 and 6 are Cl 2p3/2 and Ga 3d5/2 XPS spectra, respectively, taken from the GaN(0001) surface exposed
Figure 4. XPS spectra of Cr 3p obtained from the GaN(0001) surface
exposed at 110 K to the indicated doses of DPCC.
Downloaded by NATIONAL TAIWAN UNIV on July 30, 2009
at 110 K to the indicated doses of DPCC. As shown in Figure 5, a shoulder (at 200.0 eV) was present on the high binding energy side of the Cl 2p3/2 XPS profile, with its intensity increasing with the DPCC exposures of less than 2.9 L. It indicated that during DPCC reaction with the GaN surface at low doses, at least two Cl states were generated in the system. Since, as discussed above, the chelate structure of the DPCC molecules remained intact upon their adsorption at 110 K on the sample surface, the presence of more than one spectral feature in the Cl 2p3/2 XPS profile and of more than two subpeaks in the Cr 3p XPS spectrum revealed that the terminal Cr-Cl bond of the DPCC chelate adsorbed on the surface may
be disrupted during the reaction. The Cl atom separated from DPCC may bond to the sample surface following the reaction. The electronegativity of Cl may cause the atom to bond on the positive site, the Ga atom, of the polar GaN(0001) surface and result in the observation of the Cl 2p3/2subpeak measured at 200.0 eV. The observation of the 200.0 eV peak assigned as due to Cl bonding on Ga is in good agreement with the previous measurement of the 200.1 eV peak in the XPS Cl 2p3/2spectrum attributed to the Cl atoms in the gallium chlorides produced from chlorine exposure to the GaAs(100) surface.43Because of the lower electronegativity of Cr than Ga, the subpeak observed at the lower binding energy of 198.9 eV in Figure 5 may be associated with the Cl atom remaining bonded to the end of the Cr atom chain in DPCC.
3.2.1.3. Ga 3d5/2and Chemisorption. The above conclusion of Cl bonding on the positive site of GaN(0001) may be verified by examining the XPS profile of Ga. As shown in Figure 6a, the Ga 3d5/2XPS spectrum taken from the GaN surface before DPCC exposure mainly contained two subpeaks, one observed at 19.5 eV due to Ga atoms present on the surface of the substrate and the other at 20.2 eV to Ga present in the bulk.44 An additional peak of very small intensity was observed at 18.9 eV, which was ascribed to metallic Ga29,45possibly induced to form by synchrotron radiation. As the surface was exposed to DPCC of 1.6 L, the intensity of the Ga surface peak observed at 19.5 eV decreased substantially, in comparison to the small decrease in intensity observed for the Ga bulk peak. The Ga on the surface was thus involved in the reaction with DPCC when DPCC was introduced at 110 K to GaN. The observed small decrease in intensity of the Ga bulk peak was due to the attenuation of the substrate XPS signal caused by the presence of bulky DPCC adsorbates on the substrate surface. In addition, as shown in Figure 6b, peak fitting of the Ga 3d5/2 spectrum revealed that there was a new Ga state present on the DPCC-exposed sample surface. The binding energy of the new state, at 20.9 eV, was higher than that of the bulk Ga peak, indicating that the new Ga state formed in the reaction of DPCC with the sample surface was related to Ga bonding in a chemical environment which was more oxidative than the environment in which the bulk Ga was present. Since the bulk Ga was surrounded by N atoms, the new Ga state may then involve the surface Ga bonding to a more electronegative species than N. Combined with the fact that a high-binding-energy shoulder was present in the Cl 2p3/2XPS spectra (Figure 5) taken from the DPCC-exposed sample surface, the signal intensity observed at 20.9 eV in the Ga 3d5/2 XPS profile (Figure 6) may be contributed from the Cl-bonded Ga state formed on the surface from the reaction of the Ga surface state with DPCC.
3.2.1.4. Chemisorption Configuration. The presence of the Cl-bonded Ga state on the GaN surface exposed to DPCC supports the statement made above that DPCC adsorbs chemi-cally on the sample surface at 110 K via the bond rupture of some of its terminal Cr-Cl bonds upon adsorption. For DPCC to chemisorb on the sample surface with its Cr atom chain oriented parallel to the surface, the two terminal Cr atoms of the chain should have given rise to XPS signals at the same binding energy, resulting in a Cr 3p XPS profile comprising of only two component peaks. Three subpeaks were observed, however, in the Cr 3p XPS spectra (Figure 4) measured at low DPCC exposures of less than∼2.9 L. In addition, the peak areas of the three Cr subpeaks were about equal in each of the spectra obtained at low DPCC exposures. It excluded the possibility of the presence of a mixed surface bonding configuration in which some DPCC, with the bond rupture of both its terminal Cr-Cl
Figure 5. XPS spectra of Cl 2p3/2obtained from the GaN(0001) surface
exposed at 110 K to the indicated doses of DPCC.
Figure 6. XPS spectra of Ga 3d5/2obtained from the GaN(0001)
surface exposed at 110 K to the indicated dosages of DPCC.
Downloaded by NATIONAL TAIWAN UNIV on July 30, 2009
bonds, may bind parallel to the surface while others bind physically. Instead, it revealed that for each adsorbed DPCC chelate, only one of the two terminal Cr-Cl bonds in the DPCC molecule was broken upon adsorption and that all the DPCC molecules were adsorbed on the sample surface with one end of the chain anchored to the surface and the other remaining free from bonding. Since the trichromium atom chain was well sheathed helically by four bulky dpa ligands22and no ligand was dissociated from DPCC upon adsorption, the bonding of DPCC to the surface via the terminal Cr of the chain could only be made possible when the free end of the chain was oriented away from the surface. Thus, as shown schematically in Figure 7, the chemisorbed DPCC molecule at low exposures of less than∼2.9 L may position on the GaN surface with its central metal atom chain pointing away from the surface. The layer of the DPCC chelates formed on the GaN surface with their Cr axis tilted away from the surface will be termed herein as the chemisorbed layer.
In theory, the number of Cl atoms bound to the Ga site of the sample surface should equal to that retained in DPCC if DPCC chelates are adsorbed on the GaN surface with only one end of the chain anchored to the surface and the other remaining intact in structure. The peak areas of the two Cl subpeaks observed in the Cl 2p3/2 XPS spectra (Figure 5) in the low exposure regime of less than 2.9 L, however, were not equal to each other. The inequality may result from the shielding of photoelectrons emitting from the Ga-bonded Cl by the bulky DPCC covered above. X-ray diffraction studies22showed that the length of the DPCC complex was∼9.81 Å and the diameter ∼12 Å. Since at 110 K, the Cl atoms detached from DPCC and bound to the surface Ga may not migrate readily on the sample surface, they were thus buried under the bulky Cl-severed remnants of DPCC and shielded partially from detection by XPS. In comparison, the Cl atoms remaining bonding to the central metal chains of the chemisorbed DPCC resided on top of the chemisorbed layer and were exposed to the XPS detector. The significant difference in intensity of the two XPS subpeaks of Cl 2p3/2 (Figure 5) and the higher XPS signal intensity observed at 198.9 eV, which was attributed before to the Cl atoms bonding to the end of the chain, than that at 200.0 eV, which was ascribed to Cl bound on the Ga site, thus supports the conclusion that at low exposures, DPCC bonds to the GaN surface with the chain axis oriented away from the surface.
3.2.1.5. py+SIMS Intensity and Bonding Configuration. The above-stated chemisorption configuration of DPCC on GaN-(0001) at low exposures is also supported by the observed increase in intensity of the py+signals present in the positive SIMS spectra (Figure 2) taken at increasing DPCC doses in the low exposure regime. As mentioned before, the chelate structure of DPCC, in which the dpa ligand, and its pyridyl groups, wraps helically around the central atom chain, remained
undisturbed during chemisorption. In the case when the DPCC chelate is adsorbed with the central metal axis oriented parallel to the surface, the Cr-N bond holding the pyridyl group of dpa to the Cr axis is mostly concealed inside the molecule. The bond cleavage of the Cr-N bond by impinging ions to release the pyridyl group may not take place easily because the bond is not openly exposed to the incident ions. In addition, the helically wrapped chelate structure of DPCC make the pyridyl group released from its binding to the metal axis in the collision cascade initiated by the probe ion hard to find its way to get to the SIMS detector because of the presence of neighboring groups of atoms in DPCC which remain bonding together during the cascade. The intensity of the py+signal in the SIMS spectrum is thus expected to be relatively low, as compared to the intensity of other groups of atoms sputtered from DPCC, for DPCC adsorbing with its metal axis in parallel to the sample surface. However, in the case when the DPCC chelate is positioned with its molecular axis tilted away from the surface, the Cr-N bond between the top terminal Cr atom in the central metal chain and the pyridyl group of the dpa ligand is more exposed to the probe ions for cleavage. With the tilted configuration, the py+ ions formed from bond disruptions (of the top Cr-N bond and of the py-N bond) in the collision cascades can also reach the mass spectrometer, which was configured normal to the sample surface in the experiment, relatively less obstructively.46,47Since there are four pyridyl groups, each associated with one ligand, bonded to the top Cr atom of the central metal chain for each DPCC chelate tilted away from the surface, the sputter yield of py+is expected to be higher than that of other groups of atoms sputtered from DPCC for DPCC adsorbing somewhat perpen-dicularly to the surface. The observed large intensity of the py+ (m/e 78) SIMS signal, as compared to that of other DPCC fragments in the spectrum, at low DPCC exposures (Figures 2a-c) thus supports the conclusion that the DPCC chelates were adsorbed with their metal axis tilted away from the GaN surface at low exposures.
3.2.1.6. XPS Assignment of Cr Chain Atoms. The three component peaks observed at low DPCC exposures in the XPS profile of Cr 3p shown in Figure 4 may be assigned individually by taking into consideration the difference in the chemical environment of the three Cr atoms in the trinuclear central chain of the DPCC chelate adsorbed on the GaN surface. The GaN-(0001) sample has a polar surface in which the Ga atom is positively charged and the N atom, which is located at 0.807 Å away from the top atomic layer, negatively charged.48,49 As discussed above, when the terminal Cr-Cl bond on the central atom chain of DPCC was disrupted upon adsorption on GaN-(0001) at 110 K, the Cl atom generated from the bond rupture may bind at the positive site of the surface. On the other hand, the Cr atom, designated as Cr1 (see Figure 7), through which the DPCC molecule was anchored to the surface, may bond to the negative site because of the smaller electronegativity of Cr than Cl. In addition to this bonding, Cr1 also had chemical bonds with one Cr atom and with four N atoms of the pyridyl groups present in the four dpa ligands sheathing the metal atom chain. The Cr atom, designated as Cr3, on the other end of the chain of the chemisorbed DPCC was encaged in a similar chemical environment as that of Cr1 except that the negative surface bonding site for Cr1 was replaced by a Cl neighbor for Cr3. It should thus lead to a larger chemical shift (i.e., higher binding energy) for Cr1 than Cr3. The Cr atom, designated as Cr2, in the center of the trinuclear Cr chain was adjacent to two Cr atoms and four N atoms, each bridging the two pyridyl groups of the dpa ligand. Cr1 and Cr2 thus had a similar atomic
Figure 7. Schematic illustration of the possible bonding configuration
of DPCC on GaN(0001) at low exposures.
Downloaded by NATIONAL TAIWAN UNIV on July 30, 2009
environment, except that the negative surface bonding site for Cr1 was replaced by a Cr neighbor for Cr2. The binding energy of Cr1 was thus also expected to be shifted higher than that of Cr2. The Cr 3p subpeak with the highest binding energy of 45.9 eV observed in Figures 4a-c in the low exposure regime of less than∼2.9 L was thus assigned as due to Cr1. Examination of the electron resonance in the dpa ligand suggested22,50that each bridging N atom carried a charge of -0.5 and each pyridyl N atom a charge of -0.25. As stated above, Cr3 was encaged by four pyridyl N atoms, whereas Cr2 by four bridging N atoms. With lower electronic charge carried in the pyridyl N than in the bridging N atoms, the total positive charge induced in Cr3 was lower than in Cr2, even though Cr3 was also bonded to the higher electronegative Cl atom than Cr2 to the Cr atom. The Cr3 atom thus had a lower oxidation state (i.e., lower binding energy) than Cr2. The Cr 3p subpeak observed at the lowest binding energy of 43.6 eV in Figures 4a-c in the low DPCC exposure regime of less than∼2.9 L was thus ascribed to Cr3, and the subpeak observed at 44.7 eV to Cr2.
It should be pointed out that in theory, the photoelectrons emitted from Cr1 and Cr2 are attenuated more than those from Cr3 because of their larger depths of escape normal to the top of the chemisorption layer. The XPS intensities of Cr1 and Cr2 are thus expected to be lower than the Cr3 intensity. Curve fitting of Cr 3p spectra by including, on the basis of the attenuation gradient obtained in the Cl 2p3/2spectra, different intensity attenuations (not shown in Figure 4) of the photoelec-trons emitting from Cr atoms of different depths led to a shift of their respective peak positions by less than 0.15 eV from the ones shown in Figure 4.
3.2.2. Adsorption Chemistry aboVe 3.4 L. 3.2.2.1 Ga 3d5/2
and DPCC/GaN Interaction. As shown in Figure 6, as the DPCC exposure was further increased, the intensity of the Ga 3d5/2 signal observed at 20.9 eV reached its maximum between 2.7 and 4.0 L, after that it decreased with the exposure. The formation of the DPCC chemisorbed layer on GaN(0001) was thus completed in this exposure regime and no additional Ga-Cl bonds were produced on the surface from the Cr-Ga-Cl bond breakage of DPCC after completion. There was no other new Ga state formed at higher DPCC exposures, either. Instead, the XPS intensity of the bulk Ga continued to decrease at increasing exposures. At 18 L, the Ga state of the substrate became negligible and the Ga-Cl state dominated the Ga bonding in the system, although its XPS signal intensity was considerably lower than that measured at the exposure of 2.7 L. The substantial decrease in intensity of the Ga 3d5/2profile at high exposures indicated that more DPCC introduced to GaN(0001) were adsorbed on the surface at 110 K. The absence of new Ga state formed and of an increase in the XPS intensity of any Ga state revealed that the additional DPCC adsorbed on the surface at high exposures did not interact directly with the sample surface. Physisorption of DPCC thus took place at high exposures.
3.2.2.2. Cl 2p3/2 and DPCC Layer Growth. The continued adsorption of DPCC chelates at high exposures was also manifested in the Cl 2p3/2spectra shown in Figure 5. In contrast to those obtained at low exposures, in which the spectral profiles of different doses resembled each other, the Cl 2p3/2XPS profile changed with the exposure in the high DPCC exposure regime of more than 3.4 L. The signal intensity on the low binding energy side increased relatively more than that on the high energy side, as the exposure was increased. Peak fitting of the spectra measured at high exposures showed that the intensity increase was due to the population increase of a new Cl state
in the system which had the binding energy, of 198.7 eV, very close to that of the lower-binding-energy Cl signal obtained at low exposures. As discussed above, the subpeak observed at the lower binding energy of 198.9 eV in the Cl 2p3/2 spectra obtained at low exposures was associated with the Cl atom remaining bonded to the upper end of the Cr atom chain following the DPCC chemisorption with the lower-end Cr-Cl bond disrupted. The new Cl state obtained at high exposures at 198.7 eV may thus be present in a similar chemical environment. That is, the additional DPCC chelate present on the sample surface at high exposures may remain pristine upon adsorption and their terminal Cr-Cl bonds may not be broken. The result was in agreement with the observation discussed before on the Ga 3d5/2 signal intensity (at 20.9 eV, Figure 6) from the Ga-Cl state reaching its maximum between 2.7 and 4.0 L. Above that, no new Ga state was formed and there was no increase in intensity for any Ga state present in the system. The DPCC layer thus grew molecularly at high exposures.
3.2.2.3. Cr 3p and DPCC Layer Growth. Results from the Cr 3p XPS studies also revealed that DPCC adsorbed as intact molecules on the chemisorption layer in the high exposure regime of more than 3.4 L. Similar to that observed in the Cl 2p3/2spectra (Figure 5), the Cr 3p profiles (Figure 4) remained similar to each other in the low exposure regime and changed with the dose at high exposures. All the high-exposure Cr 3p XPS spectra could be peak-fitted well with the three component peaks used for fitting the low-exposure ones; i.e., the peak binding energies for the high-exposure spectra resided at the same positions as those obtained at lower exposures. However, their peak intensities were no longer equal, but the relative intensities of these subpeaks varied coherently with the dose in the high-exposure regime. Assuming that the structure of the DPCC chemisorption layer was not perturbed by the additional DPCC chelates adsorbed on top of the layer (i.e., each of the three Cr atoms present in the three different chemical environ-ments in the DPCC chemisorption layer continued to contribute equally at high exposures to the intensity of the three subpeaks), results of the peak fitting showed that the changes in peak intensity obtained at increasing exposures were always associ-ated with the two subpeaks measured at the lower binding energies. The variation in the Cr 3p XPS spectra obtained at high exposures was thus due to contributions from an identical pair of Cr states in each exposure. The ratio in the change of the peak area at increasing exposures for these two subpeaks remained to be about two throughout the high DPCC doses studied. The fact that between these two Cr states, the one with lower binding energy had a higher surface population, by a factor of 2, than the one with higher binding energy, and the fact that these two states had binding energies corresponding to those for Cr3 and Cr2, respectively, suggested that the relative increase in population of these two Cr states observed at high DPCC exposures were due to the Cr atoms present in the unperturbed DPCC chelates adsorbed on top of the chemisorbed layer. DPCC thus adsorbed molecularly on the GaN surface at exposures higher than 3.4 L to form the physisorption layer.
3.2.2.4. Physisorption Configuration. In concept, the phys-isorbed compounds may be oriented on the surface with their molecular axes pointing randomly to any directions. The DPCC chelates physisorbed on top of the chemisorption layer, however, may be oriented somewhat parallel to the surface. As discussed before, the Cr-N bond which holds the pyridyl group to the upper Cr atom in the central metal axis of the chelate is more exposed to the probe ion and the pyridyl group of dpa to the mass spectrometer when the chelate is adsorbed with the axis
Downloaded by NATIONAL TAIWAN UNIV on July 30, 2009
oriented perpendicularly, rather than in parallel, to the surface. Relatively high py+SIMS signal intensity is expected to be obtained if DPCC physisorbed perpendicularly to the surface. Figure 2, however, reveals that, instead of a larger intensity, as that observed in the low exposure regime, the py+ (m/e 78) intensity was mostly smaller than those of other major peaks in the spectra taken at high DPCC exposures of higher than 3.4 L. The relative intensity of the py+signal to those of other major peaks also decreased drastically with increasing doses in the high exposure regime. In fact, the py+intensity measured at DPCC exposures of higher than 3.4 L (Figures 2d-f) was smaller than the one obtained at the low exposure of 2.9 L (Figures 2c). Most of the DPCC chelates physisorbed on top of the chemisorption layer may thus be inclined to the surface.
The inclined configuration of the physisorbed DPCC chelate may also contribute to some extent to the decrease in the Cl -intensity observed in the negative SIMS spectra at high exposures. In the low-exposure regime of less than 2.9 L, the Cl-SIMS signals increased with the DPCC dose. As discussed before, at low exposures, the DPCC molecules chemisorbed on the sample surface with their metal chains oriented somewhat perpendicularly to the surface. The Cl atoms bound to the top Cr atoms of the chains were thus exposed readily to both the incident ions and the SIMS detector. As the DPCC dose was increased in the low exposure regime, both the increase in number of the exposed Cl atoms and the change in surface potential for ionization due to the increased presence of adsorbates and the ion-induced fragments on the surface assisted in the observed increase in intensity of the Cl-SIMS signals. However, as physisorption took place at high doses of more than 3.4 L, not only the surface potential for ionization was altered due to the change in the surface electronic structure, but the exposed Cl atoms in the chemisorption layer were buried by the physisorbed, bulky DPCC molecules. Since the phys-isorbed DPCC chelates were inclined to the surface, their Cl atoms on the central metal chains were more concealed by the bulky dpa ligands from the incident ions and the SIMS detector than the chemisorbed DPCC. The Cl- SIMS intensity thus decreased with the dose in the high exposure regime.
3.2.3. C 1s and Adsorbed DPCC Structure. As shown in Figure 1, DPCC is shielded with a layer of C atoms on its outer cylinder. The carbon layer should thus interact with the sample surface first when DPCC is brought to contact with the surface in an inclined configuration. The chemistry involved in the interaction of DPCC with the GaN(0001) surface was explored further using XPS of C 1s so as to confirm the observation made above on the preservation of the chelate structure of DPCC adsorbed at different doses on the sample surface at 110 K. Presented in Figure 8 are the XPS spectra of C1s obtained from the GaN(0001) surface exposed to the indicated doses of DPCC. As shown in the figure, the C1s XPS profiles measured at different doses were similar except that the intensity varied with the exposure. Peak fitting of these spectra showed that, in addition to a small subpeak obtained at 284.6 eV possibly due to the presence of a small amount of carbon residues on the surface, each spectrum can be deconvoluted into the same set of three subpeaks, with their maximum intensities located at binding energies of 285.7, 286.5, and 287.6 eV, respectively. Integrating the area under each subpeak revealed a constant ratio of 1:1:3 (A287.6:A286.5:A285.7) for the three subpeaks obtained in each XPS spectrum of C1s measured. Inspecting the molecular structure of chelates showed that the C atoms, present only in the pyridyl group, of DPCC were in three different chemical environments. There were three C atoms each bound to two C
neighbors, one C atom sandwiched between the pyridyl N and the bridging N atoms, and one bound to both the pyridyl N atom and a C atom. Because of the higher electronegativity of N than C, the atom sandwiched between the pyridyl N and the bridging N atoms is expected to have the largest chemical shift (i.e., highest binding energy), whereas the one bound to two C atoms the smallest. The subpeak obtained at the binding energy of 287.6 eV was thus assigned as due to the C atom sandwiched between two N atoms. The one measured at 286.5 eV was ascribed to the C atom located between the pyridyl N and a C atom. The 285.7 eV peak, on the other hand, was assigned to the C atom positioned between two C atoms. The ratio of the numbers of these C atoms in DPCC was 1:1:3, in agreement with the population ratio of the corresponding C surface states obtained from integrating the areas of the respective subpeaks. The XPS signals of C1s displayed in Figure 8 thus resulted solely from the C atoms of DPCC present on the surface in the form of the intact chelate structure. The absence of new C states (Figure 8), whose intensities would have increased with the exposure, in chemical environments different to those for the C atoms in the pristine DPCC as well as the absence of the Ga states (Figure 6) corresponding to C bonding to the GaN surface, thus, support the conclusion that the chelate structure of DPCC remained intact upon adsorption on GaN(0001) at 110 K.
4. Conclusions
The adsorption, reaction, and bonding chemistry of tetrakis-(2,2′-dipyridylamino)chromium(VI) chloride (DPCC, Cr3(µ 3-dpa)4Cl2) deposited on the GaN(0001) surface were studied. The trichromium metal chain chelate did not decompose on the GaN surface at 110 K. Comparing with the SIMS spectra taken from the surface exposed to pyridine and dipyridylamine, respectively, showed that the major peaks observed in the SIMS spectra of DPCC on the GaN surface were not due to the production on the surface of the DPCC fragments in a series of decomposition reactions. Instead, pyridine and dipyridylamine may be induced in SIMS to desorb from the adsorbed DPCC chelates due to bond rupture via the dissipation of the probe ion energy in the large admolecule of DPCC. The chelate effect from the presence
Figure 8. XPS spectra of C 1s obtained from the GaN(0001) surface
exposed at 110 K to the indicated dosages of DPCC.
Downloaded by NATIONAL TAIWAN UNIV on July 30, 2009
of four chelating dpa groups in DPCC may provide the complex its large stability and chemical inertness such that the chelate structure of the DPCC molecules remained intact upon their adsorption. Results from synchrotron-induced XPS studies revealed three Cr chemical states, instead of two predicted based on the Cr chemical structure of bonding in the free DPCC, present in the system of DPCC of low doses adsorbed on the GaN surface. The presence of three Cr states as well as the observation of two subpeaks in the Cl 2p3/2XPS profile indicated that one of the two terminal Cr-Cl bonds on the central metal chain of the adsorbed DPCC chelate was cleaved upon adsorp-tion. The Cl atoms severed from DPCC bonded to the Ga site of the polar sample surface. The lower XPS signal intensity of these atoms, compared to the intensity of the Cl atoms remaining in DPCC, indicated that the severed Cl atoms were buried under the Cl-detached remnants of DPCC. The population distribution of the three Cr chemical states obtained using XPS at low doses revealed that the cleavage of the Cr-Cl bond led to chemi-sorption of DPCC on the GaN surface. The DPCC chelates in the chemisorption layer bonded to the surface via one of the two terminal Cr atoms of their central metal chains. No direct bonding was observed between the peripheral C atoms of DPCC and the surface. Both the preservation of the DPCC chelate structure and the intensity variation of pyridyl ions observed in the SIMS spectra with the exposure, in addition to the presence of three Cr states of equal population, suggested that the chemisorbed DPCC was configured on the surface with one end of the chain anchoring to the surface and the other remaining intact in structure and oriented away from the surface. At high exposures of more than 3.4 L, DPCC chelates physisorbed on top of the chemisorption layer and the physisorption layer grew molecularly. Most of the physisorbed DPCC chelates may be inclined to the surface.
Acknowledgment. This work was supported by ROC
National Science Council (NSC 92-2113-M002-033, NSC 93-2120-M002-011). The authors gratefully thank Dr. Wei-Hsiu Hung and Dr. Yaw-Wen Yang of NSRRC for allowing us to use their instruments. The synchrotron radiation beam time allocated to this work by NSRRC is also acknowledged.
References and Notes
(1) Legard, D. “AMD Fabricates First 10-nanometer Transistor”,
InfoWorld News, Sept. 10, 2002.
(2) Chau, R.; Doczy, M.; Doyle, B.; Stokely, P.; Lionberger, D.; Paulson, N. “30 and 20 nm Physical Gate Length CMOS Transistors,” Silicon Nanoelectronics Workshop in Kyoto, June 12, 2001.
(3) Meindl, J. D.; Qiang, C.; Jeffrey, A. Science 2001, 293, 2044. (4) Heath, J. R. Pure Appl. Chem. 2000, 72, 11.
(5) Brown, K. R.; Lidar, D. A.; Whaley, K. B. Phys. ReV. 2002, A65, 12307.
(6) Poleschak, I.; Kern, J. M.; Sauvage, J. P. Chem. Commun. 2004, 474.
(7) Brouwer, A. M.; Frochot, C.; Gatti, F. G.; Leigh, D. A.; Mottier, L.; Paolucci, F.; Roffia, S.; Wurpel, G. W. H. Science 2001, 291, 2124.
(8) Pease, A. R.; Stoddart, J. F. Mol. Mach. Motor Struct. Bonding 2001, 99, 189.
(9) Collier, C. P.; Wong, E. W.; Belohradsky, M.; Raymo, F. M.; Stoddart, J. F.; Kuekes, P. J.; Williams, R. S.; Heath, J. R. Science 1999,
285, 391.
(10) Grill, L.; Moresco, F.; Jiang, P.; Joachim, C.; Gourdon, A.; Rieder, K. H. Phys. ReV. B 2004, 69, 35416.
(11) Soukiassian, L.; Mayne, A. J.; Carbone, M.; Dujardin, G. Surf. Sci. 2003, 528, 121.
(12) Rubio-Bollinger, G.; Bahn, S. R.; Agrait, N.; Jacobsen, K. W.; Vieira, S. Phys. ReV. Lett. 2001, 87, 26101.
(13) Lung, C.-H.; Peng, S.-M.; Chang, C.-C. J. Vac. Sci. Technol., in press.
(14) Zabala, N.; Puska, M. J.; Ayuela, A.; Raebiger, H.; Nieminen, R. M. J. Magnet. Magnet. Mater. 2003, 249, 193.
(15) Csonka, S.; Halbritter, A.; Mihaly, G.; Jurdik, E.; Shklyarevskii, O. I.; Speller, S.; van Kempen, H. Phys. ReV. Lett. 2003, 90, 116803.
(16) Kobayashi, N.; Brandbyge, M.; Tsukada, M. Phys. ReV. B 2000,
62, 8430.
(17) Tsukamoto, S.; Fujimoto, Y.; Ono, T.; Inagaki, K.; Goto, H.; Hirose K, K. Mater. Trans. 2001, 42, 2253.
(18) Tsao, T. B.; Lee, G. H.; Yeh, C. Y.; Peng, S. M. J. Chem. Soc.,
Dalton Trans. 2003, 1465.
(19) Yeh, C. Y.; Chou, C. H.; Pan, K. C.; Wang, C. C.; Lee, G. H.; Su, Y. O.; Peng, S. M. J. Chem. Soc., Dalton Trans. 2002, 2670.
(20) Shieh, S.-J.; Chou, C.-C.; Lee, G.-H.; Wang, C.-C.; Peng, S.-M.
Angew. Chem., Int. Ed. Engl. 1997, 36, 56.
(21) Sheu, J.-T.; Lin, C.-C.; Chao, I.; Wang, C.-C.; Peng, S.-M. Chem.
Commun. 1996, 315.
(22) Wang, C.-C.; Lo, W.-C.; Chou, C.-C.; Lee, G.-H.; Chen, J.-M.; Peng, S.-M. Inorg. Chem. 1998, 37, 4059.
(23) Chang, C.-C.; Huang, I.-J.; Lung, C.-H.; Hwang, H.-Y.; Teng, L.-Y. J. Phys. Chem. B 2001, 105, 994.
(24) Ould-Metidji, Y.; Bideux, L.; Baca, D.; Gruzza, B.; Matolin, V.
Appl. Surf. Sci. 2003, 212/213, 614.
(25) Choi, H. W.; Rana, M. A.; Chua, S. J.; Osipowicz, T.; Pan, J. S.
Semicond. Sci. Technol. 2002, 17, 1223.
(26) Bellitto, V. J.; Thomas, B. D.; Koleske, D. D.; Wickenden, A. E.; Henry, R. L. Surf. Sci. 1999, 430, 80.
(27) Himpsel, F. J.; McFreely, F. R.; Taleb-Ibrahimi, A.; Yarmoff, J. A.; Hollinger, G. Phys. ReV. B 1988, 38, 6084.
(28) Handbook of X-ray Photoelectron Spectroscopy, 3rd ed.; Physical Electronics Inc.: Eden Prairie, MN, 1995.
(29) Lai, Y. H.; Yeh, C. T.; Hwang, J. M.; Hwang, H. L.; Chen, C. T.; Hung, W. H. J. Phys. Chem. B 2001, 105, 10029.
(30) Neugebauer, J.; Van de Walle, C. G. Phys. ReV. Lett. 1995, 75, 4452.
(31) Limpijumnong, S.; Northrup, J. E.; Van de Walle, C. G. Phys. ReV.
B 2003, 68, 75206.
(32) Sarkar, N.; Dhar, S.; Ghosh, S. J. Phys.-Condens. Matt. 2003, 15, 7325.
(33) Hautakangas, S. Phys. ReV. Lett. 2003, 90, 137402.
(34) Limpijumnong, S.; Van de Walle, C. G. Phys. ReV. B 2004, 69, 35207.
(35) Brillson, L. J.; Levin, T. M.; Jessen, G. H.; Young, A. P.; Tu, C.; Naoi, Y.; Ponce, F. A.; Yang, Y.; Lapeyre, G. J.; MacKenzie, J. D.; Abernathy, C. R. Physica B 1999, 274, 70.
(36) Pakes, A.; Skeldon, P.; Thompson, G. E.; Fraser, J. W.; Moisa, S.; Sproule, G. I.; Graham, M. J.; Newcomb, S. B. J. Mater. Sci. 2003, 38, 343.
(37) Barinov, A.; Gregoratti, L.; Kaulich, B.; Kiskinova, M.; Rizzi, A.
Appl. Phys. Lett. 2001, 79, 2752.
(38) Eberlein, T. A. G.; Huggett, L.; Jones, R.; Briddon, P. R. J.
Phys.-Condens. Matt. 2003, 15, s2897.
(39) Limpijumnong, S.; Van de Walle, C. G. Phys. ReV. B 2003, 68, 235203.
(40) Wright, A. F.; Seager, C. H.; Myers, S. M.; Koleske, D. D.; Allerman, A. A. J. Appl. Phys. 2003, 94, 2311.
(41) Timoshkin, A. Y.; Bettinger, H. F.; Schaefer, H. F. Inorg. Chem. 2002, 41, 738.
(42) “CRC Handbook of Chemistry and Physics”, ed. Lide, D. R.; CRC Press.
(43) Hung, W.-H.; Wu, S.-L.; Chang, C.-C. J. Phys. Chem. B 1998,
102, 1141.
(44) Bermudez, V. M.; Jung, T. M.; Doverspike, K.; Wickenden, A. E.
J. Appl. Phys. 1996, 79, 110.
(45) Klauser, R.; Kumar, P. S. A.; Chuang, T. J. Surf. Sci. 1998, 411, 329.
(46) Chang, C.-C. Nucl. Instrum. Method B 1999, 152, 449. (47) Chang, C.-C.; Hsieh, J.-Y. Phys. ReV. B 1998, 15, 12564. (48) Bermudez, V. M. J. Appl. Phys. 1996, 80, 1190.
(49) Ponce, F. A.; Bour, D. P.; Young, W. T.; Saunders, M.; Steeds, J. W. Appl. Phys. Lett. 1996, 69, 337.
(50) Lee, J.-C. Ph.D. Thesis, National Taiwan University, Taipei, Taiwan, 1999.
Downloaded by NATIONAL TAIWAN UNIV on July 30, 2009