整合平衡計分卡與選擇權定價模型於數位學習之動態衡量與績效改善之規劃與設計
87
0
0
全文
(2) Applying Balanced Scorecard and Option-pricing Methodology for E-learning Dynamic Performance Evaluation Framework Design. Student: Hsiao-Ya Chiu Advisor:An-Pin Chen. National Chiao Tung University Institute of Information Management. Doctoral Dissertation A Thesis Submitted to Department of Institute of Information Management College of Management National Chiao Tung University in partial Fulfillment of the Requirements for the Degree of Doctorial in Information Management Hsinchu, Taiwan, Republic of China 2006/12/30.
(3) Acknowledgments The main goal of this study is to propose a comprehensive e-learning evaluation framework to help organizations analyze the e-learning performance of their employees, and help them make fundamental decisions. In order to maximize the utilization of the proposed model, the evaluation framework must be easy to use, easy to understand, easy to analysis and flexible to various conditions. It is safer to consider ‘e-learning’ as a significant extension of tradition learning instead of replacement. Newer technologies don’t usually replace the older ones, just like new learning methodologies will not always replace the older methodologies. The theories of e-learning are built upon existing learning methodologies with huge difference. This study strongly emphasizes that e-learning could be the paradigm shift of traditional education. Thus, organizations must carefully evaluate their e-learning projects by treating it as a continuous improvement of long term organizational strategies. It is worth to be mentioned that the term ‘assessment’ and ‘evaluation’ is often confused. Assessment refers to the systematic test about ‘component units’ of the system or project while evaluation is much broader than assessment that involves examining information of multiple components and overall views of the system (or project). Performance evaluation also makes judgments on the project’s efficiency and effectiveness. This study focuses on the overall contribution of an e-learning project to the organizations and thus omits the discussions on learning assessment. Finally, and most importantly, I would like to thank my advisor Dr. Chen An-Pin , Ph.D.—a great mentor and friend. I would like to thank my classmate Dr. Chen MuYen, for important suggestion and discussion. Also, I would like to thank my husband Samuel. While I wrote this doctoral dissertation, he simultaneously acted as first line editor of the manuscript, a constant source of encouragement and love..
(4) Content 1. INTRODUCTION ............................................................................................................................ 1. 2. PRELIMINARIES............................................................................................................................ 3 2.1. 2.2. 2.3. 2.4. 2.5.. 3. LEARNING EVALUATION MODELS .............................................................................................. 3 TRADITIONAL LEARNING AND E-LEARNING................................................................................ 7 BALANCED SCORECARD APPROACHES ..................................................................................... 10 QUALITATIVE AND QUANTITATIVE APPROACHES ..................................................................... 12 DEALING WITH UNCERTAINTIES: REAL OPTION ANALYSIS APPROACH ...................................... 13. EVALUATION DESIGN............................................................................................................... 17 3.1. OVERVIEW ............................................................................................................................... 17 3.2. THE METHODOLOGY OF LEARNING EVALUATION ..................................................................... 20 3.2.1. Reaction.............................................................................................................................. 21 3.3. INTEGRATION WITH THE BSC FRAMEWORK ............................................................................. 23. 4. APPLYING THE BLACK-SCHOLES MODEL......................................................................... 29 4.1. OPTION PRICING CONCEPT........................................................................................................ 29 4.2. BSC AND ROA ........................................................................................................................ 32 4.3. ASSUMPTIONS IN THE BLACK-SCHOLES MODEL ....................................................................... 34 4.3.1. Applying the Black-Scholes formula .................................................................................. 34 4.3.2. Designing a BSC sheet and applying the Black & Scholes model...................................... 38. 5. CASE STUDY ................................................................................................................................. 54 5.1. 5.2.. 6. CALCULATING THE BSC INDEX ............................................................................................... 55 OPTION SENSITIVITY ANALYSIS................................................................................................ 64. CONCLUSION ............................................................................................................................... 70. REFERENCES......................................................................................................................................... 71. i.
(5) TABLE Table 1 Examples of qualitative and quantitative factors of e-learning.........................13 Table 2 Three approaches to risk ...................................................................................15 Table 3 Financial options compared to real options ......................................................15 Table 4 The four perspectives in the balanced scorecard of e-learning evaluation .......28 Table 5 Types of exotic options .....................................................................................30 Table 6 The notation for the B & S option pricing model and its application in the BSC analysis..............................................................................................................35 Table 7 The BSC analyzing sheet ..................................................................................38 Table 8 The completed BSC analyzing sheet. ...............................................................58 Table 9 The option sensitivity analysis sheet.................................................................66 Table 10 Summarized information in sensitivity analysis .............................................69. ii.
(6) FIGURE. Figure 1 Comparing the of learning evaluation models ..................................................5 Figure 2 The impact factors of e-learning system evaluation..........................................9 Figure 3 The overview of this study ..............................................................................20 Figure 4 Balance Scorecard: from management viewpoint ..........................................24 Figure 5 Applied BSC approach to e-learning performance evaluation .......................26 Figure 6 The call value obtained by B & S model represents the expected value of an index exceeds its target value. ........................................................................40 Figure 7 The relationship between success and strongly satisfied values. ....................46 Figure 8 The BSC index is summarized from perspectives indexes and objective indexes. ...........................................................................................................53. iii.
(7) Applying Balanced Scorecard and Option-pricing Methodology for E-learning Dynamic Performance Evaluation Framework Design. Abstract A proper e-learning environment is one of the most important knowledge management tools in today’s organizations. However, many of them lack a universal evaluation process to verify their e-learning project’s performance. In an attempt to solve this problem, this study combines the balanced scorecard and the option pricing model to provide an easy to use, easy to understand, easy to analysis framework to evaluate the e-learning environment performance. It proposes an e-learning performance evaluation framework which makes three important contributions: First, it proposes a satisfactory-oriented option analysis methodology that can be applied to evaluate both quantitative and qualitative measurements in the same scale; Second, it constructs a measurement framework to integrate Kirkpatrick’s model, balanced scorecard and Black-Scholes model which may be a good test-bed for e-learning project’s performance evaluation; Finally, it provides an empirical study that demonstrates the analytical procedures to integrate the balanced scorecard and the Black - Scholes model for satisfactory-oriented e-learning performance evaluation.. Keywords: E-learning, learning evaluation, Black-Scholes model, options pricing approach, balanced scorecard approach.
(8) 1. INTRODUCTION. E-learning is a general term involving online training delivered in a synchronous (real-time/instructor-led) or asynchronous (self-paced) format. Modern organizations consider e-learning an efficient and effective tool to enhance the knowledge of their staff members. Because most e-learning projects require considerable amounts of money, time, and human training, it is necessary to establish a performance evaluation model for organizations to make investment decisions. For instance, executives of higher education institutes need sufficient evaluation information to support their investment decisions, such as a digital library with rich streaming media, robust hardware, and extra-large amounts of instruction materials. However, it is just as difficult to measure e-learning project’s performance as it is to evaluate the performance of traditional instructor-led learning. IT factors combined with e-learning environments tend to make evaluation more difficult, including change in learning behaviour, network access efficiency, or database integration. As a result, the effectiveness and efficiency of e-learning has become a controversial issue in recent years.. The main goal of this study is to propose a comprehensive e-learning evaluation framework to help organizations analyze the e-learning performance of their employees, and help them make fundamental decisions. In order to maximize the utilization of the proposed model, the evaluation framework must be 1) easy to use, 2) easy to understand, 3) easy to analysis and 4) flexible to various conditions. After detailed study and 1.
(9) analysis, this study first integrates the balanced scorecard approach (BSC) [1][2][3] and the Black-Scholes analysis (B&S) [4] [5] in order to model an e-learning performance evaluation framework which can be readily applied by most organizations. The remainder of this study is organized as follows. Section 2 provides an overview of the related literature, while section 3 coordinates learning evaluation theories and the balanced scorecard system to design a fundamental framework for e-learning assessment. In section 4 we apply the Black-Scholes analysis to our research via the description of its assumption, application steps, and design concept. Section 5 uses an empirical case study to demonstrate the application and analyzing procedures of the proposed framework. Finally, we draw our conclusion in section 6.. 2.
(10) 2. PRELIMINARIES. In order to construct a complete performance evaluation process of e-learning, this section provides an overview of the literature on learning evaluation, qualitative and quantitative factors, balanced scorecard approach, and options pricing models.. 2.1. Learning evaluation models The first step to design an e-learning performance framework is to study the existed e-learning frameworks. However, e-learning performance evaluation framework is rare. Thus, this study tries to search traditional learning evaluation theories for proper solutions.. Learning evaluation is a crucial topic in schools and human resource development (HRD) departments of any corporation. Although explicit assessment measures can be obtained through an objective standardized test, it is more difficult to capture tacit performance evaluation because it is a time-consuming, labour-intensive task, and the efforts often get swamped due to the bureaucratic inertia of most organizations.. Several remarkable models have tried to approach specific learning or training evaluation from an academic perspective. All these models are adapted to modern day business and social skills such as new technology ability, including the retention by and the affect upon the learner or trainee. They show that learner-reaction and practical 3.
(11) skills extend beyond the originally traditionally imagined manual and physical skills. One of the better known models, Bloom’s Taxonomy of Learning Domains includes content knowledge, comprehension, application, analysis, synthesis, and evaluation [6][7]. Other models that focus on ‘practical skills’ include Dave’s, Simpson’s and Harrow’s psychomotor domain taxonomy [8] [9][10]. Although at present computer and communication technology is still considered a relatively new arrival, these models are seen as reacting to and predicting the future trend of education.. Another well known model on HRD training, from a business perspective, is Kirkpatrick’s learning and training evaluation theory [11][12] which follows the goalbased evaluation approach and is based on four simple questions that translate into four levels of evaluation. These four levels are widely known as reaction, learning, behaviour, and results. Goal-based models may help organization managers to extend their evaluation concerns from purely technical view to other organizational perspectives such as political, knowledge improvement, or return on investment (ROI) [13] [14] [15][16], and thus more flexible for cross field applications.. On the other hand, e-learning integrate not only learning domain but also IT project factors, which means, system-based approaches can also contribute to construct e-learning evaluation model. The most influential models based on the systems approach, include: Context, Input, Process, Product (CIPP) Model [17]; Training Validation System (TVS) Approach [18]; and Input, Process, Output, Outcome (IPO) Model [19]. 4.
(12) While authors from both academic and business perspectives differ in the terminology used to describe the learning evaluation process, this study combined these works based upon Kirkpatrick’s theory (mainly expanded by Phillips ROI model, [16]) and illustrates it as Figure.1. We will discuss the details in the ‘Evaluation design’ section.. Figure 1 Comparing the of learning evaluation models. This. study. applies. Kirkpatrick. model. [11]. for. e-learning. system/environment/project performance evaluation according to the following reasons:. (1) E-learning environment is not limited the use in the nonprofit-oriented educational organizations. Many large commercial firms have provided elearning environment to improve their employees’ knowledge or meet the organization members’ self-learning needs. Thus, e-learning is widely adopted 5.
(13) by various profit or nonprofit organizations. It is reasonable to introduce goalbased model to evaluate the e-learning system which can improve performance of the workplace for various types of organizations. (2) Kirkpatrick’s model has clearly identified that learning performance should be evaluated with knowledge, skills and attitudes perspectives. It is similar to “skill training” concept in computer-based training models. Thus, Kirkpatrick’s model can be easily adopted in an e-learning performance evaluation framework to integrate quantitative and qualitative factors into evaluation process. (3) The Kirkpatrick’s model has been consistently improved in accordance to the managerial revolutions, which makes it easier to be fitted into modern managerial models and easier to be adopted by managers and analysts. Kirkpatrick’s model also helps people inspect the e-learning project with omnibus views. The most important impact is that Kirkpatrick’s model adopts cost perspective that has rarely been discussed in traditional education theories. For example, many schools and government institutes begin to examine the relationship between cost and e-learning systems and argue the appropriateness of ‘Learning for learning’s sake’. Thus, the use of HRD training based Kirkpatrick’s model for e-learning project’s performance evaluation is reasonable.. 6.
(14) It is worth to be mentioned that the term ‘assessment’ and ‘evaluation’ is often confused. Assessment refers to the systematic test about ‘component units’ of the system or project while evaluation is much broader than assessment that involves examining information of multiple components and overall views of the system (or project). Performance evaluation also makes judgments on the project’s efficiency and effectiveness. This study focuses on the overall contribution of an e-learning project to the organizations and thus omits the discussions on learning assessment.. 2.2. Traditional learning and e-learning. Following the emergence of computer-based training (CBT) in 1980s, internetbased learning in 1990s, and web-based live instructor-led training in the new millenniums, the term “e-learning” means an approach that facilitates and enhances learning through both computer and communications technology. Communications technology enables the use of the Internet such as distance learning, web-based learning platforms, collaborative authoring, virtual learning communities, multi-media/rich streaming media, course management software, and digital libraries, reusable learning objects. Organizations can adapt the latest technology to improve their learning environment under budget restrictions. However, it is safer to consider ‘e-learning’ as a significant extension of tradition learning instead of replacement [49]. Newer technologies don’t usually replace the older ones, just like new learning methodologies will not always replace the older 7.
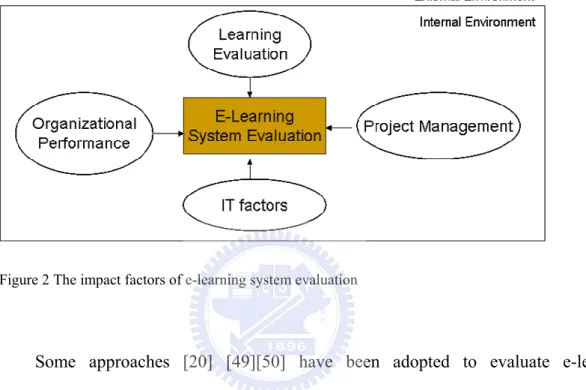
(15) methodologies. The theories of e-learning are built upon existing learning methodologies with huge difference. For example, collaborate learning, active learning, or Internet cognitive courses have been widely adopted along with classroom courses or been blended together with tutorial modules. E-mails, forums, web pages, multimedia, Blog, or Wikipedia have been applied as new tools of learning. Meanwhile, the learner’s behavior change from traditional learning to e-learning cannot be ignored. This study strongly emphasizes that leaning from Internet and computer-assisted tools could be the paradigm shift of traditional education. Thus, organizations must carefully evaluate their e-learning projects by treating it as a continuous improvement of long term organizational strategies. E-learning is expected to provide a higher quality learning experience, available anytime and anywhere, effectiveness/efficiency and with an even greater cost saving regarding the traditional learning environment. However, the effectiveness/efficiency of e-learning has become a controversial issue in the past few years. Many teachers disagree that the e-learning environment is a better way for learning, while others (mostly system developers) try to verify the performance of e-learning because ‘elearning’ is a fuzzy and growth domain which contain countless impacting factors which change quickly over time. For examples, e-learning materials can be instructorled or self-directed (without instructors), scheduled or unscheduled, synchronous or asynchronous depending on the topics and organizations/trainers/learners requirements. ‘E-learning evaluation’ especially complex because it must integrate four distinct domain includes: learning evaluation, IT improvement, project management, organizational management as shown in Figure 2. Although the formal or informal 8.
(16) benefits of e-learning systems cannot be properly identified by most organizations, most organizations agree that e-learning may cause ‘paradigm shift’ of learning behavior and thus increase the organization’s tangible or intangible value.. Figure 2 The impact factors of e-learning system evaluation. Some approaches [20] [49][50] have been adopted to evaluate e-learning effectiveness such as comparison with traditional learning, tools and instruments, product evaluation, performance evaluation, return on investment, or comparison with a hypothetical system. Nevertheless, all these methods lack universal and quick analytical procedures. This study tries to construct an analytical framework to evaluate e-learning project’s performance with objectives listed below: •. Be easy to understand. •. Be ready to use. •. Be easy to analysis. •. Be readily applied by most organizations. •. Performs top-down analysis 9.
(17) •. Be target-oriented. •. Provides flexibility. •. Provides real time analysis capability. •. Provides managerial information about the project’s success. This study proposes a comprehensive framework with the above objectives by integrating learning evaluation model, balanced scorecard, and options pricing analysis for e-learning project’s performance evaluation.. 2.3. Balanced scorecard approaches. The balanced scorecard (BSC) was first developed in the early 1990s [1][2][3] and became widely adapted for determining business strategies. The underlying concept of the BSC is a combination of the measurement system with the management system, enabling senior management to make quick and effective strategic decisions for the future. The most widely adapted function of the BSC is the management performance system which can be used in any size organization to align its vision and mission by demonstrating four different dimensions: financial (result), customer (reaction), internal process (operation/behavior), and capacity (learning and growth). Several articles have found that the BSC system can be adapted to the evaluation of learning performance [21], while others discussed its application in tacit knowledge management [22]][23]. 10.
(18) All these articles can help us to organize the confusion of e-learning evaluation by means of the BSC tool, something which has never been quite done before. Balanced Scorecard (BSC) is a methodology to solve challenges in balancing the theories of a strategy with its execution. It has the following advantages: z. The methodology is qualified for managing business strategy from top-down aligns strategic goals with objectives, targets, and metrics.. z. z. It provides a balance between certain relatively forces: 9. Internal and external influences. 9. Leading and lagging indicators. 9. Financial and non-financial goals. It cascades to all levels of the organization.. Kaplan and Norton originally addressed the four perspectives (learning, internal, customer, financial) that can guide companies as they translate strategies into actionable terms. But they do not obligate that these perspectives are necessary and sufficient conditions for success. However, BSC suggests that organizations can apply different perspectives that are more relevant to their missions or goals rather than the original ones. It is important to note that in mission-driven organizations like schools, government, or nonprofits-oriented organization, the mission is not limited to the financial goals (but could include financial items). A BSC planning must be designed. 11.
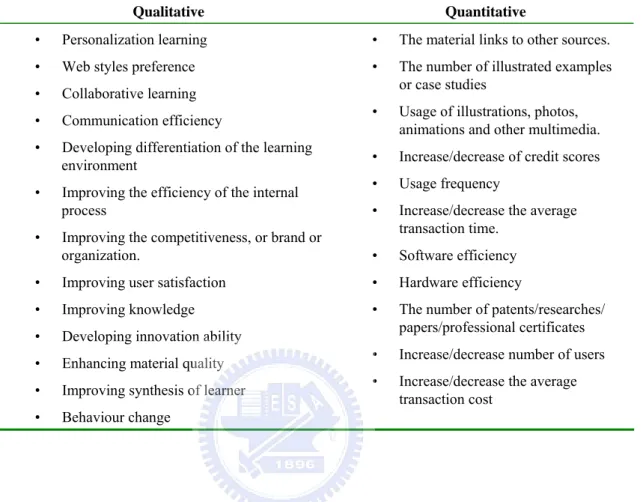
(19) according to the goals and missions of the organization in order to apply e-learning environment to increase the firm’s competition capabilities and values.. 2.4. Qualitative and quantitative approaches. Qualitative and quantitative approaches are widely adopted to evaluate e-learning performance. The qualitative research approach is generally accomplished by using the outcomes of a pilot study, the reviews of researchers, expert interviews, critical success factors method (CSFs), and questionnaires for exploring specific human problems. In contrast, a quantitative research approach represents a tangible, visible and comparable ratio. For example, assessing learner experience is a qualitative factor, while system usage could be represented as a login frequency through analyzing a system log file. This study expands qualitative and quantitative factors (briefly listed in Table 1.) to a BSC metric which forms the questionnaire in our research. There are several important tasks that must be clarified [24] when we design a questionnaire, including both qualitative and quantitative indicators: (1) Some of the indicators will be transformed into a quantitative form by grading or specifying a numerical evaluation scale; (2) Normalizing of the indicators will be done through a general unified grading scale; (3) Defining the weights of the indicators. The main contribution of this study will be to demonstrate, based on the results, how to integrate the option pricing analysis approach into the e-learning performance evaluation.. 12.
(20) Table 1 Examples of qualitative and quantitative factors of e-learning Qualitative. Quantitative. •. Personalization learning. •. The material links to other sources.. •. Web styles preference. •. •. Collaborative learning. The number of illustrated examples or case studies. •. Communication efficiency. •. Usage of illustrations, photos, animations and other multimedia.. •. Developing differentiation of the learning environment. •. Increase/decrease of credit scores. •. Improving the efficiency of the internal process. •. Usage frequency. •. Improving the competitiveness, or brand or organization.. Increase/decrease the average transaction time.. •. Software efficiency. •. Improving user satisfaction. •. Hardware efficiency. •. Improving knowledge. •. •. Developing innovation ability. The number of patents/researches/ papers/professional certificates. •. Enhancing material quality. •. Increase/decrease number of users. •. Improving synthesis of learner. •. Increase/decrease the average transaction cost. •. Behaviour change. •. 2.5. Dealing with uncertainties: real option analysis approach. Every project has to face uncertainties (risks). Each strategy manager has to deal with uncertainties. There are essential three tools (Table 2) that a manager can use to evaluate corporate risk and uncertainty: 1) capital budgeting method, 2) portfolio analysis and 3) option pricing. The capital budgeting method is a planning process used to determine a firm’s long term investment. The most representative capital budgeting method is net present value (NPV) analysis. In this method, the analyst looks at projects in isolation and determines the individual cash flow that each project may generate and discounts those to today’s 13.
(21) value at a project-specific discount rate which indicates the perceived risk of the cash flows [25]. Risk is indirectly measured as the discount rate that represents the opportunity cost of capital. Portfolio analysis method looks at the investment project in relation to the existed assets and projects. The most popular one is capital asset pricing model (CAPM) [26]. The manager identified individual project’s relative risk contribution to the overall risk profile of the portfolio. Each project will be compared in its risk/return profile to preestablished benchmarks that the manager only allows those risk-reducing project to be added into the existed projects (portfolio) while preserving or enhancing returns. Among the three methods, only option pricing method directly analyzes the project-specific risk. An option is a privilege sold by one party to another that offers the buyer the right, but not the obligation, to buy (call) or sell (put) the underlying asset at an agreed-upon price during a certain period of time or on a specific date. In a managerial view, an option represents the freedom of choice after the revelation of information and also the act of choosing alternatives. A “real” option is an option related to “things” such as fixed, permanent or immovable things as opposed to illusory things. Applying real options analysis (ROA) into real world applications is valuable to provide managerial insight and the analytical process is flexible to meet various conditions. The initial ROA framework focuses on the increased value of abandoning a project and liquidating the assets [27]. Thus, the core concept of ROA is based on the effectiveness of resource rearrangement to maximize the entire system performance [28]. The ROA approach treats each project (or objective) as an investment under uncertainties (risks) that also consumes a certain amount of resource (cost). If the 14.
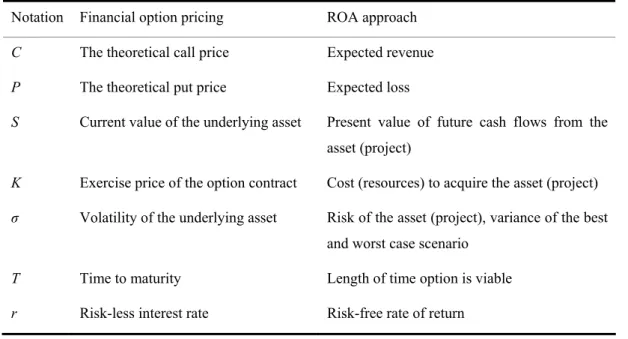
(22) anticipated return (call value) of the project exceeds the consumed resource then the project is worth for investment. By abandoning less profitable projects to save resource, an organization can inject more resource into better profitable projects and obtain more values. Thus, the dynamic relocating strategy of ROA provides the flexibility for managers to fine tune their organizational resources when facing uncertainties.. Table 2 Three approaches to risk Method. Approach to Risk. Instrument. Capital Budgeting. Indirect. Discount Rate. Portfolio Analysis. Relative. Benchmark. Direct. Probability. Option Pricing. In practical use, a typical ROA analysis uses different parameter sets compared to financial options as illustrated in Table 3. Table 3 Financial options compared to real options Notation. Financial option pricing. ROA approach. C. The theoretical call price. Expected revenue. P. The theoretical put price. Expected loss. S. Current value of the underlying asset. Present value of future cash flows from the asset (project). K. Exercise price of the option contract. Cost (resources) to acquire the asset (project). σ. Volatility of the underlying asset. Risk of the asset (project), variance of the best and worst case scenario. T. Time to maturity. Length of time option is viable. r. Risk-less interest rate. Risk-free rate of return. 15.
(23) The ROA approach has been widely adopted for evaluating information technology investments in the early 1990s which was almost synchronized with the explosive growth of the computer and the Internet era. Applying financial models to the IT fields in prior research can be summarized into several topics. First is the topic of how to measure IT investment risk [29][30][31][32][33]. For example, Michel Benaroch proposed an approach on managing IT investment risk and illustrated how to apply this approach to an IT investment under an Internet sales channel. Chemon and Weber did early research on real options that could be applied to managing IT investment risk. Second, several published works used ROA to analyze the growth opportunities as a result of prototypes of new IT infrastructures being launched [34][35][36]. For example, Benaroch and Kauffman investigated the problem of investment timing using the BlackScholes model in a real-world case study, dealing with the development of point-of-sale (POS) service. Third, ROA also applies to several specific topics such as electronic banking, digital government, and knowledge management [34] [23] [37]. Although ROA approach has been widely adopted by IT applications, it needs further modifications to meet the e-learning requirements. For example, while elearning investment can be valued by money, its system performance is difficult to be monetarily evaluated. This study proposes a theoretical grounding in which the BlackScholes model [5] and the BSC approach can be combined and applied to e-learning performance evaluation. Furthermore, it also proposes guidelines for the design to ensure that the BSC indicators follow the Black-Scholes assumptions, as discussed in section 4, followed with an empirical study in Section 5.. 16.
(24) 3. EVALUATION DESIGN. This section coordinates learning evaluation theories and the balanced scorecard approach to design a fundamental framework for evaluating e-learning activities. The key objective of this study is to provide easy to use, easy to understand, easy to analysis and flexible e-learning project performance evaluation framework.. 3.1. Overview. The original idea of this study came from the research of Financial Labs design of National Chiao Tung University. In order to evaluate of the Financial Labs performance, this study searched for e-learning environment performance evaluation models but found out that there was only a few papers discussed this topic because e-learning system performance is difficult to be evaluated. Thus, this study began to design a practical framework to help strategy makers evaluate their overall e-learning environment performance.(as show in Figure 3) The first step to establish an e-learning evaluation framework is to search for existed learning performance evaluation models from both academic and human resource fields. After comparing each evaluation theories, this study finds out that the Kirkpatrick’s model is better fitted for modern e-learning situations because it is a goalbased approach model. A goal-based model basically follows a top-down decision making procedure that the responsible manager must first identify the organization’s goal and make decisions based on how to achieve the goal. The top-down strategy planning method is widely adopted by organization managers. This study further 17.
(25) modified the Kirkpatrick’s model based on the e-learning characteristics for managerial purposes. After determined the basic evaluation theory, the second step is to design an analytical tool to help strategy makers determine their e-learning environment performance. After studied modern strategy planning tools, this study found that the BSC approach is widely adopted by modern organizations. BSC approach is also a topdown planning tool that has explicit procedures for an organization to plan and evaluate their organizational performance in a goal-oriented perspective. Meanwhile, the BSC approach is able to evaluate qualitative objectives while lots of e-learning objectives cannot be properly quantified. In order to apply the BSC approach, a strategy maker has to firstly identify the organization’s e-learning goals then properly define the major perspectives of the elearning project while each perspective has its own goals. In order to achieve the perspective goal, the manager has to identify the objectives for each perspective and setup objective target that must be achieved. By evaluating each objective, the strategy maker can quickly understand each objective’s performance and make planning decisions. However, traditional BSC approach lacks quantitative capability for a manager to identify each objective’s impact to the entire project because each objective is measured in its own scale. For example, one objective’s target may be “user number exceeds 2,000” while another objective’s target may be “over 90% users are satisfied with our elearning system”. Different measurement scale makes the individual impact difficult to. 18.
(26) be addressed. For example, what is the total performance of the project if there are 10 objectives in a perspective and 5 of them failed? Traditional BSC analysis cannot answer this question. In order to identify the individual impact of each objective, this study tries to normalize all the objective performance into a single scale “satisfactory”. The use of “satisfactory” is based on the intrinsic characteristic that learning performance cannot be monetarily measured. Commercial project can be evaluated by its revenue and cost but the learning performance can only be measured by its “satisfactory”. The satisfactory comes from the user, the user’s families, the organization and the society. The e-learning project will be successful if most people (from outside and inside) feel satisfied to the organization’s e-learning environment. If all the objectives’ performances are evaluated in the same scale of satisfactory, then the individual performance impact can be measured. Although this study has modified BSC measurement method to provide more managerial information, this model cannot reveal the most important information: 1) will this project success? 2) what is the key success/failure objective? E-learning environment/system planning is a long term process. Meanwhile, the satisfactory level may change due to internal or external situations. For example, one user may suddenly feel the e-learning system is obsolete just because he occasionally visits a new web-site. It is important for a manager to deal with uncertainties and makes decisions to ensure the success of the project. There are three tools for a manager to deal with uncertainties (risks): 1) capital budgeting method, 2) portfolio analysis model and 3) option pricing models. This study applies option pricing model because it provides a direct measurement of the uncertainty via probability. Meanwhile, option pricing models also 19.
(27) provide well developed analytical tools to help a manager address the key success/failure factors via sensitivity analysis tools. Thus, this study is based on Kirkpatrick’s model and integrates the BSC and option pricing tools to design the elearning system performance evaluation framework.. Figure 3 The overview of this study. 3.2. The methodology of learning evaluation. As this study mention in preliminary section, authors from both academic and business perspectives differ in the terminology used to describe the learning evaluation process; this study combined these works based upon Kirkpatrick’s theory. This theory makes it easy to integrate the qualitative and quantitative indicators of e-learning performance evaluation into four levels: reaction, learning, behaviour, and Result. Derived from Kirkpatrick’s theory, the Phillips’ model adds the fifth level “ROI” and 20.
(28) provides a more acceptable form of learning measurement which can be adapted to the well known balanced scorecard approach (BSC). In order to simplify the measurement process, the ROI level is merged into Kirkpatrick’s ‘result’ level and which is mapped to ‘Value’ perspective in this study. 3.2.1. Reaction Reaction evaluation is finding out how the learners feel about their learning experience. This can often be examined by feedback forms, verbal reaction, posttraining surveys, online grading, written reports, or questionnaires. For example: Do learners enjoy their training? Do they like the venue, style, domestics, and timing? How about their participation level? 3.2.2. Learning Learning evaluation is the measurement of the increase in knowledge, skill, and attitudes changed from before to after the learning experience. There are several tools that are often used to assess the learning effect, including: tests (mostly simple approach), interview or observation before/after the training, or analyzing the inconsistencies of the assessment by statistics. For instance, do learners realize what subject they intended to be taught? How about the change in the learning curve? Do learners increase their IT capabilities? 3.2.3. Behaviour Behaviour evaluation is the extent to verify the behaviour change after the learners applied the knowledge they learned. Observations, interviews, or questionnaires are. 21.
(29) performed anonymously over a period of time to assess such change. For example, Do learners work in a more effective way after training when they are back to the job? How about the status of sharing an organizational culture? Do the learner like the training program and begin to apply the new skill? It is difficult but important to understand whether the knowledge, skills and/or attitudes learned in the program transfer to the job. The complexity of behaviour evaluation discourages most organization managers from even making an attempt to evaluate the Behaviour level. But Kirkpatrick suggests that ‘something beats nothing’ and he encourages managers/ trainers to perform some behaviour evaluation even if it is not elaborate or scientific. For example, forming a simply questionnaire to ask learners: Are you doing anything different on the job because you attended the e-learning program? Do you plan to change some of your behaviour in the future after attended the e-learning program? 3.2.4. Value (Result) This perspective is typically the organizational key performance indicators such as volumes, values, percentages, timescales, return on investment, and other quantifiable aspects. For example, the result will be better quality of work, more productivity, cost reduction, fewer mistakes, increasing sales. But in most situations on e-learning planning, the “results” are generally intangible. For example, to evaluate the organizational value, culture, social responsibility, reputation, or comparing these stuff with the other competitors. Thus, the evaluating items must be changed. The goals of each e-learning project may change and thus the 22.
(30) organization cannot expect to obtain “tangible” returns in all cases. This study will follow the ‘result’ concept of Kirkpatrick model and represent it to the term ‘Value’ to combine the general qualitative and quantitative factors into e-learning project evaluations.. 3.3. Integration with the BSC framework. After determined the Kirkpatrick’s model as the major evaluation theory, this study began to design the e-learning project’s performance evaluation framework. This study suggests that the entire e-learning project performance cannot be simply verified by the students’ final assessment. The e-learning project must be verified by all aspects of the entire project. Thus, this study searched popular strategy planning and evaluation models and chose the balanced scorecard as the major analytical framework. The balanced scorecard (BSC) was first proposed in the 1990s by Kaplan and Norton. In it vision, mission, and objectives are decomposed into different views, or perspectives, as summarized through the eyes of business owners, customers, managers, employees, and stakeholders. The owners are represented by the ‘Financial’ perspective, customers and stakeholders are represented by the ‘Customer’ perspective, managers by the ‘Internal Business Process’ perspective, and employees by the ‘Learning and Growth’ perspective. The objectives and the correlative weights can be seen as the complete views of a business.. 23.
(31) Compared to the traditional Bottom-Up planning process of MIS fields [48], BSC introduces the Top-Down concept for strategy planning. BSC suggests an organization first address the project’s vision and strategy by the organization’s core competence to determine the major perspectives and then downward to identify individual objectives and its objective targets to evaluate the project performance. Thus, BSC approach emphasizes that the organization should use a global view to evaluate the entire project and identify those unsuccessful objectives that have to be improved.. Figure 4 Balance Scorecard: from management viewpoint (Source: Niven;2002 [48]). The use of BSC approach in this study is that the Taiwan government promotes BSC concept to general firms. Thus, lots of Taiwanese organization managers and decision makers are familiar to BSC framework and feel easy to understand its applications. Introducing the BSC approach the e-learning project’s performance evaluation can reduce the learning time of the decision makers. Meanwhile, BSC approach possesses definite analytical procedures that a decision maker can acquire 24.
(32) feasible results by predefined steps. The BSC approach has been proved and well adopted by real world organizations that can be readily to be applied for most organizations without too many difficulties. Thus, the BSC approach also meets this study’s objective: “flexible”, “easy to use” and “easy to understand”.. The balanced scorecard (BSC) was first proposed in the 1990s by Kaplan and Norton. In it vision, mission, and objectives are decomposed into different views, or perspectives, as summarized through the eyes of business owners, customers, managers, employees, and stakeholders. The owners are represented by the ‘Financial’ perspective, customers and stakeholders are represented by the ‘Customer’ perspective, managers by the ‘Internal Business Process’ perspective, and employees by the ‘Learning and Growth’ perspective. The objectives and the correlative weights can be seen as the complete views of a business. The BSC has evolved over time to become a full performance management system applicable to both private sector and public sector organizations, such as schools, government, or other non-profit organizations or institutes. Just by shifting the emphasis of the measurement of financial and non-financial performance, many researches ingeniously modified the vision, mission, and objectives of the four perspectives. For example, the e-learning mission may be the improvement of the overall knowledge management (KM) capabilities or increase the competitiveness of employees for a private sector firm. For a public sector organization like schools, the e-learning mission may be the increment of public reputations or improvement of educational qualities.. 25.
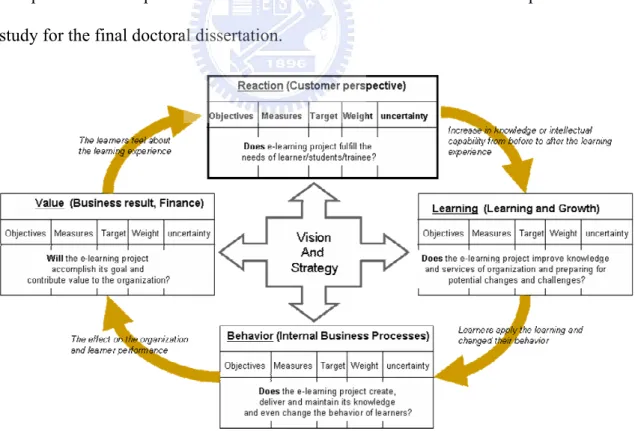
(33) Based on the learning theory summarized in section 3.2 and the e-learning characteristics, this study refined the four perspectives of the BSC into Kirkpatrick’s theory as (also shown in Figure 5 with a detailed description in Table 2): (1) The reaction of the students or trainees is represented by the ‘Customer’ perspective; (2) Learning effect of learners is represented by the ‘Learning and Growth’ perspective; (3) Behavioural change of all participants of e-learning is represented by the ‘Internal business process’ perspective; and (4)Results (including financial or non-financial factors, learning efficiency/effectiveness, social reputations, organizational value) are represented by. the ‘Value’ perspective. Based upon the modified e-learning. perspectives and B & S assumption, this study designed a questionnaire composed of the qualitative and quantitative indicators as mentioned in section 2.4 to perform a case study for the final doctoral dissertation.. Figure 5 Applied BSC approach to e-learning performance evaluation. 26.
(34) The performance evaluation of an e-learning project can be seen as a subset of tacit knowledge assessment, and is distinct from the traditional BSC approach of a business from several viewpoints: (1) Schools and educational institutes are focused mainly on the learning evaluation rather than the financial return on investment. The term “learning evaluation” is different to “learning assessment”. “Learning assessment” emphasizes on the “assessment” of learning while “learning evaluation” includes qualitative factors like the behaviour change and social reputations (2) Students (learners, trainee) play a principal role in learning activities covering all four perspectives of the BSC, and are especially representative of the ‘Customer’ perspective. However, for a nonprofits oriented firms like schools, the customers can be students, government, general publics and organization members. (3) The cause and effect linkage of e-learning perspectives is different from the BSC’s original sequence.. A typical BSC procedure suggests that the organization first build up a strategy map to describe the relationship between four perspectives. The relationship between the four perspectives is that “learning and growth” generates the change of “internal process”, the improvement of “internal process” may obtain the positive reactions of “Customer”, and the positive reactions of “customer” will produce the “financial return”. However, if learning performance evaluation applies the BSC approach then the cause and effect linkage should be reorganized so that the organization anticipates the positive reaction of the e-learning system can improve the overall learning effectiveness thus changes the learner’s behaviour then improves the organization’s value as described in. 27.
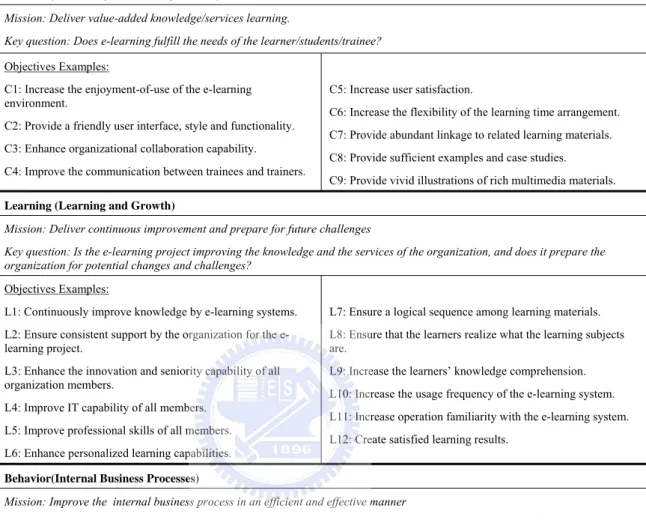
(35) Table 4 The four perspectives in the balanced scorecard of e-learning evaluation Reaction(Customer, ex. students, trainees) Mission: Deliver value-added knowledge/services learning. Key question: Does e-learning fulfill the needs of the learner/students/trainee? Objectives Examples: C1: Increase the enjoyment-of-use of the e-learning environment. C2: Provide a friendly user interface, style and functionality. C3: Enhance organizational collaboration capability. C4: Improve the communication between trainees and trainers.. C5: Increase user satisfaction. C6: Increase the flexibility of the learning time arrangement. C7: Provide abundant linkage to related learning materials. C8: Provide sufficient examples and case studies. C9: Provide vivid illustrations of rich multimedia materials.. Learning (Learning and Growth) Mission: Deliver continuous improvement and prepare for future challenges Key question: Is the e-learning project improving the knowledge and the services of the organization, and does it prepare the organization for potential changes and challenges? Objectives Examples: L1: Continuously improve knowledge by e-learning systems.. L7: Ensure a logical sequence among learning materials.. L2: Ensure consistent support by the organization for the elearning project.. L8: Ensure that the learners realize what the learning subjects are.. L3: Enhance the innovation and seniority capability of all organization members.. L9: Increase the learners’ knowledge comprehension.. L4: Improve IT capability of all members. L5: Improve professional skills of all members.. L10: Increase the usage frequency of the e-learning system. L11: Increase operation familiarity with the e-learning system. L12: Create satisfied learning results.. L6: Enhance personalized learning capabilities. Behavior(Internal Business Processes) Mission: Improve the internal business process in an efficient and effective manner Key question: Does the e-learning project create, deliver and maintain its knowledge and services in a more efficient manner? Objectives examples: I1: Provide a differentiated e-learning environment. I2: Provide incentive systems for the users. I3: Generate a nurturing organization culture. I4: Motivate effective learning activities.. I5: Improve the role playing capabilities during learning activities. I6: Encourage knowledge sharing between members. I7: Generate a change to better learning behaviour. I8: Provide an efficient and effective learning environment. Value(Finance, Results) Mission: Contribute to the value of the institute/school Key question: Does the e-learning project improve the learning efficiency/effectiveness? Will the e-learning project accomplish its goal and contribute value to the organization? Objectives Examples: F1: Increase the value of the organization.. F6: Increase knowledge absorption.. F2: Share knowledge with other organizations.. F7: Increase the number of research achievements.. F3: Provide a high quality knowledge and information platform.. F8: Increase the number of online users.. F4: Increase the reputation of the organization.. F9: Reduce learning costs.. F5: Improve the organization's competitiveness.. 28.
(36) 4. APPLYING THE BLACK-SCHOLES MODEL. It has been explained by Cox and Ross (1976) that the option price is the expected value of payoff discounted at the risk-free interest rate over the risk-neutral distribution of the underlying asset [4]. In order to obtain the proper value of options, the field of finance has developed many sophisticated option pricing models to determine a contract value of the underlying asset under uncertainties. Among these option pricing models, the Black & Scholes (1973) model (B & S model) is the most popular one, and it has been widely adopted in real world applications. Although the B & S model was originally designed to evaluate the option value, it has been widely adopted in various applications to determine the expected value of any target under uncertainties. This study applies the B & S model and makes two major contributions: (1) it provides a theoretical grounding for the B & S model so that it can be applied to BSC applications; (2) it proposes a measurement framework that enables managers to analyze and optimize e-learning performance. The final doctoral dissertation will also present an empirical case study to demonstrate the analyzing process of e-learning environments.. 4.1. Option pricing concept. The term “option” is a privilege sold by one party to another that offers the buyer the right, but not the obligation, to buy (call) or sell (put) the underlying asset at an agreed-upon price during a certain period of time or on a specific date (final settlement 29.
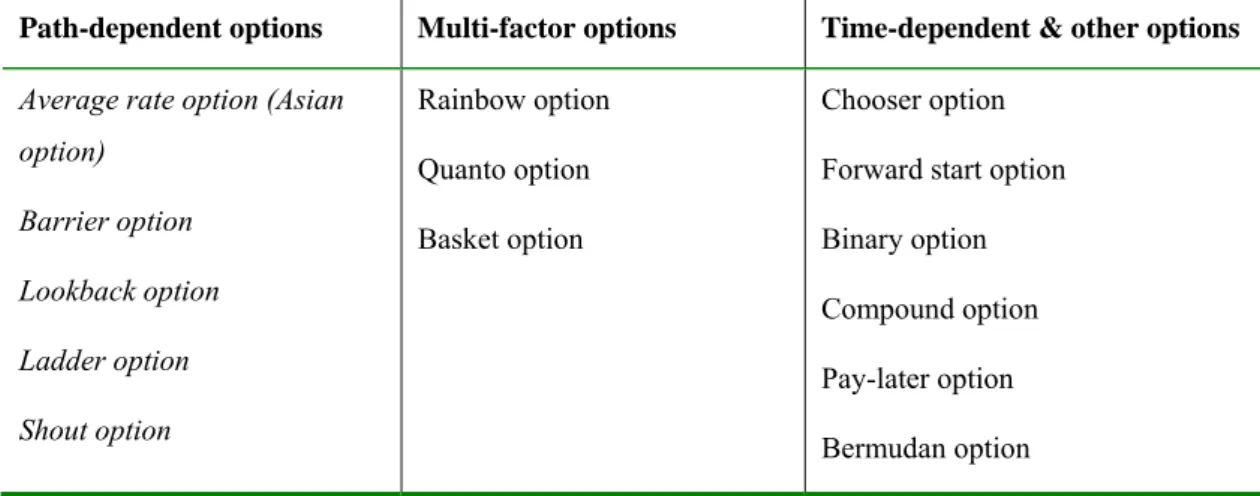
(37) date). There are two major types of options existed: 1) plain vanilla option and 2) exotic options. Plain vanilla option is the first generation options, for example, European options and American options. The payoff of a plain vanilla option is determined by the final settlement price of the underlying asset at maturity. American option allows early exercise which enables an investor executes his privilege before final settlement date. On the contrary, European option does not allow early exercise. Besides plain vanilla options, there are three types of exotic options: 1) pathdependent options, 2) multi-factor options and 3) time-dependent options (illustrated in Table 5). The option price of a path-dependent option is determined by the “path” of the underlying asset before maturity. The multi-factor option’s price is determined by two or more underlying assets. The time-dependent option determines the price by time and the underlying asset’s current value. Table 5 Types of exotic options Path-dependent options. Multi-factor options. Time-dependent & other options. Average rate option (Asian. Rainbow option. Chooser option. Quanto option. Forward start option. Basket option. Binary option. option) Barrier option Lookback option. Compound option. Ladder option. Pay-later option. Shout option. Bermudan option. 30.
(38) This study uses European option to evaluate the BSC objectives because the proposed framework is to evaluate if the system performance can exceed the organization’s target at the specific date, which perfectly fits the European option’s conditions. The option price is the expected value of the payoff discounted at the risk-free interest rate over the risk-neutral distribution of the underlying asset. Thus, given the price S and an agreed-upon price K during a certain period of time T of the underlying asset, the option value can be described as follows: C = E(Max(S-K, 0)) P = E(Max(K-S, 0)) Where C denotes the call option price, P represents the put option price, and E(.) is the expected value. In the real world the price of most assets varies constantly, and this variation is described as volatility σ. An option pricing model is used to calculate C or P of the underlying asset under the circumstances (S, K, σ, T, r). That is to say, to obtain the expected value of S > K for a call option, or S < K for a put option with a given set of (S, K,σ, T, r). Because the price can be viewed as an index of the underlying asset the option pricing model is ideal to evaluate the expected value of any index S higher or lower than a target value K with uncertainty σ over a specific time T and with an anticipated growth rate r. The most classical of option pricing approaches is the BS model, which assumes that the payoff of the underlying asset follows the geometric Brownian motion and has a 31.
(39) lognormal distribution with constant volatility and risk-free interest rate before maturity. Since the development of the BS model, more realistic option pricing methodologies have been developed, including: (a) the stochastic interest-rate/volatility option model [38][39][40]; (b) jump-diffusion related models [41][42]; (c) Markovian models [43][44]; and (d) stochastic-volatility jump-diffusion models [45][46]. However, all these models focus on identifying the “right” distributions and pricing options (especially financial options) using close form formulas. This study applies BS model to evaluate the BSC index because BS model formula is simple and easy to be implemented with modern spread sheet packages. The other reason is that this study designs the BSC measures under BS assumptions in order to provide reasonable evaluation procedures with theoretical supports. If this study applied other pricing model, for example diffusion model, the objective measurement procedure must be changed to generate fat-tailed distributions in stead of log-normal distributions.. 4.2. BSC and ROA. Although both BSC and ROA approaches are well adopted by modern organizations for strategy planning, there is no existed application that integrates BSC and ROA for strategy planning use. Marion (2003) suggested that the integration of BSC and ROA would be ideal to provide a more powerful strategy planning framework [47], but he could not propose any practical solution to combine these two approaches. However, this study finds out that an organization can use the traditional BSC model to. 32.
(40) perform top-down strategy planning and applies the ROA model to analyze the elearning project’s expected performance. The difficulties of evaluating and analyzing e-learning performance were discussed in section 2. Since the option pricing model can calculate and analyze the expected value of a certain asset (or any performance index), it is ideal for managers to evaluate the performance of each e-learning BSC objective for the following reasons: (1) E-learning investments are often made without any tangible payback that can be evaluated as a real amount of money. However, by applying the BSC to convert elearning performance into a satisfactory index, the analyst can take this value into the option pricing model as the underlying asset price for management or strategy planning use. The decision maker can thus quantify each objective in the scale of satisfactory and obtained the expected value that each objective exceeds its target (satisfactory degree). Because all the objectives are measured in the same scale, the whole BSC framework can be treated as a satisfactory portfolio and applies sensitivity analysis to evaluate the individual impact of each objective to address the key success/failure objectives. (2) E-learning performance varies frequently and is hard to be forecasted precisely. For example, the performance index value may change just because of the introduction of new technology, new learning material, or new learners. The option pricing model is applied intuitively in the calculation of the expected gain (call value) or loss (put value) of such index over a specific time. Thus, the manager can directly measure the uncertainties via option pricing methodology.. 33.
(41) This study modified the ROA approach to evaluate the e-learning performance of each BSC objective with B & S model to calculate the expected value if each objective can exceed its target value.. 4.3. Assumptions in the Black-Scholes model. The B & S model was originally developed to price the European option of an asset that does not pay any dividend or make distributions. The underlying asset can be a real asset (for example, gold, corn, and soybean options) or an index (for example, S & P 500 index option). The basic assumptions of the B & S model are: (1) the price of the underlying asset follows a geometric Brownian motion with lognormal asset returns, (2) with constant volatility throughout the lifetime of the contract, (3) the underlying asset’s price varies continuously, (4) there are no risk-less arbitrage opportunities, and (5) this underlying asset is traded in a perfect capital market. Although virtually no asset satisfies all the assumptions described above, the B & S model still remains widely adopted by most financial experts (for example, in stock options applications). Assumptions 4 and 5 are related to financial market behaviours. However, other assumptions must be addressed in BSC related application which will be discussed in the following sections. 4.3.1. Applying the Black-Scholes formula The core concept of the B & S model is that, assuming that there exists a portfolio containing a certain stock and its call option, adjusting the proper hedging ratio (ratio between stocks and its call options) can transiently maintain this portfolio in a risk-less 34.
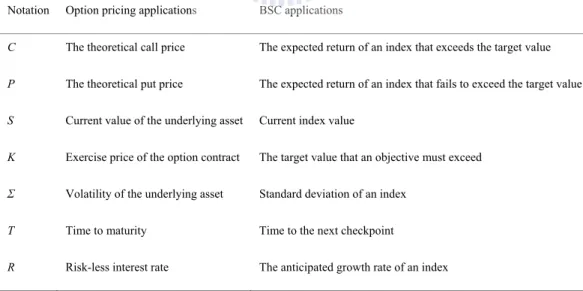
(42) state. If there are no arbitrage opportunities, then this portfolio merely makes risk-free returns. With this concept, Black and Scholes derived the option pricing formula: C = SN ( d 1) − Ke − rT N ( d 2 ) P = Ke − rT N ( − d 2 ) − SN ( − d 1) where d1 =. ln(. σ2 S ) + (r + )T K 2 σ T. d 2 = d1 − σ T. Note that N(.) denotes the cumulated normal distribution, C is the call option price, P is the put option price, S is the spot price of the underlying asset, K is the exercise price, T is the remaining time to maturity (in years), σ is the volatility of this underlying asset, and r is the risk-less interest rate. This study employs the notation of the B & S parameters, as per Table 3, to perform the BSC analysis. Table 6 The notation for the B & S option pricing model and its application in the BSC analysis Notation. Option pricing applications. BSC applications. C. The theoretical call price. The expected return of an index that exceeds the target value. P. The theoretical put price. The expected return of an index that fails to exceed the target value. S. Current value of the underlying asset. Current index value. K. Exercise price of the option contract. The target value that an objective must exceed. Σ. Volatility of the underlying asset. Standard deviation of an index. T. Time to maturity. Time to the next checkpoint. R. Risk-less interest rate. The anticipated growth rate of an index. Traditional ROA approach evaluates each investment as “if this investment’s revenue exceeds the cost discount the risk-less interest rate”. Thus, the K value of ROA. 35.
(43) is the cost (generally total cost) of the project and the S value is the current value of the specific project. This study uses satisfactory index to indicate each objective’s performance instead of the revenue measurement and thus the ROA parameters must be modified. (1) The goal: The goal of an e-learning project is to satisfy all users, the organization members and society anticipations. Because many educational organizations are not profit-oriented, the performance of the e-learning project usually cannot be evaluated by its anticipated revenue. For this reason, this study uses “satisfactory” to indicate the project’s performance. Each objective is evaluated by the satisfactory degree of users, organization members or decision makers. (2) K value: ROA approach uses the project’s cost as the K value (exercise value). This study uses the target value that an objective must exceed as the K value. ROA approach is to verify if a project’s revenue can exceed its cost, however most of the e-learning objectives cannot be valued as revenue and cost. This study supposes that if an objective can exceed its target value (desired satisfactory degree) then this objective is successful. Thus, the K value in the proposed framework represents the objective target value. (3) S value: ROA approach uses the present value of future cash flows from the asset (project) as the S value. Because the “value” is measured by “satisfactory”, the S value in this proposed framework is the current satisfactory value (index value). In another words, ROA is used to estimate if the project’s cash flow (S). 36.
(44) exceeds its cost (K) while this study uses option price to evaluate if the objective’s satisfactory degree (S) exceeds the organization’s target (K). (4) T value: ROA treats the T value as length of time option is viable. This study uses the project’s dead line as its T value. The dead line can be a checkpoint between different developing phases or just the annual checkpoint of a persistent elearning project. (5) σ value: This study sets the σ value as the volatility (or standard deviation) of the objective’s satisfactory score. The evaluation process must be performed periodically to keep the σ value unbiased. (6) r value: This study treats the r value as the anticipated annual growth rate of the specific objective. Generally, the r value must be set to zero to keep a neutral opinion. However, the r can be set as a negative value to indicate the anticipated decrease of a certain objective. For example, the satisfactory degree of a computer class room will decrease because there are always newer and faster computers emerged every month. (7) C and P value: Traditionally, the call value C in an ROA analysis represents the projects expected revenue and the put value P represents the projects expected loss. This study measure each objective with its satisfactory degree, thus the call value C indicate the expected value that an objective exceeds its target and the put value P represents the expected value that an objective fails to exceed its target.. 37.
(45) 4.3.2. Designing a BSC sheet and applying the Black & Scholes model In order to apply the B & S model associated with the BSC for evaluating the elearning performance, the BSC index must be properly designed so that it can provide meaningful analytical information and satisfy the B & S assumptions. In order to provide a better analytical procedure, this study proposes a BSC analyzing sheet structure listed in Table 7. Table 7 The BSC analyzing sheet Objective. Expected. Score. Growth Rate. (X). (rΓ). Volatility Previous Current Target Objective Objective Fail Success Measure Measure Value. (σΓ). (PΓ). (SΓ). (KΓ). Weight. Index. (WΓ). (GΓ). Index Value. (ZΓ). (VΓ). Reaction (Customer, ex. students, trainees) Perspective weight: PWC Perspective Index: PIC. Perspective Fail Index: PZC. Perspective Success Value: PVC. C1. rC1. σC1. PC1. SC1. KC1. WC1. GC1. ZC1. VC1. …. …. …. …. …. …. …. …. …. …. Cn1. rCn1. σCn1. PCn1. SCn1. KCn1. WCn1. GCn1. ZCn1. VCn1. ZL1. VL1. Learning and Growth (Learning and Growth) Perspective weight: PWL Perspective Index: PIL L1. Perspective Fail Index: PZL. rL1. σL1. PL1. Perspective Success Value: PVL. SL1. KL1. WL1. GL1. …. …. …. …. …. …. …. …. …. …. Ln2. rLn2. σLn2. PLn2. SLn2. KLn2. WLn2. GLn2. ZLn2. VLn2. Behavior (Internal Business Processes) Perspective weight: PWI Perspective Index: PII. Perspective Fail Index: PZI. Perspective Success Value: PVI. I1.. rI1. σI1. PI1. SI1. KI1. WI1. GI1. ZI1. VI1. …. …. …. …. …. …. …. …. …. …. In3. rIn3. σIn3. PIn3. SIn3. KIn3. WIn3. GIn3. ZIn3. VIn3. Value (Finance, Results) Perspective weight: PWF Perspective Index: PIF. Perspective Fail Index: PZF. Perspective Success Value: PVF. F1. rF1. σF1. PF1. SF1. KF1. WF1. GF1. ZF1. VF1. …. …. …. …. …. …. …. …. …. …. Fn4. rFn4. σFn4. PFn4. SFn4. KFn4. WFn4. GFn4. ZFn4. VFn4. 38.
(46) The proposed BSC analyzing sheet contains four perspectives, and each perspective consists of several objectives. The individual objective is measured periodically to estimate its score of satisfactory. The scores are then transferred into a measure to indicate its relative current value as the objective’s satisfactory index. The standard deviation of a certain objective measure is called volatility. An analyst can assign the expected growth rate of each perspective by forecasting or simply by setting the expected growth rate to zero to indicate his neutral perspective. Each measure of a certain objective has its target value to be achieved after T years indicating the feasible performance (satisfactory degree) requirement. Different weighting values for different BSC objectives are assigned to indicate the importance of each objective while keeping the sum of all weighting values equal to 1. If we add or remove any objective we must readjust the sum of the existing weighting values to 1. This rule assures that the BSC index follows the B & S assumption that the underlying asset does not pay any dividend and makes no distributions. n1. ∑W. Ci. i =1. n2. n3. n4. i =1. i =1. i =1. = ∑ WLi = ∑ WIi = ∑ WFi = 1. and PWc + PWL + PWI + PWF = 1. Each objective is measured in relative value compared to the last measuring point. For example, the proper measurement will be “I am more satisfied with our e-learning system compared to last month: score 0 to 4” rather than “I am satisfied with our elearning system: score 0 to 4”. This measuring method allows an index to vary from 0. 39.
(47) to infinity like stock indexes. If the index value is fixed in a certain range, then that index will not follow a lognormal distribution returns. The B & S model is applied to obtain the expected value that an index exceeds its predefined target value under uncertainties as indicated in Figure 6.. Figure 3. Each index. Call Value = Expected value that index exceeds the target value (calculated by B&S Model). Target value Initial value. t1 t2 t3. Time. tn. Dead line. Figure 6 The call value obtained by B & S model represents the expected value of an index exceeds its target value.. The BSC index calculation steps are as follows: Step 1. Planning: An organization must first identify its e-learning environment. development goal and then identify the major perspectives to achieve the goal. Note that the perspective does not be limited to use the original BSC perspectives. The organization must carefully define its own perspectives according to the project’s needs. 40.
(48) Then, the organization has to determine the objectives and goals for each perspective in the BSC sheet and identify the investigating method (data collecting or questionnaire investigation) of each objective and configure the weighting factors for indicating the importance of each perspective {PWC, PWL, PWI, PWF } and objectives {WC1,..,WCn1}, {WL1,..,WLn2}, {WI1,..,WIn3}, {WF1,..,WFn4}. Based on the measurement method chosen by the organization (as mentioned in step 2 and step 3), then individually set the target values for each objective {KC1,..,KCn1}, {KL1,..,KLn2}, {KI1,..,KIn3}, {KF1,..,KFn4} and the expected annual growth rate for each objective {rC1,..,rCn1}, {rL1,..,rLn2}, {rI1,..,rIn3}, {rF1,..,rFn4}. The growth rate can be greater (increase) or less (decrease) or equal (neutral) to zero.. •. Determine the goal of the e-learning project: An organization must first identify its e-learning project’s goal and perspectives and sketch the strategy maps in order to achieve the goal. This study suggests the use (but not limited) of four perspectives as Reaction, Learning, Behavior and Value. According to the strategy map, the organization can thus identify the objectives that each perspective must achieve (or be evaluated).. •. Determine the perspective weights: The perspective weights can be first determined by the consumed resource (or cost) of each perspective before the deadline. For a small organization, the analyst can simply apply the budget value relate to each perspective and then adjust the weights according to the organization’s needs to perform fast analysis. For a larger organization, the analyst or the decision maker can use the percentage of each perspective’s total cost of 41.
(49) ownership (TCO) as the initial perspective weight then adjust the weights according to the organization’s goals. For example, if the organization’s e-learning project goal is to increase its reputations, the analyst can then increase the Value perspective weights. Note that the perspective weights can also be determined by the organization’s goal and missions to the e-learning project because of the nature of “none-profit” characteristics of the specific project.. •. Determine the objective weights: The analyst can initially determine the weight of each objective by its percentage of consumed resource (budget or TCO) to the perspective. Then, the analyst can individually adjust each objective’s weight according to the organization’s needs. If the TCO of each objective is difficult to be measured, the analyst can also give equal weighting value to each objective and then make minor adjustments. The objective weights can also be subjectively determined by the organization when identifying the individual objectives according to the organization’s needs and goals. In this case, the objective weights are initially equal weighted and then be individually increased or decreased by the decision makers.. •. Determine the expected annual growth rate: It is better to apply neutral perspective to the growth rate terms except the objective score can be properly forecasted. For example, if the organization plans to increase 10% employees in one year then the anticipated growth rate of e-learning users is 10%, then the growth rate can be set to 10% in order to reflect the forecasted values.. 42.
(50) Step 2. Obtain objective scores: Issues questionnaires to e-learning users and IT staff. members to collect intangible objectives information. In this study, the score is ranked as 0 (strongly disagree), 1 (disagree), 2 (neutral), 3 (agree) and 4 (strongly agree) to indicate the performance variation from the last checkpoint. Note that this study uses the term “agree” instead of “satisfied” in the questionnaires. All questions must be designed so that the higher score indicates the higher performance. Then, collect data to evaluate the tangible (quantitative able) objectives. All quantitative values are then compare to the last checkpoint and transform the performance into 0 to 4 scores for each objective so as to indicate the performance from strongly decreased (score = 0) to strongly increased (score = 4). The measurements of each objective must be properly designed that greater score indicates better performance to ensure all objectives are measured in the same guideline in order to avoid measurement conflictions. The questionnaires should be periodically issued to provide constant sampling rate in order to obtain unbiased volatilities.. Step 3. Calculate the current measures: In this study, the current measure is. calculated with the following formula: S Γ = PΓ (0.95 + X × 0.025). (4.1). where Γ ∈ {C1 ,..Cn1 , L1 ,..Ln 2 , I 1 ,.. I n 3 , F1 ,..Fn 4 } and X ∈ {C1,..Cn1,L1,..Ln2,I1,..In3,F1,..Fn4}. 43.
數據

+7

![Figure 4 Balance Scorecard: from management viewpoint (Source: Niven;2002 [48])](https://thumb-ap.123doks.com/thumbv2/9libinfo/8501976.185314/31.892.176.543.466.766/figure-balance-scorecard-management-viewpoint-source-niven.webp)
相關文件
Machine language ( = instruction set) can be viewed as a programmer- oriented abstraction of the hardware platform. The hardware platform can be viewed as a physical means
Machine language ( = instruction set) can be viewed as a programmer- oriented abstraction of the hardware platform. The hardware platform can be viewed as a physical means
• Use the Black-Scholes formula with the stock price reduced by the PV of the dividends.. • This essentially decomposes the stock price into a riskless one paying known dividends and
In the second quarter of 2003, the average number of completed units in each building was 11, which was lower than the average value for 2002 (15 units). a The index of
At the delivery month of a futures contract is approached, the futures price _________ the spot price of the underlying asset. Î When the delivery period is reached, the futures
• Implied volatility (IV) is the volatility input in a pricing model that, in conjunction with the other four inputs, returns the theoretical value of an option matching the
• A call gives its holder the right to buy a number of the underlying asset by paying a strike price.. • A put gives its holder the right to sell a number of the underlying asset
• A put gives its holder the right to sell a number of the underlying asset for the strike price.. • An embedded option has to be traded along with the
