40 JOURNAL OF DISPLAY TECHNOLOGY, VOL. 5, NO. 1, JANUARY 2009
Colorimetric Characterization of High Dynamic
Range Liquid Crystal Displays and Its Application
Yu-Kuo Cheng and Han-Ping D. Shieh, Fellow, IEEE
Abstract—A modified colorimetric model was proposed to characterize the high dynamic range liquid crystal display (HDR LCD). Backlight intensity was incorporated to account for the display chromatic properties. Images, exemplifying regular and random backlight intensity distributions, were designed to eval-uate the model. The results showed that chromaticity of three primaries was instable, and thus the device-dependent color transformation was inadequate in the HDR LCD. Moreover, the proposed model, in comparison with the model dedicated for the conventional LCD, was in average of less CIEDE2000 color difference values. Therefore, the proposed model was applicable for colorimetric color reproduction in the HDR LCD.
Index Terms—Colorimetric characterization, colorimetric color reproduction, device-dependent color transformation, high-dynamic-range LCD.
I. INTRODUCTION
C
OLORIMETRIC characterization of an imaging device is the base of device- independent color transformation across different imaging media [1]. The cathode-ray-tube (CRT) monitor [2], [3], the liquid-crystal display (LCD) [4], [5], and the DLP®projectors [6] cannot function well without thecor-responding color models or color management methods. The high dynamic range (HDR) LCD [7], therefore, requires its own model [8]. Some prior methods to model the LCD were first re-viewed, and then a modified characterization model for the HDR LCD was proposed.
Device-dependent color transformation, which is based on digital counts of images is, in general, not suitable for colori-metric reproduction. But, it is being widely applied to image processing of the high dynamic range liquid crystal display (HDR LCD), where luminance is always the merit function [9]–[11]. In this paper, we discuss the factors affecting the performance of applying device-dependent color calculation to color reproduction in the HDR LCD, and present some applications of the proposed model in the signal processing of the HDR LCD.
A. Conventional LCD
If an LCD possesses channel scalability and independence, the model, first used by Fairchild and Wyble [4] as expressed
Manuscript received January 29, 2008; revised April 08, 2008. and . Current version published January 09, 2009. This work was supported in part by the National Science Council (NSC), Taiwan, under the Graduate Students Study Abroad Program.
The authors are with the College of Electrical and Computer Engineering, Na-tional Chiao Tung University (NCTU), Hsinchu 300, Taiwan (e-mail: ykcheng. [email protected]).
Color versions of one or more of the figures in this paper are available online at http://ieeexplore.ieee.org.
Digital Object Identifier 10.1109/JDT.2008.2001864
in (1) and (2), can achieve acceptable accuracy of predicting device-independent colors. The first stage of the model is to build up three one-dimensional look-up tables (LUTs) of the radio-metric scalars, accounting for the non-linear opto-elec-tronic transfer function (OETF) of LC cells as a function of input digit counts of each channel. Those radio-metric scalars, de-noted by , , and in (1), range from zero to unity, where , , and are input digit counts of each primary, respectively. The second stage represents the linear conversion, as shown in (2), between radio-metric scalars and the resultant tri-stimulus values. The tri-stimulus values of “flare” term, , ac-counts for the nonzero radiance at black level [2], [3]. Flare term should be treated carefully in modeling an LCD because it is mainly responsible for the instable primaries [5].
(1)
(2) If channel scalability and independence, on the contrary, are not met, more complex models should be considered [12]–[14]. An effective methodology has been proposed by Day et al. [5] to statistically improve the model performance, in spite of the aforementioned issues and the measurement uncertainty of equipment as well. In summary, this methodology is based on (1) and (2), and, then, performs nonlinear optimization to min-imize the mean CIEDE2000 color difference, calculated by the CIE 2000 color difference formula, of test colors sampling the display’s gamut. Three 1-D LUTs in (1) and all the tri-stimulus parameters in (2) are dynamically adjusted in every iterative process.
B. HDR LCD
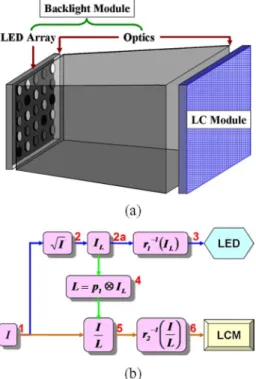
After the HDR LCD is proposed, the luminance range of an LCD system extends remarkably [7]. This enhancement is achieved by replacing the traditional full-on, constant backlight with the area-adaptive one, as shown in Fig. 1(a). Radiant energy emanating from the backlight surface can vary spatially, which is regarded as a low spatial resolution image, and then be modu-lated by the front LC panel to form an image with clear details. The dimmed areas of backlighting can preserve dark area of
Fig. 1. (a) An HDR LCD is mainly composed of an LC module, a backlight module, and optical structures affecting light spreading function of the light sources. (b) Flowchart to deduce the LED and the LC driving signals ([7]).
image content ultra dark compared with the traditional LCDs. High contrast ratio is, therefore, achieved even if the maximum luminance is not increased.
The algorithm to derive LED and LC driving signals is illus-trated in the flowchart shown in Fig. 1(b) [7]. is the normal-ized intensity of each pixel and the square root of is to increase the normalized intensity value of each pixel. is the intensity value of each LED. Since the number of LED is less than that of LC pixels, step 2 to step 2a is treated as a down-sampling proce-dure. After inversely converting by LED response function , step 3, the driving signals, , of each LED are deduced. Step 4 is the convolution of and , the LSF of single LED, to obtain the normalized backlight intensity, . The outcome of the target value divided by the convolution result, step 5, denotes
Fig. 2. Procedures of (a) the conventional LCD and (b) the HDR LCD map the input digit counts to tri-stimulus values.
the transmittance of each LC pixel. Accordingly, the driving sig-nals of each LC pixel are obtained after inversely transforming the transmittance by the LC response function , as by step 6.
The deduction of LC compensated signals, as shown at step 6, requires more considerations on the system colorimetric proper-ties. While the conventional LCD has one-to-one mapping rela-tion between the input digit counts and the colorimetric tri-stim-ulus values, the mapping relation in the HDR LCD is observed not unique. Our hypothesis is that the flare terms in (2) are no longer constant, neither the other matrix parameters. Thus, the normalized backlight intensity is suggested to be incorporated into (1) and (2) that are then modified into (3) and (4) accord-ingly (see (3) and (4) at the bottom of the page). Meanwhile, LED signals and corresponding LC driving signals, , , and , are deduced through the moderate algorithm, described in Section IV, for colorimetric reproduction in the HDR LCD. If white LEDs are implemented as light sources, (4) can be further simplified in the form of (5), shown at the bottom of the page.
For comparison, mapping between the input digit counts and the tri-stimulus values of both the conventional LCD and the HDR LCD are depicted in Fig. 2. Mapping in the conventional
(3) (4)
42 JOURNAL OF DISPLAY TECHNOLOGY, VOL. 5, NO. 1, JANUARY 2009
LCD, as shown in Fig. 2(a), follows the generic approach con-cluded by Berns [15], while that in the HDR LCD requires ad-ditional information of backlight intensity and compensated LC signals, as shown in Fig. 2(b). If both types of LCD imple-ment the same LC module, the LUTs are identical because the transmittance of the LC cells is independent of the backlight intensity.
II. EXPERIMENT
The chromaticity property of an HDR LCD was different from that of the conventional LCD, and was to be explored first. The difference would be explored by examining the primary stability under different illumination distributions of backlight. Then, the accuracy of the proposed model, expressed by (3) and (5), was evaluated by color difference between the predicted and the measured colorimetric values. The accuracy of the conven-tional model, expressed by (1) and (2), was computed as well, so as to verify the necessity of applying the proposed model to the HDR LCD. The measurement was made by means of SR-UL1R [16], under the setup of 2 measuring angle, at which working luminance range is 0.005–3000 cd/m .
A. Testing Platform
An LED-based HDR LCD system was constructed as the testing platform. 8-by-8 groups of three-in-one white LED were implemented as light sources in the backlight module for the LCD of resolution 1920-by-1080 pixels. The maximum lu-minance was about 507 cd/m , and the minimum could be of less than 0.05 cd/m . The contrast ratio, thus, was of greater than 10,000:1.
B. Preliminary Measurement
The three one-dimensional look-up tables (LUTs) were important in both the conventional and the HDR LCDs. In our assumption, LUTs only characterized the OETF of the LC cells, but were not associated with the backlight intensity. Therefore, the LUTs could be created following the same procedures as that in the conventional LCD. First, all the LEDs in the backlight were turned full-on, like the case of the conventional LCD. Second, digit counts of eleven equal steps, from 0 to 255 for eight-bit signal depth, were the input signals for each pri-mary, respectively. Finally, optimization of least-square-error of colorimetric difference was performed iteratively to obtain the LUTs in (1) and the parameters in (2). In addition, the channel scalability and independence were verified when the HDR platform was treated as a traditional LCD.
C. Testing Images
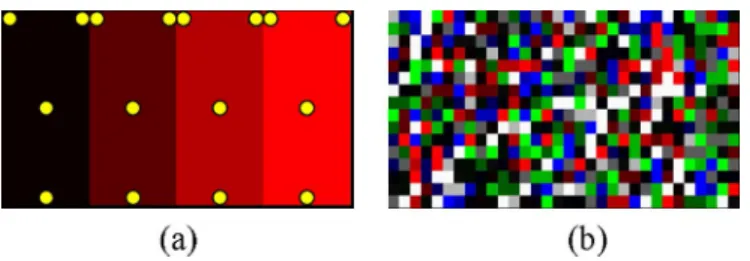
The color-ramp and random mosaic images, as shown in Fig. 3, were designed to evaluate the proposed model and the influence of backlight intensity distribution as well. The backlight intensity distribution of the color-ramp images varied roughly along with the ramp digit counts, while that of the random mosaic image varied with the global characteristics over an LSF area. The resultant tri-stimulus values of a set of digit counts were expected to be different if the incident backlight intensity differed.
The red-ramp image, as shown in Fig. 3(a) for example, was set the digit count of the named channel in the sequence of 10,
Fig. 3. (a) Red color-ramp, for example, consists of four patches with digit counts (10, 0, 0), (90, 0, 0), (180, 0, 0), and (250, 0, 0) from left to right. Yxy values are measured at the locations labeled by yellow filled circles. (b) The random mosaic image consists of 32-by-16 rectangular patches. All combina-tions of digit counts shown in the color-ramp images are included in the random mosaic image.
90, 180, and 250 from left to right patches, while the other two channels were set zero. Those digits were chosen because they covered the range from low to high luminance levels. Green and blue ramps are in the same fashion, except for inter-changing the primary channel. Four locations, labeled by filled yellow circle, of each patch were chosen to collect the colorimetric data. The random mosaic image consisted of 32-by-16 rectangular patches, as shown in Fig. 3(b), including all the sets of digit counts shown in the color-ramp images. Therefore, more than one color patches could be of the same set of digit counts and located at random position in the image. Twelve color patches, corresponding to each color ramp, were randomly chosen to measure the Yxy value, which was used to compute the color difference with the predicted colorimetric value of that patch. The results of one set of twelve selected color patches were de-picted in Figs. 4(b), 5(b), and 6(b), for instance. Some achro-matic (white, gray, and black) patches were added into the image in order to extend the variation of backlight intensity in the image.
III. RESULTS ANDDISCUSSION
The measured colorimetric data demonstrated that there were generally instable primaries in the HDR LCD. The primary chromaticity of the color-ramp images, as shown in Fig. 4(a), was well consistent; however, the primary chromaticity, mea-sured from the random mosaic image as shown in Fig. 4(b), changed toward the center along with decreasing gray level. This difference resulted from different percentage of the flare term, as expressed in (4) or (5), involved in the computation of chromaticity. The resultant chromaticity of the primaries tended to move to the central white point if the percentage of the flare term became larger. Furthermore, the percentage of the flare term could be qualitatively illustrated by the varia-tion correspondence between the image digit counts and the incidence backlight intensity. For example, since the backlight module was divided into 8-by-8 regions, one color ramp in the ramp images was mainly illuminated by 8-by-2 LSFs, as shown in Figs. 3(a) and 5(a). The ramp images were regarded to be of higher variation correspondence than that of the mosaic image, where 4-by-2 color patches might be included in an LSF area, resulting in more digit count variation, as shown in Figs. 3(b) and 5(b). This phenomenon drew an important conclusion that the HDR LCD had one-to-many colorimetric mapping, so device-dependent color transformation was inadequate to be applied to the HDR LCD.
Fig. 4. Chromaticity of the primaries with digit counts 10, 90, 180, and 250 of the named channel is plotted in CIE 1931 xy diagram. (a) Color-ramp and (b) random mosaic images.
Fig. 5. Backlight intensity distributions of (a) the color-ramp and (b) the random mosaic images, respectively. The brighter backlight area represented the higher luminance.
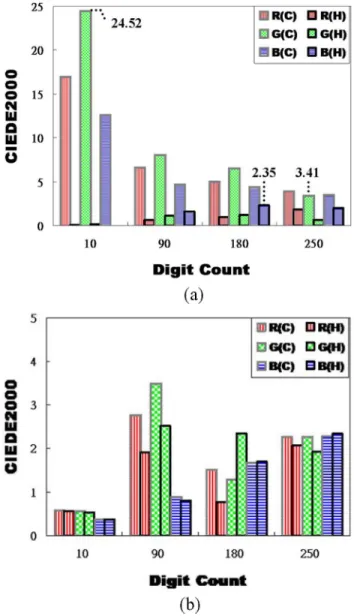
Backlight intensity distribution had significant influence on the colorimetric color reproduction in the HDR LCD as well. Two different sets of backlight intensity values, one by the con-volution computation [8], [9] and the other by direct measure-ment, were applied to calculate the CIEDE2000 color differ-ences for evaluation. The results of applying the estimated and the measured backlight intensity were shown in Figs. 6 and 7, respectively.
For the color-ramp image, the average CIEDE2000 values calculated from the conventional model were well-above 3.41 and even up to 24.52 at the patch (0, 10, 0), as shown in Fig. 6(a), while those from the proposed model were well-below 2.35. Large color differences occurred at patches with digit count 10, because large luminance errors were introduced by the conven-tional model by means of (2), where the matrices parameters were constant and incapable of reflecting backlight intensity variation. As for the random mosaic image, the difference of the CIEDE2000 values between the two models became unnotice-able statistically, as shown in Fig. 6(b). This result might be due to the fact that the backlight intensity distribution of the random mosaic image got closer to that of the full-on backlighting, to which the conventional model was applied.
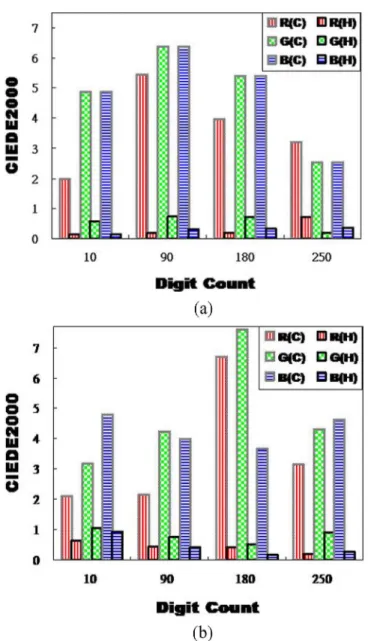
In comparison, reduced color differences were obtained when the measured backlight intensity was used in the com-putation. The CIEDE2000 values, arising from the proposed model, were all less than or around 1, as shown in Fig. 7, for both the color-ramp images and the random-mosaic image. However, the CIEDE2000 values, resulting from the conven-tional model, were well-above 2, which was not applicable to color reproduction, although the reduction of CIEDE2000 values were observed in comparison with the results shown in Fig. 6. In summary, the proposed model was applicable to
Fig. 6. The CIEDE2000 color differences between the measured and the pre-dicted colorimetric values are plotted in (a) the color-ramp and (b) the random mosaic images, where (C) and (H) denote the models for the conventional and the HDR LCDs, respectively. Backlight intensity was estimated by convolution computation.
the HDR LCD; besides, the backlight intensity remained an challenging issue of the HDR display engineering [17]–[19].
44 JOURNAL OF DISPLAY TECHNOLOGY, VOL. 5, NO. 1, JANUARY 2009
Fig. 7. The CIEDE2000 color differences between the measured and the pre-dicted colorimetric values are plotted in (a) the color-ramp and (b) the random mosaic images, where (C) and (H) denote the models for the conventional and the HDR LCDs, respectively. Backlight intensity was measured directly at the measuring point.
Fig. 8. Flowchart of applying the proposed model to derive driving signals for the HDR LCD.
IV. MODELAPPLICATION
The proposed model is useful to achieve accurate color re-production in the HDR LCD. If certain specific goal of opti-mization, like least CIEDE2000 values, is desired, optimiza-tion step can be incorporated into the procedures, as shown in Fig. 8. After processing the input signal, by the
algorithm, the resultant and are regarded as the initial trial for the following iterative steps. and are then input into (3) and (5) to predict tri-stimulus values,
. The CIEDE2000 value is calculated and compared with a desired threshold. Optimization technique is then applied to update and if the CIEDE2000 values exceeding the threshold, and run the aforementioned steps iteratively until CIEDE2000 values meet the requirement. Once color difference is minimized, optimized is used to deduce LED driving signal, . Thus, the colorimetric reproduction with least color dif-ference can be achieved in the HDR LCD.
V. CONCLUSION
Backlight dimming not only extends the contrast ratio, but increases the complexity of chromatic properties of the HDR LCD. The measured results show that area-adaptive back-lighting results in one-to-many chromatic mapping, rather than one-to-one mapping relation in the case of full-on backlighting. Therefore, a suitable chromatic model is required to substitute device-dependent color transformation for colorimetric color reproduction in the HDR LCD. The proposed model, taking account of backlight intensity, is demonstrated to be more applicable than the conventional model for chromatic charac-terization of the HDR LCD.
Current results reveal that the improvement of reducing color difference is significant; however, the model performance can be further enhanced if the estimation of backlight intensity can be improved. Applying nonlinear optimization technique is an-other solution to enhance color reproduction accuracy. In addi-tion, this model can be modulated accordingly to well charac-terize the HDR LCD with multi-primary LEDs as the backlight sources.
ACKNOWLEDGMENT
The authors would like to thank Prof. R. S. Berns, Rochester Institute of Technology (RIT), Rochester, NY, for sharing his valuable experience on color modeling, and to L.-Y. Liao and Z.-W. Chen from National Chiao Tung University, Hsinchu, Taiwan, for their measurement assistance.
REFERENCES
[1] R. G. W. Hunt, The Reproduction of Colour, 6th ed. Osceola, WI: Voyageur Press (MN), 2004.
[2] N. Katoh, T. Deguchi, and R. S. Berns, “An accurate characteriza-tion of CRT monitor (I) verificacharacteriza-tion of past studies and clarificacharacteriza-tions of gamma,” Opt. Rev., vol. 8, pp. 305–314, 2001.
[3] N. Katoh, T. Deguchi, and R. S. Berns, “An accurate characterization of CRT monitor (II) proposal for an extension to CIE method and its verification,” Opt Rev., vol. 8, pp. 397–408, 2001.
[4] M. D. Fairchild and D. R. Wyble , Color characterization of the Apple Studio Display (Flat Panel LCD) Munsell Color Science Lab., Tech. Rep., 1998 [Online]. Available: http://www.cis.rit.edu/mcsl/research/ PDFs/LCD.pdf
[5] E. A. Day, L. Taplin, and R. S. Berns, “Colorimetric characterization of a computer-controlled liquid crystal display,” Color Res. Appl., vol. 29, no. 5, pp. 365–373, 2004.
[6] D. R. Wyble and M. R. Rosen, “Color management of DLP projectors,” in 12th Color Imaging Conf., 2004, vol. 12, pp. 228–232.
[7] H. Seetzen, L. Whitehead, and G. Ward, “A high dynamic range display using low and high resolution modulators,” in SID Symp. Dig. Tech.
Papers, 2003, vol. 34, pp. 1450–1453.
[8] Y. K. Cheng and H. P. D. Shieh, “Colorimetric characterization of high-dynamic- range LCDs,” in SID Symp. Digest Tech Papers, 2008, vol. 39, pp. 1332–1335.
[9] H. Seetzen, W. Heidrich, W. Stuerzlinger, G. Ward, L. Whitehead, M. Trentacoste, A. Ghosh, and A. Vorozcovs, “High dynamic range dis-play system,” in ACM TOG SIGGRAPH, 2004, vol. 23, pp. 760–768. [10] F. Li, X. Feng, I. Sezan, and S. Daly, “Deriving led driving signal for
area- adaptive led backlight in high dynamic range LCD displays,” in
SID Symp. Dig. Tech. Papers, 2007, vol. 38, pp. 1794–1797.
[11] F. C. Lin, C. Y. Liao, L. Y. Liao, Y. P. Huang, H. P. D. Shieh, P. J. Tsai, T. M. Wang, and Y. J. Hsieh, “Inverse of mapping function (IMF) method for image quality enhancement of high dynamic range LCD tvs,” in SID Symp. Dig. Tech. Papers, 2007, vol. 38, pp. 1343–1346. [12] G. Marcu and K. Cheng, “Gray tracking correction for TFT-LCDs,”
in Proc. IS&T/SID 10th Color Imaging Conf., Springfield, VA, pp. 272–276.
[13] Y. Yoshida and Y. Yamamoto, “Color calibration of LCDs,” in Proc.
IS&T/SID 10th Color Imaging Conf., Springfield, VA, 2002, pp.
305–311.
[14] N. Tamura, N. Tsumura, and Y. Miyake, “Masking model for accurate colorimetric characterization of LCD,” in Proc. IS&T/SID 10th Color
Imag. Conf., Springfield, VA, 2002, pp. 312–316.
[15] R. S. Berns, “A generic approach to color modeling,” Color Res. Appl., vol. 22, pp. 318–325, 1997.
[16] Topcon Technohouse Corp., Spectroradiometer SR-UL1R (2008) [On-line]. Available: http://www.topcon-techco.jp/eng/products/110383. html, Retrieved 2008
[17] Y. W. Wan, Y. K. Cheng, H. P. D. Shieh, T. M. Wang, and R. H. Lin, “Analyses of point spread function in high dynamic range display system,” presented at the Optics and Photonics Taiwan 2005. [18] Y. H. Lu, Y. K. Cheng, and C. H. Tien, “A localized pattern approach
for high-dynamic-range display,” in SID Symp. Dig.. Tech. Papers, 2007, vol. 38, pp. 449–452.
[19] Y. K. Cheng, Y. H. Lu, P. I. Lu, C. H. Tien, and H. P. D. Shieh, “Super-Gaussian light spread function for high dynamic range displays,” in SID
Symp. Dig. Tech. Papers, 2008, vol. 39, pp. 983–985.
Yu-Kuo Cheng received the B.S. degree in electrophysics from National Chiao Tung University, Taiwan, in 1997. Since 2003, he has been working toward the Ph.D. degree at Institute of Electro-Optical Engineering, National Chiao Tung University.
In 2001 and 2002, he was an electronic engineer responsible for projector system design in BenQ Corporation, Taiwan, R.O.C. In 2006, he was granted for a year as a visiting researcher in Munsell Color Science Laboratory, Rochester, NY. His current research is in color engineering, and color vision-based system design of field sequential color (FSC) LCDs and high dynamic range (HDR) LCDs.
Han-Ping D. Shieh (S’79–M’86–SM’91–F’08) received the B.S. degree from National Taiwan University in 1975 and Ph.D. degree in electrical and computer engineering from Carnegie Mellon University, Pittsburgh, PA, in 1987.
He joined National Chiao Tung University (NCTU), Hsinchu, Taiwan, as a professor at Institute of Opto-Electronic Engineering and Microelectronics and Information Research Center (MIRC) in 1992. Prior to this position, since 1988, he was a Research Staff Member at IBM T. J. Watson Research Center, York-town Heights, NY. He has been an Associate Director, MIRC, National Chiao Tung University.(NCTU), Hsinchu, Taiwan. He founded and served as the Di-rector, Display Institute at NCTU in 2003, the first such kind of graduate aca-demic institute in the world dedicated for display education and research. He also holds a joint-appointment as a Research Fellow at Center for Applied Sci-ences and Engineering, Academia Sinica since 1999. He was appointed as a co-PI of “Display Science and Technology Large-Scale Project” in 2004, a na-tional project to drive Taiwan display into new era. He is currently the Dean, College of Electrical and Computer Engineering, NCTU, and also a Chair Pro-fessor with AU Optronics
Dr. Shieh is a fellow of the Optical Society of America (OSA) and Society for Information Display (SID).