Original Article
Elderly Nutrition and Health Survey in Taiwan
(1999–2000): research design, methodology and content
Wen-Harn Pan PhD,
1,2Yung-Tai Hung PhD,
3Ning-Sing Shaw
PhD,2Wei Lin PhD,
4Shyh-Dye Lee
MD, MPH,5 Cheng-Fen Chiu PhD,6Meng-Chiao Lin MS, MPH,
7 Ssu-Yuan ChenMD, PhD,8Chi-Min Hong MS,
9Teng-Yuan Huang PhD,
10Hsing-Yi Chang DrPH,
11Su-hao Tu
PhD,12Ya-Hui Chang
MS,12 Wen-Ting Yeh MS1 and Shu-Chen SuBS121Institute of Biomedical Sciences, Academia Sinica, Taipei, Taiwan; 2Institute of Microbiology and Biochemistry,
National Taiwan University; 3Department of Political Science, National Taiwan University;4Department of
Human Development and Family Studies, National Taiwan Normal University;5Graduate Institute of Long-Term
Care, National Taipei College of Nursing; National Taiwan University Hospital, Bei-Hu Branch; 6Department of
Medical Technology, Fooyin University;7Bureau of Disease Control, Department of Health, Kaohsiung City
Council;8Department of Physical Medicine and Rehabilitation, National Taiwan University Hospital and National
Taiwan University College of Medicine, Taipei, Taiwan; 9Bureau of Food Hygiene, Department of Health,
Executive Yuan; 10Graduate Institute of Applied Statistics, Fu Jen Catholic University; 11Division of Health Policy
Research, National Health Research Institutes; 12Center for Survey Research, Research Center for Humanities
and Social Sciences, Academia Sinica
The purpose of the Elderly Nutrition and Health Survey in Taiwan (1999-2000) was to assess the diet, nutrition and health of persons aged 65 and above in Taiwan. A multi-staged, stratified, clustered probability sampling scheme was used in the survey. The survey population was stratified into a total of 13 strata. The four strata of “Hakka areas”, “Mountain areas”, “Eastern areas”, and “PengHu islands” were unique in their ethnicity or geographic locations. The remaining areas of Taiwan were stratified into “Northern”, “Central”, and “Southern” parts. Within these 3 strata, then each was subdivided into a further 3 strata based on population density. The household interview of the survey was arranged such that effect of seasonal variation was taken into account. A total of 1,937 persons completed the interview and 2,432 persons completed the health exam. The following data were collected: (1) Interview data : household information, basic demographics, 24 hour dietary recall, food frequency and habit, knowledge, attitudes and practice medical history, 36-item Short Form for generic health status, and physical activity. (2) Health exam data: blood sample for measurement of nutritional biochemical indicators and complete clinical chemistry profile, urine sample for urinary electrolytes, anthropometric measurements, ECG, blood pressure, body temperature, pulmonary function, and an osteoporosis assessment. Data from the survey were analyzed using SUDAAN to adjust for the design effect and to obtain unbiased estimates of the mean, standard error and confidence intervals. Survey respondents were slightly younger compared to non-respondents; however, after weighting and adjustment with SUDAAN, the education levels and ethnicity of respondents and non-respondents were similar indicating lack of bias. We anticipate that the results of this survey will be of benefit in understanding the nutritional status of the elderly, the relationship between nutrition and health, and factors influencing elderly persons’ nutritional status. Furthermore, this information could be used in the development of public health nutrition policy aimed at improving the nutrition and health of the elderly in Taiwan.
Key words: elderly, survey, nutrition, diet, health, design, weighting, knowledge, attitudes, practice, Taiwan, Elderly Nutrition and Health Survey in Taiwan (1999-2000)
Introduction
As our society continues to age and the relative proportion of elderly people increases,1 heightened attention is being placed
on the need for healthcare and disease prevention in the elderly population. The majority of current health surveys of the elderly are aimed at investigating chronic diseases and their associated risk factors. Long term diet and nutritional status are closely related to some chronic diseases, and only recently, more and more nutrition surveys focused on nutrition related issues in elderly persons.2-11 The purposes of the
Elderly Nutrition and Health Survey in Taiwan
(1999-2000) commissioned by the Department of Health, were
several-fold: (1) to assess the status of diet, nutrition and health of persons aged 65 and over in Taiwan; (2) to
investigate dietary and non-dietary factors influencing the dietary patterns and nutritional status of the elderly persons; and (3) to understand the knowledge, attitudes and prac-tice related to nutrition; and (4) the effect of all of these on health.
Correspondence address: Wen-Harn Pan, Professor, Institute of
Biomedical Sciences, Academia Sinica, 128 Sec. 2, Academia Rd., Nankang, Taipei 11529, Taiwan.
Tel: 886-2-2789-9121; Fax: 886-2-2782-3047 E-mail: pan@ibms.sinica.edu.tw
WH Pan et al. 204
Subjects and methods
Sampling design
We used a stratified, clustered, multi-staged, probability sampling design in this study. Probabilities were deter-mined based on the age-gender and residence stratum of eligible subjects. Eligible subjects included all Taiwanese nationals aged 65 and above on the 1st of January 1999 residing in Taiwan. Those residing in military institutions, hospitals, hospices, schools, training centers, dormitories or other institutions during the period of recruitment were not included.
Stratification and multistage processes
Taiwan was divided into a total of 13 strata for the purposes of the study. These strata were determined as follows: first-ly, city districts and townships in particular geographical locations and with a certain ethnic make-up were divided into four strata (“Hakka areas”, “Mountain areas”, “Eastern areas”, “PengHu islands”). The stratum “Hakka areas” consisted of the 46 Hakka city districts or townships defined
by Yang12 (not including those in eastern strata). The
stratum “Mountain areas” consisted of the 30 mountainous rural townships as designated by the Ministry of the Interior. The stratum “Eastern areas” consisted of the non-mountain city districts or townships in Taitung and Hualien counties of the east coast. The remaining areas of Taiwan were divided into “Northern”, “Central” and “Southern” strata. These three strata were then each subdivided further into three strata based on population density.13 Population
density cut-points were determined via cluster analysis. a) Northern (Hsinchu and further north): greater than 14,309 persons/km2, 14,309 persons/km2 to 3,044 persons/km2, less than 3,044 persons/km2.
b) Central: greater than 2,600 persons/km2, 2,600 persons/km2 to 875 persons/km2, less than 875 persons/ km2.
c) Southern (Chiayi and further south): greater than 10,702 persons/km2, 10,702 persons/km2 to 3,184 persons/km2, less than 3,184 persons/km2.
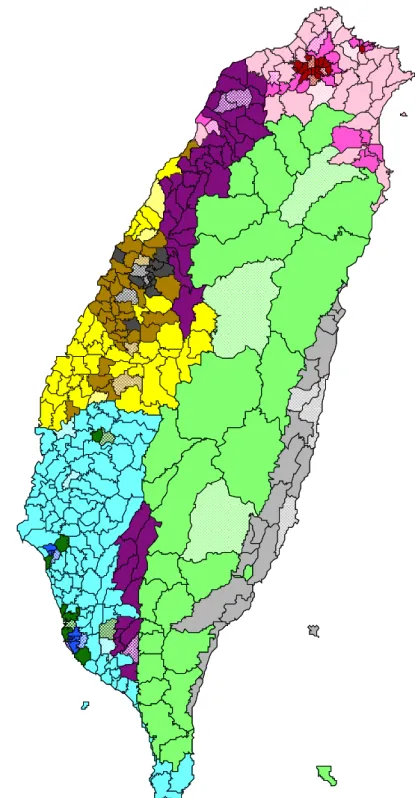
A total of 39 city districts or townships were chosen from the 13 strata using PPS (Probability Proportional to Size) sampling (Fig. 1). The same principle was applied to select 2 villages (street blocks) from each of the above townships (city districts) giving a final total of 78 villages (street blocks) throughout Taiwan. It was proposed to survey 26 elderly persons in each village (street blocks). This gave a total of 52 persons for each township or city district, 156 persons for each stratum and an overall total of 2,028 per-sons for the whole of Taiwan with equal numbers of men and women.
Sampling subjects in villages
Data from the 1998 Ministry of the Interior’s Household
Data Registry was used to draw the first household and to
provide household data for the houses and apartments around the first household. Commencing from the first household, interviewers constructed a list of elderly persons in neighboring households. As the response rate was predicted to be 56.5%, interviewers aimed to contact 46 per-sons (with equal numbers of men and women) in order to
reach the target of 26 participants. Interviews were ceased when this target of 26 persons or when the designated num-ber of days was reached. However, all 46 elderly persons on the list were invited to attend the health exam when the mobile exam team arrived. Therefore, response rates for household interview and health exam were calculated se-parately. This study used a “household” as the basic sam-pling unit. Those living at a particular street address were considered a household. Moreover, neighboring households were decided on the basis of closeness of actual geo-graphical location as opposed to the house number or neighboring household from the household registry. In addition, households in the one cluster within a village (or street blocks) needed to be in a single geographical locality and not separated by a body of water or major road. The definition of a household was a private residence and this did not include companies, factories, schools or dormitories. However, shared accommodation (such as houses with indi-vidually let rooms) could be included in the sample. Sample subjects consisted of all of those individuals aged 65 or over residing in the above households, including both registered and registered individuals and both relatives and non-relatives. Those individuals who were temporarily not resi-ding in the household (for example due to incarceration, hospitalization or travel for business or leisure) during the period of recruitment were not included in the sample.
Back-up villages
In order to avoid insufficient sample size due to the popu-lation of some of the chosen villages being too small, neigh-boring villages were selected as back-up villages in Datung township in Yilan, Jen’ai township in Nantou and Haiduan township in Taitung. Criteria for selection for these villages were: (1) The back-up villages had houses that were conti-guous with households surrounding the designated first household in the original village that could act as supple-mentary cases; (2) The aforementioned neighboring village was in the same geographical location as the original village and it was convenient for members of contiguous house-holds to be supplementary cases.
Control of seasonal effect
Seasonal variation can influence dietary consumption and nutritional status and as a result, the household interview was arranged to cover three different times in the year (Feb-ruary to May, June to September, and October to January). During each seasonal period, 16 to 18 cases (8-9 males and females each) were interviewed in each local area.
Survey methodology
The survey was carried out in two parts: the household interview and the mobile health exam. The household inter-view was carried out by local part-time interinter-viewers who systematically collected cases over an average 12 month period. The local public health department nutritionist was responsible for supervising the household interview. The health exam was performed by a professional team who travelled to each locality to perform the examinations. The main features of the project are described below.14,15
2nd stratum in the northern areas
3rd stratum in the northern areas 2nd stratum in the central areas3rd stratum in the central areas 2nd stratum in the southern areas3rd stratum in the southern areas Sampled townships/districts
Figure 1. Map of Taiwan, showing the 13 sampling strata (solid areas) and selected townships or city districts (reticulate areas)
WH Pan et al. 206
Data collection and measurement
a) Interview data: Household information, demographic information, 24 hour dietary recall (including family re-cipes, validity data for food models for individuals, and individual dietary recall); questionnaires about food fre-quency, dietary supplement use, eating habits, know-ledge, attitudes and practice in regards to nutrition, me-dical history, and transient ischemic attacks (TIA), physical activity, and 36-item Short-Form for generic health status (SF-36), Short Portable Mental Status Questionnaire (SPMSQ), ability to perform activities of daily living; and measurement of respiratory function. b) Health exam data and collection procedure: The exam -was carried out in the morning. Fasting blood test: A record was made of the medications taken by each subject the day before the blood test as well as the time of last food intake. The majority of subjects had an overnight fast for a minimum of 8 hours. Blood was collected and managed as described in Table 1. The fractionated sample was then clearly labeled, placed in the serum sample box, and stored in liquid nitrogen within a short space of time. Processed samples were sent to Taipei in the tank within 2 to 3 days of processing. The samples were then stored
in a freezer at -70oC at the Academia Sinica after which
they were sent on to the relevant laboratories for further analysis.
During the household interview, each participant was given a urine specimen jar containing boric acid. Parti-cipants were asked to collect all the urine they passed during one night after going to bed, before and at getting up the next day (including urine passed in the middle of the night). Participants were requested to bring the collected urine to the health exam. Staff then recorded whether the urine sample had been collected on the same day and if it was a whole night’s urine collection. The urine sample was then fractionated and frozen in liquid nitrogen before transport to Taipei where it was stored at -20oC at Academia Sinica.
Nutrition and clinical chemistry
Tests carried out on the blood and urine samples included full blood count (on site immediately after drawing); serum measurements of cholesterol, triglyceride, uric acid, SGOT, SGPT, HDL cholesterol, CRP, creatinine and vitamin B12; measurements of vitamin A, E and β-carotene, vitamin B6, folate, transferrin, ferritin and iron; assessment of vitamin B1 and B2 nutritional status by erythrocyte enzyme active-tion test; and urinary concen-trations of sodium, potassium, calcium, magnesium, iodine and creatinine to assess mineral intake.
ECG
ECGs were performed using the MAC 12/15 (Marquette Electronic, Inc., Milwaukee, USA), and the data was sent to the Minnesota ECG Coding Center in the US for inter-pretation.
Body measurements
Height, weight, waist circumference, hip circumference and skin-fold thickness were measured. Height and weight were measured using the German SECA 707 con-tinuous display electronic scales (and the SECA 220
height rod). Participants were asked to first remove their shoes and the weight of their clothes was estimated by categorizing them into appropriate cloth types. Waist cir-cumference was measured horizontally at the level of na-tural waist, which was identified as the level at the hollow molding of trunk when the trunk was concaved laterally. Hip circumference was measured horizontally at the level of the greater trochanters. Arm circumference was mea-sured midway between the acromion and the olecranon with the arm held parallel to trunk. Triceps and sub-scapular skinfold thickness were measured twice in mm to one decimal place by Lange skinfold calipers, and the averaged data used in the analysis. Triceps skinfold mea-surements were taken midway between the acromion and the olecranon on the marked mid-line of the posterior surface of the right upper arm. Subscapular skinfold thickness was measured at a marked point one centimeter below the tip of the right scapular, with the arm posi-tioned parallel to trunk. All measurements were required to have a degree of accuracy down to the smallest desig-nated unit of measurement. Records were made of any measurements conducted under difficult circumstances such as having to perform measurements on the left hand due to injury or trauma to the right hand, or having to measure height in persons with scoliosis.
Blood pressure
Blood pressure was measured using the Omega 1400 Non
Invasive Blood Pressure Monitor (Invivo Research Inc.,
Table 1. Blood drawing and management flow-chart
Tube 1: 10 ml whole blood with no anticoagulant →centrifuged at 4oC after 1 hr →(away from light)
→ serum 0.5ml→frozen→clinical chemitry → serum 0.5ml→frozen→fatty acids → serum 0.5ml→frozen→vitamin B12, folate → serum 0.5ml→frozen→reserve
→ serum 0.5ml→frozen→reserve
Tube 2: 2ml whole blood in EDTA.K2 (4oC)→ complete blood count → centrifuge right away at 4 oC
→ plasma → freeze → reserve Tube 3: 2ml whole blood in NaF→centrifuge right away →plasma→freeze→blood sugar
measurement
Tube 4: 10ml whole blood in Heparin→ centrifuge right away → (away from light)
→ RBC → → RBC 0.5ml→freeze→folate → RBC 0.5ml→freeze→vitamin B1 → RBC 0.5ml→freeze→vitamin B2 → RBC 0.5ml→freeze→reserve →plasma→ → plasma 0.5ml→freeze→iron
→ plasma 0.5ml→freeze→T4
→ plasma 0.5ml→freeze→vitamin A, vitamin E, β-carotene
→ plasma 0.5ml→freeze→vitamin B6 → plasma 0.5ml→freeze→reserve →buffy coat → freeze
Orlando, Florida, USA). Participants were requested to wear a loose top and try to relax before the measurement was taken. They were also requested not to take any drinks containing stimulants such as tea or coffee. Parti-cipants were asked to sit with their legs uncrossed for 5 minutes, then extended their right arm and placed it in the blood pressure cuff. For the blood pressure monitor used, the mark on the inflated cuff should be centered directly over the brachial artery. The cuff of the right size should be used and kept at the same height as the heart. The blood pressure monitor automatically measured the sub-ject’s systolic and diastolic blood pressure, average blood pressure and pulse rate. After 30 seconds, measurements were repeated until a total of three measurements were performed. If the second and third measurements differed by more than 10mmHg, a fourth measurement was per-formed. Ambient room temperature at the time of blood pressure measurement was noted as well as whether or not the participant has smoked prior to the procedure.
Body temperature
Body temperature was measured with an ear thermometer (SureTemp678 Electronic Thermometer, Welch Allyn, Inc., San Diego, CA, USA). The measurement range was 28.9 to 42.2°C with a degree of accuracy of ± 0.1°C.
Osteoporosis assessment
The Velocity of Sound (VOS) and Broadband ultrasound attenuation (BUA) of the heel were measured using machines from McCue CUBA Clinical, McCue Ultra-sonics, Hanson Medical Systems, Inc., Florida, USA. Organisational structure for the field survey and the fieldwork procedure
The coordination center run by the Survey Research Center, Academia Sinica was responsible for the entire planning of the survey, the training of interviewers and governmental nutritionists, assisting the local health de-partment nutritionist in their supervisory role, data ma-nagement, project implementation, quality assurance and progress management. The local government nutritionists were responsible for supervising and assisting the inter-viewers to carry out the local interviews and were also in charge of data entry (including household data, dietary re-call and questionnaire data), checking the data accuracy and data quality control. They communicated with the coordination center at designated intervals at which point any problems could be raised and interview progress and data collection status were reported. The part-time inter-viewers employed in each local area were responsible for confirming each case, carrying out interviews and assis-ting in communicaassis-ting with participants about the health exam.
The first step of the fieldwork was to generate a list of elderly persons to be interviewed. The interviewer exa-mined the local area housing data and the list of elderly persons provided by the village. Commencing from the first household, surrounding household data was collected and resident elderly persons were encouraged to give informed consent to the survey. About 16-18 household interviews were carried out in each area every season. Health exams were carried out separately by a mobile professional examination team that went to each area to
collect health exam data and bio-specimens. The Bureau of Food Hygiene, Department of Health was responsible for coordination within the public health system and su-pervision of the entire survey process.
Data entry and quality control
Interview data
Local health department nutritionists in each area were responsible for supervising survey procedure and quality. They entered and checked the data, and corrected any missing values or errors after discussion with the inter-viewer and cross-checking. Each locality sent a disc of the collected data to the coordination center at regular intervals, where it underwent double data entry and a logic check for data errors.
Health exam data
Both double data entry and computerized logic testing were carried out on the health exam data. For the nutri-tional and clinical biochemical tests, 5% of the blood and urine samples were repeated on split samples to help en-sure quality. Any low repeatability of tests on this sample would indicate potential low quality.
Data analysis
As the representativeness of each sample was not equi-valent in this complex schemed survey, weighting was re-quired during the statistical analysis in order to obtain a nation-wide representative statistical estimates. Weighting was carried out by the post-stratification method. Using the 13 geographical strata of the sample population, the sample was further divided into gender and the following age groups: 65-69, 70-74, 75-79 and 80 and above. This resulted in a total of 104 groups (4 age groups x 13 strata x 2 townships = 104). The sample size of each of these
groups was then expanded according to population dis-tribution indicated by the 1999 Taiwan Household Popu-lation Statistics.13 There were three sets of weighting in
this project: questionnaire data, health exam data, and questionnaire and health exam data.
The results describe the sample size, response rate, age, educational background and ethnicity of the respondents in relation to gender and geographical distribution. Re-sponse rate was calculated as follows: Household
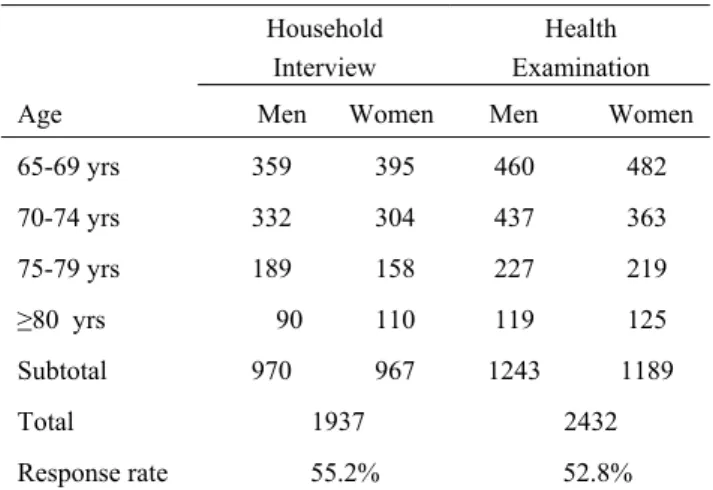
Table 2. Number of sampled subjects by age and by gender
participating the household interview or health examination Household
Interview
Health Examination Age Men Women Men Women 65-69 yrs 359 395 460 482 70-74 yrs 332 304 437 363 75-79 yrs 189 158 227 219 ≥80 yrs 90 110 119 125 Subtotal 970 967 1243 1189 Total 1937 2432 Response rate 55.2% 52.8%
WH Pan et al. 208
interview response rate = number responding to questionnaires/number of elderly residents aged 65 and over in the sampled households; Health exam response rate = Number of persons attending for health exam/ Number of elderly residents aged 65 and over who were eligible and notified about the health exam. Non-respondents were urged to provide information about their age, educational background and ethnicity. SUDAAN was used when comparing the ethnicity and educational back-ground of respondents and non-respondents. SUDAAN supports analysis of data from complex sample surveys, to adjust for the design effect and to obtain unbiased estimates of the mean, standard error and confidence intervals.
Results
Actual sample size and response rate
A total of 1,937 elderly persons (970 males and 967 females) completed the household interview, which was very close to the original design target of 2,028 persons due to the stop rule (Table 2). A total of 2,432 elderly persons (1,243 males and 1,189 females) completed the health exam part of the survey. The sample size is 1568 for those with both interview and exam data. The overall response rate for the household interview was 55.2% and that for the health exam was 52.8%. Response rate was in general higher in rural areas, and lower in high population density areas.
Descriptive statistics on age, birthplace and educational background
The age distribution of elderly persons differed across the various geographical locations (data not provided).
In general about 40% of those participating in the health exam or the interview were aged 65-69, close to 30% of participants were aged 70-74 and 20% were aged 75-79. Only 10% of elderly persons participating in the survey were aged 80 and above (Table 3 & 4).
About 51% of the male participants were ethnic Fu-kienese whose ancestor originated from Fukien Province, 31% were born in Mainland China, 9% were of Hakka whose ancestral origin was Canton and 10% were Abo-riginal (Data in this paragraph not shown). About 68% of female participants were ethnic Fukinenese, 12% were of Hakka origin, 14% were Aboriginal and 6% were born in mainland China.
In the “Hakka areas” strata, the majority of males were of Hakka origin, followed by Mainland China (Data in this paragraph not shown). The majority of females were also of Hakka origin, followed by ethnic Fukienese. More than 99% of elderly Aboriginal people resided in either the “Mountain areas” or “Eastern areas” strata. In the PengHu islands, half of the males were ethnic Fukienese and the other half were from Mainland China. Almost all of the females in PengHu islands were ethnic Fukienese. There were a similar proportion of males from Mainland China in the 3rd Northern stratum, the 1st and 2nd Central strata and the 1st and 2nd Southern strata. However, in the remaining 3 strata in Northern, Central and Southern Taiwan, the majority of men were ethnic Fukienese. The majority of elderly women from Mainland China resided in the 1st Northern stratum, the 2nd Southern stratum and the 3rd Northern stratum.
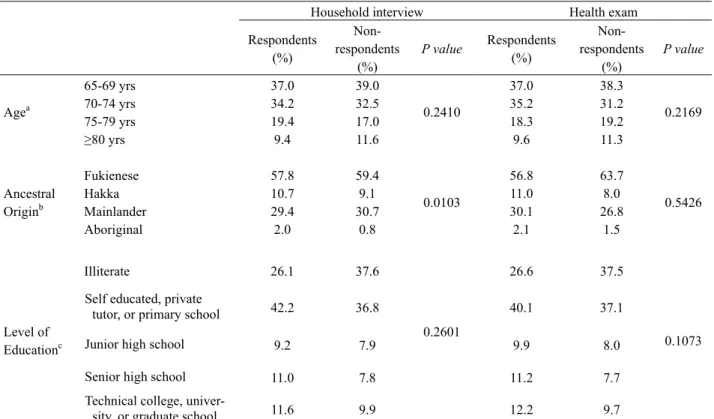
Table 3. Distribution of age, ancestral origin, and level of education in male respondents and non-respondents
Household interview Health exam Respondents (%) Non- respondents (%) P value Respondents (%) Non- respondents (%) P value 65-69 yrs 37.0 39.0 37.0 38.3 70-74 yrs 34.2 32.5 35.2 31.2 75-79 yrs 19.4 17.0 18.3 19.2 Agea ≥80 yrs 9.4 11.6 0.2410 9.6 11.3 0.2169 Fukienese 57.8 59.4 56.8 63.7 Hakka 10.7 9.1 11.0 8.0 Mainlander 29.4 30.7 30.1 26.8 Ancestral Originb Aboriginal 2.0 0.8 0.0103 2.1 1.5 0.5426 Illiterate 26.1 37.6 26.6 37.5
Self educated, private
tutor, or primary school 42.2 36.8 40.1 37.1
Junior high school 9.2 7.9 9.9 8.0
Senior high school 11.0 7.8 11.2 7.7
Level of Educationc
Technical college,
univer-sity, or graduate school 11.6 9.9
0.2601
12.2 9.7 0.1073
aNot weighted. Household interview: no data for 0.78% of non-respondents; Health exam: no data for 1.33% of non-respondents. bWeighted using SUDAAN. .Household interview: no data on 0.10% of respondents and 3.26% of non-respondents Health exam: no data
on 0.08% of respondents and 4.54% of non-respondents; cWeighted using SUDAAN. Household interview: no data on 0.31% of respondents
Comparison of respondents and non-respondents The age, ethnicity and educational level of respondents and non-respondents were compared (Tables 3 & 4). In the male sample, there was no difference in age distri-bution between respondents and non-respondents. After weighting the sample using SUDAAN, comparison of between respondents and non-respondents showed a difference in ethnic group distribution between these groups for household interview data. However, the percentage difference was relatively small. No difference in educational level between the two groups was found. There was no statistical difference between respondents and non-respondents for the health exam data. Although the age of female non-respondents was higher on average, after weighting with SUDAAN, no difference in ethnicity or educational level was shown between respondents and non-respondents.
Discussion
The Elderly Nutrition and Health Survey in Taiwan
(1999-2000) is a milestone in the history of nutritional surveys in Taiwan. This is the first nutritional survey of a
represen-tative sample of elderly people across the whole of
Tai-wan. In the sampling design of this survey, we included
the strata of “Mountain areas”, “Eastern areas”, “Hakka areas” and “PengHu islands” based on lifestyle characte-ristics and geographical locations. In addition, differen-ces throughout the west coast of Taiwan from North to South were also considered. As a result, the west coast
was divided into the three strata of “Northern”, “Central” and “Southern” Taiwan and then each of these strata were further divided into three strata each according to high, medium, or low population density. This division, match-ing the administrative structure, can provide nutrition and health information for regional Department of Health. It was also the first time that high-quality information about average calorie and nutrient intake were obtained in a representative sample of elderly persons in Taiwan. In order to develop an understanding of factors influencing the nutritional status of elderly persons, detailed infor-mation about knowledge, attitudes, and practice was also collected including familiarity with the idea of a balanced diet and attitudes about not eating certain culturally for-bidden foods. In addition, in order to help demonstrate the importance of nutrition in the elderly, detailed assess-ment was made of health status, medical history, ability to perform activities of daily living, quality of life and cog-nitive function. This enabled the development of a deeper understanding of the relationship between nutrition and physical and mental functioning in elderly persons. In the interest of sustainability, this project took advan-tage of public health system infrastructure to enable the survey to be carried out by locally employed part-time interviewers supervised by local health department nutri-tionists. However, our experience demonstrated that the duties assigned to local health department nutritionists by their respective local governments varied considerably and as a result, the nutritionists were not always in a po-sition to comply with central government requirements to
Table 4. Distribution of age, ancestral origin, and level of education in female respondents and non-respondents
Household interview Health exam Respondents (%) Non- respondents (%) P value Respondents (%) Non- respondents (%) P value 65-69 yrs 40.8 34.4 40.6 33.4 70-74 yrs 31.4 28.8 30.6 29.6 75-79 yrs 16.3 21.2 18.4 19.4 Agea ≥80 yrs 11.4 15.6 0.0006 10.5 17.7 <0.0001 Fukienese 76.5 80.8 73.9 80.4 Hakka 13.0 9.5 13.5 9.8 Mainlander 8.6 8.0 10.4 7.8 Ancestral Originb Aboriginal 2.0 1.8 0.4482 2.2 2.0 0.3731 Illiterate 60.5 66.8 58.4 67.3
Self educated, private
tutor, or primary school 29.5 25.1 31.6 23.9
Junior high school 5.6 3.7 5.2 4.4
Senior high school 3.1 2.1 2.7 2.6
Level of Educationc
Technical college,
univer-sity, or graduate school 1.4 2.2
0.2377
2.1 1.8 0.2922
aNot weighted. Household interview: no data for 0.51% of non-respondents; Health exam: no data for 0.08% of respondents and 1.17% of
non-respondents; bWeighted using SUDAAN. Household interview: no data on 0.10% of respondents and 2.53% of non-respondents Health
exam: no data on 0.25% of respondents and 2.77% of non-respondents; c Weighted using SUDAAN. Household interview: no data on 0.21%
WH Pan et al. 210
supervise the interviews and monitor survey progress and quality. Based on this experience, in the future, desig-nated full-time interviewers will be employed and will travel throughout Taiwan to carry out the survey. The re-sponse rates of 55% for the household interview and 53% for the health exam were lower than that of the Nutrition and Health Survey in Taiwan 1993-1996 (74% response rate) and this was likely related to our survey relying on public health system resources for implementation as opposed to the employment of professional interviewers. In this survey there was a slight difference in age be-tween respondents and non-respondents. The data were weighted using SUDAAN and adjusted for sampling effects. The data were divided into different gender and age groups, with the number of persons adjusted accor-ding to national population distributions. After adjust-ment, there was no large difference in educational level or ethnicity distribution between respondents and non-respondents. This indicates that the results of this survey can be used an unbiased representation of the whole of Taiwan after weighing process. We expect that the data from this survey will help further understanding of nutri-tional status, the relationship between nutrition and health, and factors influencing nutritional status in elderly people. This information can be used in the design of public health nutrition policies that will promote nutrition and health in elderly people in Taiwan.
Acknowledgements
We would like to thank all of the interviewers, local health department nutritionists and all of those who assisted with the survey in local areas. We are particularly grateful for financial support from the Department of Health, Executive Yuan (Project name: Second Nutrition and Health Survey in Taiwan 1997-2002).
References
1. Department of Health, Executive Yuan. Republic of China 2001 Health Statistics (2) Vital statistics, Department of Health, Executive Yuan, Taipei City, 2002. Available at http://www.doh.gov.tw/statistic/data/.
2. Ervin RB, Wright JD, Reed-Gillette D. Prevalence of leading types of dietary supplements used in the Third National Health and Nutrition Examination Survey, 1988- 94. Adv Data 2004; 9 (349):1-7.
3. Perkins AJ, Hendrie HC, Callahan CM, Gao S, Unverzagt FW, Xu Y, Hall KS, Hui SL. Association of antioxidants with memory in a multiethnic elderly sample using the Third National Health and Nutrition Examination Survey. Am J Epidemiol 1999;150 (1): 37-44.
4. Kawado M, Hashimoto S, Matsumura Y, Oguri S, Okayama A, Nakamura Y, Yanagawa H. Nutrient intake of elderly people with care need and caregivers based on data of the Comprehensive Survey of the Living Conditions of People on Health and Welfare and the National Nutrition Survey in Japan. Nippon Koshu Eisei Zasshi 2002; 49 (9): 922-8.
5. Bates CJ, Thane CW, Prentice A, Delves HT. Selenium status and its correlates in a British national diet and nutrition survey: people aged 65 years and over. J Trace Elem Med Biol 2002; 16 (1):1-8.
6. Tavares EL, Anjos LA. Anthropometric profile of the elderly Brazilian population: results of the National Health and Nutrition Survey, 1989. Cad Saude Publica 1999; 15 (4): 759-68.
7. Doyle W, Crawley H, Robert H, Bates CJ. Iron deficiency in older people: interactions between food and nutrient intakes with biochemical measures of iron; further analysis of the National Diet and Nutrition Survey of people aged 65 years and over. Eur J Clin Nutr 1999; 53 (7): 552-9. 8. Huang CY, Wang RS, Gu HQ, Chen H, Yuan JH. A survey
of social nutrition status of the elderly in the urban area of Chengdu, Sichuan Province. Biomed Environ Sci 1998; 11 (3): 277-85.
9. Decarli B, Dirren H, Schlettwein-Gsell D. Swiss Survey in Europe on Nutrition and the Elderly: nutritional status of a Yverdon population aged 74 to 79 years old over a period of four years. Rev Med Suisse Romande 1998; 118 (8):701-7.
10. Schroll K, Moreiras-Varela O, Schlettwein-Gsell D, Decarli B, de Groot L, van Staveren W. Cross-cultural variations and changes in food-group intake among elderly women in Europe: results from the Survey in Europe on Nutrition and the Elderly a Concerted Action (SENECA). Am J Clin Nutr 1997; 65 (4 Suppl): 1282S-1289S.
11. van Staveren WA, de Groot LC, Burema J, de Graaf C. Energy balance and health in SENECA participants. Survey in Europe on Nutrition and the Elderly, a Concerted Action. Proc Nutr Soc 1995; 54 (3): 617-29.
12. Yang KH. Hakka people in Taiwan. Taipei, Taiwan: Tang Shan Publishing Co, 1993.
13. Ministry of the Interior. Taiwan population statistics, Taipei, Taiwan: Ministry of the Interior, 1999.
14. Pan WH, Hung YT, Shaw NS, Lin W, Lee SD, Chiu CF, Lin MC, Chen SY, Hong CM, Huang TY, Chang HY, Tu SH, Chang YH, Yeh WT, Su SC. Elderly Nutrition and Health Status in Taiwan 1999-2000: training manual for personal interview. Taipei, Taiwan: Academia Sinica, 1999.
15. Pan WH, Hung YT, Shaw NS, Lin W, Lee SD, Chiu CF, Lin MC, Chen SY, Hong CM, Huang TY, Chang HY, Tu SH, Chang YH, Yeh WT, Su SC. Elderly Nutrition and Health Status in Taiwan 1999-2000: training manual for health exam. Taipei, Taiwan: Academia Sinica, 1999.