(1995), 69-89. With 3 figures
Patterns
of
diversification and genetic population
structure of small mammals in Taiwan
HON-TSEN YU
Museum of Vertebrate Zoology and Department of Integrative Biology, University of California, Berkeley, CA 94720, USA*
Received 22 March 1994; accepted for publication 21 September 1994
Taiwan is a mountainous island off the coast of the Asian continent. The island is located on the continental shelf and rises to an elevation of nearly 4000 m. It became an island approximately 4 million years ago and has been connected to the continent more than once since its emergence. Therefore, the elevational zonation of two Taiwanese pairs of congeners in the rodent genera Apodemus and Niviventer can be explained by one of two competing hypotheses. One hypothesis assumes that speciation of the two congeners occurred in situ after an ancestral species migrated from the continent. In contrast, the second hypothesis argues the zonation resulted from separate incursion events during the connections. The phylogenetic analyses, which are based on electrophoretic allozyme data, reject the first of these hypotheses. Furthermore, genetic population structure and gene flow of three species of Taiwanese rodents (Apodemus semotus, Niviventer culturatus and Microtus kikuchiz) are studied in relation to their patterns of elevational distribution. The genetic structure of A . semotus and N. culturatus, which have extensive elevational distribution, is rather homogeneous and no genic discontinuity or cline in allele frequency was detected. Gene flow among subpopulations for these two species is rather substantial; therefore, the potential isolating effect imposed by deep river valleys is minimal. Conversely, isolation of populations of M. kikuchii on different mountaintops is quite complete as mirrored by the high level of genic differentiation and low gene flow.
ADDITIONAL KEY WORDS:-biogeography - Asian mammals - allozyme variation - gene
flow - Fstatistics - elevational cline.
CONTENTS
Introduction . . . 70
Material and methods . . . 7 1 Results . . . 73
Allozymic variation and heterozygosity . . . 73
Genetic distances . . . 75
Genetic population structure . . . 76
Geneflow . . . 77
Relationships among congeneric species and populations . . . 77
Discussion . . . 78
Phylogeny and biogeography . . . 78
Geneticvariationand environmental heterogeneity . . . 81
Acknowledgements . . . 83
References . . . 83
Appendices . . . 85
*Present address and address for correspondence: Dr Alex Hon-Tsen Yu, Department of Zoology, National Taiwan University, Taipei, Taiwan, ROC.
70 HON-TSEN W INTRODUCTION
The island of Taiwan rose from the sea floor on the Asian continental shelf about 4 million years ago (Hsu, 1990). The island is not only geologically young but also has a sharp elevational gradient, its elevation rising from sea level to nearly 4000 m within a horizontal distance of less than 100 km. As a consequence, many drainages etch deeply through the mountainous terrain and isolate the ridges that are divided by these drainages. These geographic barriers might affect the genetic structure of various populations of small mammals (as, for example, in the North American pocket gopher Thomomys bottae, Patton & Smith, 1990; Smith & Patton, 1980; Smith et al., 1983) that inhabit different drainages in Taiwan. Moreover, climate and vegetation change drastically along the vertical slopes (Yu, 1992, 1994). These changes create heterogeneous environments that might also affect genetic differentiation in natural populations (Hedrick et
aL,
1976; Hedrick, 1986; Schnell & Selander, 1981).The geological history of Taiwan has also likely had importance in shaping the modern distribution of small mammals on the island. The island lies just 120 km offshore east of the Asian continent, separated by the shallow Strait of Taiwan (mostly < l o 0 m deep). Both faunistic analysis (Kano, 1940) and geological evidence (Huang, 1984; Kano, 1940; Liu & Ding, 1984) indicate that Taiwan was connected to the Asian continent at least twice, initially during the Pliocene and again during the Pleistocene of receding sea level in the peak of glaciation. Moreover, during the Pleistocene there might have been more than one connection due to sea-level lowering (Fairbanks, 1989; Gascoyne et al., 1979). These connections potentially allowed multiple faunistic exchanges between the island and continent. Although this scenario is appealing, it has not been tested.
Two aspects of the modern distribution of small mammals in Taiwan (Yu, 1992, 1994; also see Kano, 1940) are of interest in relation to its geography and geological history. First, some species such as Apodemus semotus and Niviventer culturatus are widely distributed across the elevational gradient (1400-3670 m), whereas an endemic species of vole (Microtus kikuchiz) is narrowly restricted to tops of high mountains, mostly from 3000 to 3670 m (Yu, 1992, 1994). Genetic variation within species has been shown to be related to their ecological, demographic, biogeographic, and life history correlates (Nevo et al., 1984; Busack, 1986; Bowen, 1982). For Taiwanese small mammals, it is interesting to see if differences in patterns of microgeographic distribution may have influenced genetic characteristics after geological events had isolated these taxa from their continental relatives.
Second, a pair of species in each of the genera Apodemus and Niviventer occurs in Taiwan, and members of each pair have parapatric elevational distributions. Apodemus ugrarius lives in lowlands ( < 1000 m) and A. semotus (endemic) in highlands (1400-3670 m); N. coxingi occurs no higher than 2000 m and N. culturatus from about 2000 to 3600 m on forested slopes (Yu, 1992, 1994). The two species of Niviventer are endemic to Taiwan. Furthermore, both genera have several congeners distributed in the Eurasian continent. The genus Apodemus has 21 species widely spread in the Palearctic region (Wilson & Reeder, 1993) and 15 species of Niviventer occur throughout Southeast Asia (Musser, 1981; Wilson & Reeder, 1993).
71
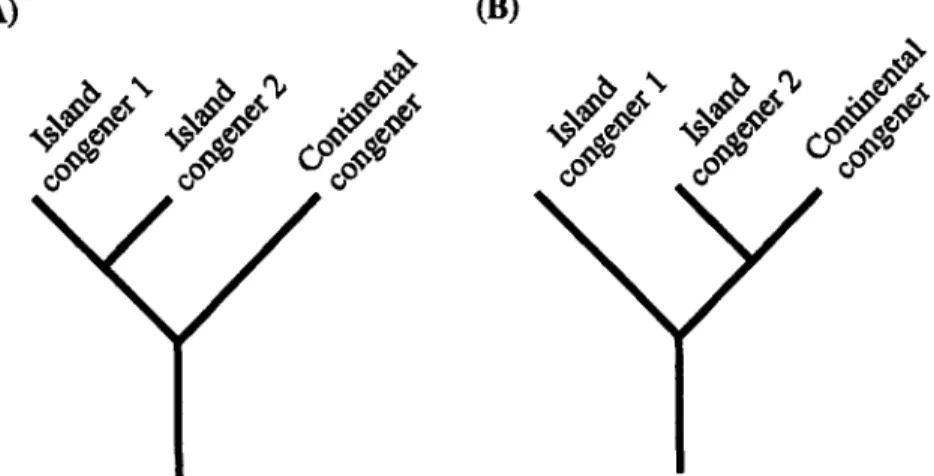
At least two alternative evolutionary hypotheses can explain the zonational distribution of two congeners in Taiwan, considering its geological history, One hypothesis is that there was only one incursion of each genus from the continent since the island emerged, followed by parapatric speciation (Endler, 1977), resulting in today’s zonational distribution (see Cadle & Patton, 1988; Endler, 1982a,b; Patton et al. 1990; Patton & Smith, 1992). However, the zonational distribution also can be interpreted by separate introductions from the mainland at different times following continental allopatric divergence. Assuming the multiple-incursion hypothesis, one can postulate many scenarios of speciation events and subsequent incursions, none of which can be tested easily. However, the hypothesis of a single incursion can be explicitly tested by a robust phylogenetic analysis. As a result of parapatric speciation within the island, this hypothesis demands that the two congeners in Taiwan be sister taxa to each other rather than to any other congeners from the continent (Fig. 1).
I
address two questions in this paper. First, I use allozyme electrophoresis to examine the geographic patterns of genetic differentiation in three species of rodents (A. semotus, N. culturutus andM.
kikuchii). This examination focuses on: (1) determining intraspecific differentiation existing within each species; and (2) comparing the patterns of differentiation among species, particularly in relation to the two distinct types of elevational distribution and to gene flow. Second, genetic information, which was gathered through allozyme analyses, was used to reconstruct phylogenetic relationships among congeners in Apodemus and Niuiventer, both from Taiwan and the continent, to test the hypothesis that there was a single incursion of small mammals from the Asian mainland to Taiwan.MATERIAL AND METHODS
Animals and frozen tissue were collected along three elevational transects (1400-3670 m) during 1989-1990 from Yushan National Park in central
Figure 1. Cladograms of the predicted phylogenetic relationships among extant congeneric taxa both in Taiwan and the continent resulting from (A) single incursion and (B) multiple incursion hypothesis.
72 HON-TSEN YU
Taiwan. Field sampling methods and maps of the transects are given in detail by Yu (1992, 1994). Transect 1 and 2 run along two drainages flanking a mountain ridge and lead to the same mountaintop (Mt. Yushan, 3995 m). Transect 3 is c. 24 km south of Mt. Yushan on a slope which is pinnacled by Mt. Guanshan (3600 m).
Kidney samples of A. semotus
( n =
154), N. culturutus ( n = 71), andM.
kikuchii
( n
= 79) collected from the three transects were analysed by horizontalstarch-gel electrophoresis. In addition, kidney of A. ugrurius ( n = 2) and N. coxingi ( n = 6) collected from lowlands of Taiwan,
M.
firtzk ( n = 2) from Korea, A. ugrurius( n
= 3) from Serbia,N.
bukit ( n = 2) from China, and M. culifornicus ( n = 2) from the United States are included in the analysis. Nineteen enzymes and other proteins encoded by 26 presumptive gene loci (values follow E.C. numbers) were examined for all samples: Glycerol-3- phosphate dehydrogenase (Gpd, E.C. 1.1.1.8), Sorbitol dehydrogenase (Sordh, E.C. 1.1.1.14), Lactase dehydrogenase(Ldh-7,
Ldh-2, E.C. 1.1.1.27), Malate dehydrogenase(Mdh- 7,
Mdh-2, E.C. 1.1.1.37), Malic enzyme (Me- 7 , Me-2, E.C. l.l.1.40), Isocitrate dehydrogenase (Icd-7, Icd-2, E.C. 1.1.1.42), 6- phosphogluconate dehydrogenase (G-Pgd,
E.C. 1.1.1.44), Glucose-6-phosphate dehydrogenase (Gd, E.C. 1.1.1.49), Glyceraldehyde-3-phosphate-dehydrogenase (Gupdh, E.C. 1.2.1.12), Superoxide dismutase(Sod-
7, Sod-2, E.C. 1.15.1. l),Purine nucleoside phosphorylase
(Np,
E.C. 2.4.2. l), Glutamate oxalate transaminase (Got- 1, Got-2, E.C. 2.6.1. I), Phophoglucomutase( P m
E.C. 2.7.5. l), L-leucyl-alanine(La-
7, 3.4.11. l), L-leucylglycylglycine(Lgg,
E.C. 3.4.11.4), L-phenylalanyl-L-proline (Pup, E.C. 3.4.1 1.5), Aconitase (Acon-7, Acon-2, E.C. 4.2.1.3), Glucose-phosphate-isomerase (Gpi, E.C. 5.3.1.9), and Albumin (Alb). Tissue was first homogenized and centrifuged at 4°C and 15000 rpm for 45 min. The aqueous protein extracts were then stored at- 76°C for later electrophoretic analysis. The gel-running conditions follow
Yu (1992) and are available on request. The electrophoretic procedures follow those of Patton & Yang (1977) and Selander et
ul.
(1971). Protein assays were prepared according to Harris & Hopkinson (1976) and Selander et ul. (1971). Alleles (electromorphs) at each locus were designated alphabetically in decreasing order of anodal mobility. Because the alleles of Glycero-3- phosphate dehydrogenase (Gpd) in Microtus could not be scored reliably, the locus was excluded from the analysis for that genus.Levels of heterozygosity were derived from the electromorphic genotypes by direct count and averaged across loci. The genetic distances of Rogers (1972) and Nei (1978) were calculated from allelic frequencies. Patterns of phenetic similarity among populations and taxa were obtained by UPGMA clustering (Sneath & Sokal, 1973) of Rogers’ genetic distances. Phylogenetic analysis was performed by parsimony methods; each locus was treated as a character and allelic combinations as character states (Buth, 1984). Character states were unordered. Loss or gain of an allele between two character states was counted as one step and a step matrix was constructed as described by Mabee & Humphries (1993). All the above analyses except parsimony were executed using the BIOSYS-1 program (Swofford & Selander, 1981) on an IBM 434 1 mainframe computer. Parsimony phylogenetic analysis was done by PAUP (version 3.0s; Swofford, 1991) on an Apple Macintosh Classic 11. The exhaustive option of PAUP was chosen to search for all shortest
73
trees based on the coding method described by Mabee & Humphries (1993).
. Wright’s F-statistics
(fiS
and were calculated to analyse genetic structureof the sampled populations (Wright, 1965, 1978). F,, is the inbreeding coefficient measuring the reduction in heterozygosity of an individual due to non-random mating within its subpopulation; positive values indicate heterozygote deficiencies whereas negative ones signal excesses. FST, the fixation index, assesses the amount of differentiation among subpopulations; its value ranges from 0 to 1, 0 meaning no differentiation at any locus and 1 absolute differentiation at all loci. To test the null hypothesis that F,,
equals 0, n(&)’, where n is the total number of individuals, was computed, with one degree of freedom in a
X 2
distribution (Baker, 1981; Nei, 1977) The significance ofFST
was tested by the formulae given in Workman and Niswander (1970), with ( r - 1) ( k - 1) degrees of freedom, where r is the number of subpopulations and k the number of alleles at a locus, also in aX 2
distribution.To estimate levels of gene flow
(Nm),
a formula based on genic frequency of ‘private alleles’ (Slatkin, 1985) was used. When the sample size (n) was less than 25, correcting factors (25/n) were multiplied to yield Nm, (Slatkin,1985). A second estimate of gene flow was calculated by the formula
l$T = 1/(4Nm+l) (Wright, 1943).
For convenient comparison,
I
divided samples from different transects into comparable elevations; low (below 2000 m), middle (2300-2600 m) and high (above 3300 m) in A . semotus, and low (below 2400 m) and high (above3000 m) in N . culturatus. However, since
M.
kikuchii is restricted to mountaintops which are usually above 3000 m,I
grouped its samples according to the elevation at which the voles were captured. Consequently, different samples were abbreviated as, for example, TI-low or T3-3000 m which means the sample was collected from the low elevation on Transect 1 and 3000 m on Transect 3, respectively. Locality data and museum catalog numbers for all individuals examined are given in Appendix 1.RESULTS
Allozymic variation and hetoerzygosity
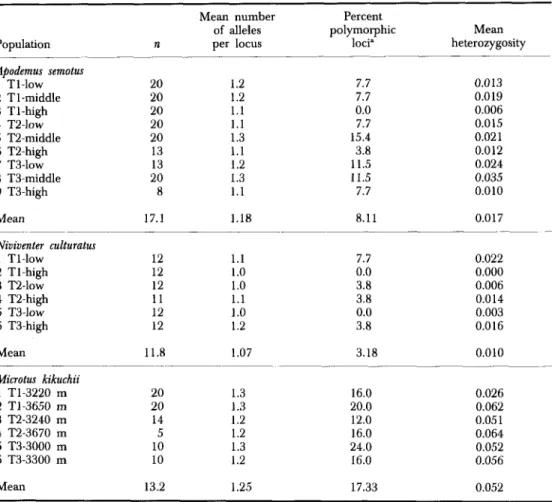
Complete lists of allelic frequencies for each species are given in Appendix 2. The following provides a summary of the results. Levels of genetic variation for all populations are summarized in Table 1.
Apodemus
Of the 26 loci scored, 13 (50%) were variable either within or between populations of A . semotus and A . agurius. Of these variable loci, 10 (38% of total) showed at least a single heterozygote in A. semotus, the others were monomorphic. Apodemus agarius was fixed at four loci at alleles which did not occur in A . semotus and was polymorphic at five loci.
For A. semotus (Table l), the mean numbers of alleles per locus ranged from 1.1 to 1.3, with an average of 1.18; the percentage of polymorphic loci ranged from 0 (Tl-high) to 15.4 (T2-middle); the mean heterozygosity per
74 HON-TSEN YU
TABLE 1. Sample sizes (n), mean number of alleles per locus, percentage of loci polymorphic, and mean heterozygosity across loci in species and populations of three rodent genera from
Taiwan Population n Mean number of alleles per locus Apodemus semotus 2 T1-middle 3 T1-high 5 T2-middle 6 T2-high 8 T3-middle 9 T3-high Mean 1 T1-low 4 T2-low 7 T 3 - 1 0 ~ 20 20 20 20 20 13 13 20 8 17.1 Niviventer culturatus 2 T1-high 4 T2-high 6 T3-high 1 T1-low 3 T2-low 5 T 3 - 1 0 ~ Mean 12 12 12 11 12 12 11.8 1.2 1.2 1.1 1.1 1.3 1.1 1.2 1.3 1.1 1.18 Percent polymorphic loci" .~ 7.7 7.7 0.0 7.7 15.4 3.8 11.5 11.5 7.7 8.11 Mean heterozygosity 0.013 0.019 0.006 0.015 0.021 0.012 0.024 0.035 0.010 0.017 1.1 7.7 1 .0 0.0 1 .0 3.8 1.1 3.8 1 .O 0.0 1.2 3.8 1.07 3.18 0.022 0.000 0.006 0.014 0.003 0.016 0.010 Microtus kikuchii 1 T1-3220 m 2 Tl-3650 m 3 T2-3240 m 4 T2-3670 m 5 T3-3000 m 6 T3-3300 m Mean 20 20 14 5 10 10 13.2 1.3 1.3 1.2 1.2 1.3 1.2 1.25 16.0 20.0 12.0 16.0 24.0 16.0 17.33 0.026 0.062 0.051 0.064 0.052 0.056 0.052
"Frequency of the most common allele less than 0.95.
individual per population was 0.017, ranging from 0.006 (TI-high) to 0.035 (T3-middle).
Niviventer
Fourteen (54%) of 26 loci scored in the three species of Niviventer were variable. However, in N. culturatus only seven (27%) of the 26 loci showed at least a single heterozygote. Niviventer coxingi showed heterozygotes in just two loci. Niviventer coxingi was fixed at nine loci at alleles not shared with
N. culturatus. Niviventer bukit showed fixed differences from N. culturatus at 10 loci. Five loci had fixed differences between N. coxingi and
N.
bukit.Levels of genetic variation among populations of
N.
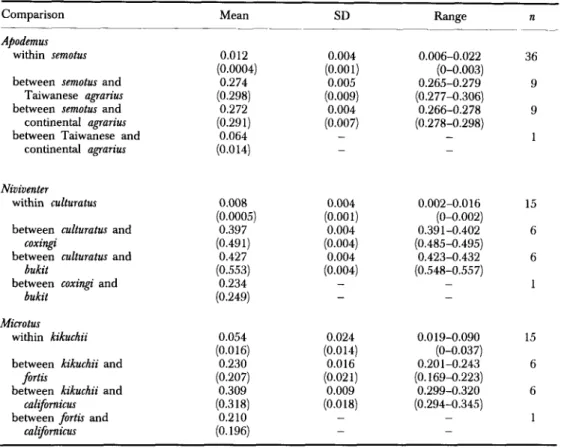
culturatus are summarized in Table 1. The mean number of alleles per locus ranged from 1.0 to 1.2, with an average of 1.07. The percentage of polymorphic loci ranged from 0 to 7.7, and averaged 3.18. The mean heterozygosity per individual per population was 0.01, ranging from 0 to 0.022.75 TABLE 2. Summary of genetic distance estimates based on allelic frequencies among populations and species of three rodent genera from Taiwan. Both Nei’s (1978) and Roger’s (1972; in parentheses) distances are given. n is the sample size of pairwise comparisons
Comparison Mean SD Range n
__ ~-
~~
Apodemus
within semotus
between semotus and Taiwanese agrarius between semotus and continental agrarius between Taiwanese and
continental agrarius
Niviventer
within culturatus
between culturatus and
between culturatus and
between coxingi and
coxingi bukit bukit Microtus
within kikuchii
between kikuchii and
between kikuchii and
between fortis and
fortis californicus c a l f o r n i m 0.012 (0.0004) 0.274 (0.298) 0.272 (0.291) 0.064 (0.014) 0.008 (0.0005) 0.397 (0.491) 0.427 (0.553) 0.234 (0.249) 0.054 (0.0 1 6) 0.230 (0.207) 0.309 (0.318) 0.210 (0.196) 0.004 0.005 0.004 (0.007) (0,001) (0.009) 0.004 0.004 (0.004) 0.004 (0.004) (0,001) 0.024 (0.014) 0.016 0.009 (0.021) (0.018) - - 0.006-0.022 36 (0-0.003) 0.265-0.279 9 (0.277-0.306) 0.266-0.278 9 (0.278-0.298) 1 - - 0.002-0.016 15 0.391-0.402 6 (0.485-0.495) 0.423-0.432 6 (0.548-0.557) 1 (0-0.002) - - 0.019-0.090 15 0.201-0.243 6 (0.169-0.223) 0.299-0.320 6 (0.294-0.345) 1 (0-0.037) - - Mimotus
Fourteen (56%) of 25 loci scored in the three species of Microtus were variable. In
M.
kikuchii nine loci were variable and 16 loci were monomorphic. Mimotus fortis showed heterozygotes at three loci. Microtus californicus washeterozygous in two loci. Mimotus fortis had fixed differences at three loci from M. kikuchii. Mimotus californicus showed fixed differences at six loci from
M.
kikuchii. Four loci had fixed differences between M. fortis and M . californicus.Levels of genetic variation among populations of M, kikuchii are greater
than A. semotus and
N.
culturatus. The mean number of alleles ranged from1.2 to 1.3, with an average of 1.25. The percentage of polymorphic loci ranged from 12.0 to 24.0, and averaged 17.33. The mean heterozygosity per individual per population was 0.052, ranging from 0.026 to 0.064.
Genetic distances
Genetic distances (Nei’s and Rogers’) are presented as pairwise comparisons among populations (Table 2).
76 HON-TSEN YU
Apodemus
For A . semotus, Nei’s genetic distances between pairs of populations from different transects and elevations were low, ranging from 0.006 to 0.022, average 0.012. For A . ugrurius, Nei’s distance between populations on the island and on the continent was 0.064 or about five times greater than the average intraspecific Nei’s distance within A . semotus (0.0 12). Apodemus semotus, however, is equally distant to Taiwanese and continental A . ugrurius, with Nei’s distance of 0.274 and 0.272, respectively.
Niviventer
Similar to A. semotus, intraspecific genetic distances among N . culturutus were low. Nei’s distances ranged from 0.002 to 0.016, and averaged 0.008. The average Nei’s distances between N . culturutus and N . coxingi was 0.397 and that between N . culturatus and N . bukit was 0.427. However, N . coxingi and N . bukit were genetically more similar, with a Nei’s distance of 0.234.
Mimotus
Unlike A. semotus and N . culturatus, Nei’s genetic distances were greater among populations in
M.
kikuchii, varying from 0.019 to 0.090, with an average of 0.054 or about 4-6 times greater than those among A . semotus and N . culturutus. The average Nei’s distance betweenM.
kikuchii andM.
fortis was 0.230, and that between
M.
kikuchii andM.
culifornicus was 0.309. Nei’s distance betweenM.
fortis andM.
culijornicus was 0.210.Genetic population structure
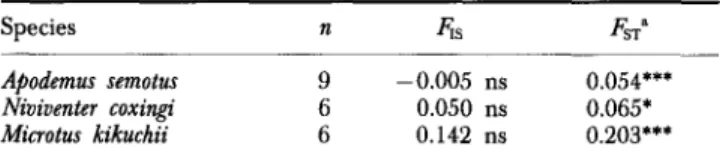
were calculated to analyse genetic structure of the sampled populations for A . semotus, N. culturutus and M. kikuchii (Table 3) on the transects.
Fstatistics
(F,s
andApodemus semotus
Mean F,, is low (-0,005) and not significantly different from 0, suggesting random mating. FST ranged from 0.017 to 0.094, and averaged 0.054. Even
though the FST differs significantly from 0, it is relatively small and therefore
the species is genetically more homogeneous across its subpopulations than
M.
kikuchii.TABLE 3. Fstatistics for three species of rodents from Taiwan.
n equals number of subpopulations. Values are for the weighted average across all variable loci in each species
Species n 6 s FSTa
Apodemus semotus 9 -0.005 ns 0.054*** Niviventer coxingi 6 0.050 ns 0.065* Microtus kikuchii 6 0.142 ns 0.203***
“Equivalent to Nei’s (1977) GsT.
* P < 0.05; *** P < 0.001; ns P > 0.05, testing null hypothesis that
77 Niviuenter culturatus
Mean
F,,
is 0.050 and not significantly different from 0, also suggesting random mating. Similar to A. semotus, meanFsT
(0.065) is significantly different from 0 but small. Therefore, little genetic differentiation exists among subpopulations.Microtus kikuchii
In contrast to the other two species,
M.
kikuchii showed some evidence of nonrandom mating (mean F,, 0.142); however, this mean value was not significantly different from zero(P
>
0.05). Moreover, its subpopulations exhibited much higher genetic differentiation (mean 0.203;P
<
0.001)compared to the other two widely distributed species.
Gene $ow
The levels of gene flow for the three species of rodents are given in Table
4. Gene flow estimated by ‘private alleles’ among populations from different transects and elevations was rather high in
A.
semotus and N. culturatus, 3.867and 5.604, respectively. This result indicates that gene exchange occurs frequently not only among the populations across elevations within one transect but also among those from different drainages, for both species which showed extensive elevational distribution. In contrast, the gene flow among populations of M. kikuchii was low, 0.308 estimated by ‘private allele’ methods, reflecting its physical isolation on tops of mountains. Gene flow estimated by
FsT
also points to the same trend even though this methodindicates greater gene flow in A. semotus (4.380) than N . culturatus (3.596).
Still, gene flow in both species are roughly 3-5 fold of that in
M.
kikuchii (0.982).Relationships among congeneric species and populations
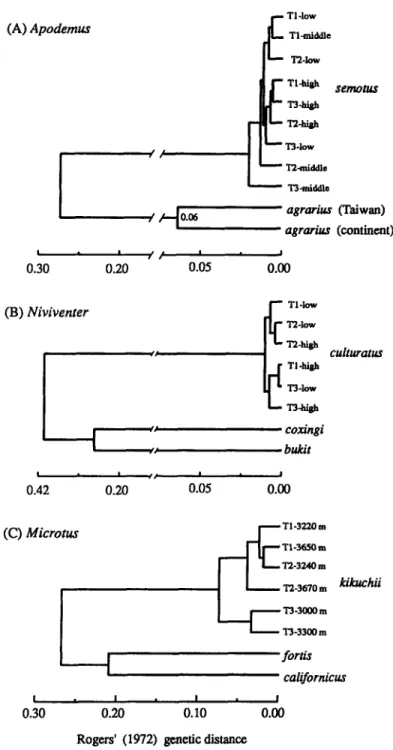
For each genus of rodent, the phenetic affinity among species and populations suggested by allozyme data are illustrated in UPGMA dendrograms
TABLE 4. Estimates of gene flow (Nm) in three species of rodents from Taiwan. Number (n) and average frequency (p(7)) of private alleles, number of demes
(4,
and average sample size (N) used for Slatkin’smethod are also given
Slakin (1985) Wright ‘private’ alleles (1943) Species Nm n p(1) d N Nm“ Apodemus semotus 3.867b 3 0.0533 9 17.1 4.380 Niviventer culturatus 5.604b 6 0.0533 6 11.8 3.596 Mimotus kikuchii 0.308 5 0.1580 3’ 26.3 0.982 “Calculated by & = 1/(4Nm+l).
‘Populations from the same transect were pooled. Nm = Nw, corrected for sample size.
78 HON-TSEN W
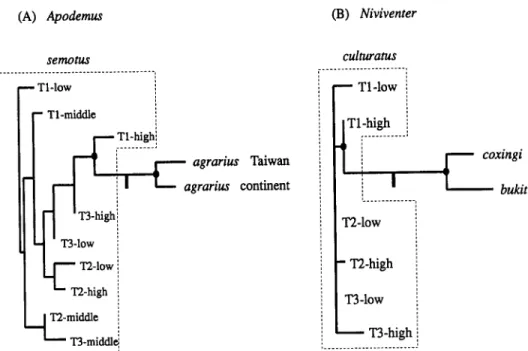
based on Rogers’ genetic distances (Fig. 2). For Apodemus and Niviventer, the phylogenetic trees based on parsimony are presented in Figure 3. The trees are rooted at mid-point based on the assumption that rates of evolution are equal in all lineages.
Apodemus
Based on UPGMA clustering (Fig. 2A), the population of A . ugrurius from the lowlands of Taiwan is much closer to that from the Eurasian continent (Serbia) than to A. semotus from the highlands of Taiwan. Populations of
A.
semotus are shallowly branched and do not cluster consistently either by one elevation or by one transect. In particular, in
A .
semotus there are no elevational clines defined by allozyme variations. When polymorphic loci are examined individually (Appendix a), no alleles at any locus appear to correlate with elevation.Phylogenetic analysis of Apodemus by exhaustive search of PAUP reveals three shortest trees each with 31 steps and a consistency index (CI) 0.808.
The 50% majority-rule consensus tree is shown in Figure 3A in which two nodes that were identified by more than 90% of bootstrap replicates are indicated. One includes all nine populations of A . semotus while the other contains A . ugrarius from both Taiwan and the continent. The results refute that the two species of Apodemus in Taiwan are sister taxa.
Niviventer
Phenetically, N . coxingi from Taiwan is more similar to N . bukit from China than to the parapatric N. culturutus (Fig. 2B). As in A . semotus, no clusters are grouped consistently either by elevation or by transect among six populations of N . culturatus. The genetic differentiation among populations of
N. culturutus is also low (the deepest node occur at c. 0.01 Rogers’ genetic distance) and no elevational clines in polymorphic allozyme frequencies are detected (see Appendix 2).
Phylogenetic analyses of Niuiuenter by PAUP generate 105 equally parsimonious trees 25 steps in length (CI = 0.909). Figure 3B illustrates the
50% majority-rule consensus tree in which two nodes with support of 90%
or more bootstrap replicates are identified. The lowland species from Taiwan,
N . coxing< forms a sister group with N. bukit from China rather than with
N . culturutus the highland species from Taiwan. All six populations of
N.
culturutus constitute a well-defined group.Microtus
The UPGMA phenogram in Figure 2C illustrates that populations of
M.
kikuchii form two major clusters. One includes the populations from Transects 1 and 2, and the other consists of those from Transect 3, indicating that
populations in Transect 3 (Mt. Guanshan) are somewhat genetically distinct from the others (Mt. Yushan). Besides, Korean M. fortis is phenetically more similar to North American
M.
californicus than to Taiwanese M. kikuchii.DISCUSSION
Phylogeny and biogeogruphy
Much light has been shed on the evolutionary history of the mammals in southeastern Asia by examining their patterns of endemism, species diversity,
(A) Apodemus semotus agrarius (Taiwan) agrariw (continent) -7 0.30 0.20 0.05 0.00 Niviventer c coxingi bukit I 1 0.42 0.20 0.05 0.00 T1-3220 m T1-36SOm T2-3240 m T2-3670 m (C) Microtur kikwhii T3-3OOO m T3-3300 m fortis californicw 1 1 I I 0.30 0.20 0.10 0.00
Rogers' (1972) gcnetic distance
Figure 2. UPGMA dendrogram of affinity among species and populations in three genera of rodents from Taiwan as measured by Rogers' (1972) genetic distance: (A) Apodemus, (B)
Niviventer, and (C) Microtus. The coefficient of cophenetic correlation (rcc) are 1.00, 0.99 and 0.97 for each genus.
80 (A) Apodemus HON-TSEN YU s e m m 7 T1-high; .______._.. 4 1
:
agrarius Taiwan c 'I
agrarius continent n-middle ~ T3-middld (B) Niviventer culruratus-
T1-low j ___.____________.._., coxingi bukit T2-lowi
T3-low;
-
T3-high j ...Figure 3. Fifty percent majority-rule consensus tree showing phylogenetic relationships among species and populations in two genera of rodents from Taiwan based on allozyme data: (A) Apodernus and (B) Niviventer. Trees are drawn in proportion to branch length and rooted at
the mid-point assuming that rates of evolution in all congeneric lineages are equal (also see Discussion). The solid circles signify internal nodes that were supported by at least 90% of
100 bootstrap replicates (Felsenstein, 1985).
Rickart, 1990). However, by employing allozyme data to analyse two genera of rodents (Apodemus and Niviventer), this study offers another perspective which emphasizes the patterns of phylogenetic relationship among species and populations to infer their evolutionary history. The approach does not presume either parapatric or allopatric divergence but, instead, acknowledges both as possible processes. The results of the phylogenetic analysis can be used to critically test specific hypotheses concerning evolutionary history of rodents in Taiwan (Fig. 1).
The phylogenetic analyses of the congeners in Apodemus and Niviventer falsify the hypothesis of a single incursion of each genus from the Asian continent to Taiwan with subsequent divergence. A multiple-incursion colonizing hypothesis better explains the modern distribution of these genera in Taiwan. However, the results of parsimony analysis are contingent on the assumption that rates of evolution in all lineages within a genus are equal. While this assumption may be valid for congeneric species, in the future it is imperative to test whether or not the rates of evolution among all congeneric species are indeed equal, preferably by analysing some DNA sequences. Kano (1940), studying faunistic affinities, argued that the vertebrate
fauna in Taiwan consists of-disregarding cosmopolitan species-two major components from two separate zoogeographical regions, the Oriental and Palaearctic (Cox & Moore, 1985). The Oriental component is predominant
in the lowlands whereas the Palaearctic component occurs mostly in the highlands. It was therefore postulated (Kano, 1940) that the Palaearctic (cold- adapted) group came to Taiwan during the climax of glaciation and only found suitable habitats in the highlands when the glaciers receded. Meanwhile the lowlands had been recolonized by the Oriental (warm-adapted) group following the retreating glaciers before the land bridge was submerged. Although the argument may still be appropriate for the origin of some Taiwanese mammals, it has shortcomings. On one hand, the taxonomy by which Kano derived faunistic affinities was rudimentary and is now considered obsolete. Many discoveries about the fauna in this general region can be profound compared to what was known, when precise and modern approaches are employed, as shown in the Philippines (Musser & Heaney, 1992). A thorough taxonomic revision of mammals of Taiwan and Southeast Asia is needed in order to reassess faunistic affinities. On the other hand, for some groups of animals (e.g. Apodemus and Niviventer) the demarcation of zoogeographic boundaries is potentially obscure and difficult. Mice of the genus Apodemus are non-commensal murine rodents which occur almost exclusively in the Palaeartic region (Corbet, 1978; Wilson & Reeder, 1993), and yet two Taiwanese species occupy the lowlands and highlands. In
contrast, rats of the genus Niviventer occur widely across both the Palaeartic and Oriental regions (Musser, 1981; Wilson & Reeder, 1993) and at present it is impossible to determine the zoogeographic origins of individual species. Circumventing such shortcomings, phylogenetic analyses as I have done here for Taiwanese rodents can be implemented on specific groups of animals which are widely distributed in southeast Asia. Such analyses will provide insight to the evolutionary history of animals in this area.
In particular, rats of Niviventer occupy all major continental islands in Southeast Asia (notably Hainan, Borneo, Java and Sumatra) and the Asian continent (Musser, 1981; Wilson & Reeder, 1993). There are at least two species of Niuiuenter occurring on each of those islands and they have parapatric elevational distributions similar to those of their Taiwanese counterparts. Moreover, these islands share a similar recent geological history to Taiwan’s, having been repeatedly connected to the continent during the Pleistocene. It will therefore be worthwhile to include all the species of Niviventer in rigorous phylogenetic analyses to elucidate their evolutionary history in Southeast Asia and to determine whether similar biogeographic patterns occur throughout the range of the genus.
Genetic variation and environmental heterogeneity
The levels of genetic differentiation in the three species of small mammals analysed here are related to two distinct patterns of their elevational distribution. The murines A. semotus and N. culturatus have wider elevational distribution and relatively low intraspecific genic variability compared to M.
kikuchii (Table I), which is restricted to mountaintops normally above 3000 m (Yu, 1992, 1994). For the two murine rodents, moreover, the genetic distances among samples representing populations from different elevations and drainages were low (Table 2) and these samples therefore clustered shallowly at the tips of their UPGMA dendrograms (Fig. 2A,B). Conversely,
82 HON-TSEN YU
for M. kikuchii, its average interpopulational Nei’s genetic distances (0.054) was approximately 4-6 fold greater than those of
A.
semotus (0.012) and N.culturutus (0.008). Furthermore, genetic differentiation as measured by
fiT
among populations ofM.
kikuchii was about 3.8 and 3.1 times greater thanthat of A. semotus and N . culturutus, respectively (Table 3). The UPGMA dendrogram (Fig. 2C) on
M.
kikuchii shows that samples from the adjacent Transect 1 and Transect 2, constitute a distinct cluster whereas those from the more distant Transect 3 form another (see maps in Yu 1992 & 1994).In other words, while populations of A. semotus and N. culturutus do not show much differentiation, populations of M. kikuchii from two mountaintops (Mt. Yushan and Mt. Guanshan) are well differentiated genetically, probably because of physical isolation.
For the two elevationally widespread species, it is noteworthy that allozyme variation as measured by mean heterozygosity,
A.
semotus (0.017) and N .culturutus (0.0 lo), is relatively low compared to other mammals (Gillespie, 1991; Nevo et ul., 1984) and no genetic discontinuity or cline in allele frequency were associated with elevation (Appendix 2). Yet, the habitat heterogeneity represented by over 2200 m of elevational change in Taiwan and the potential selection forces associated with this change remain impressive. For instance, along this gradient, mean annual temperature drops from 19 to 4°C and atmospheric pressure decreases from 89 to 64% of that at sea level (Yu, 1992, 1994). Few cases of protein polymorphism have been demonstrated to have differential effects on the level of physiology in such a way as to influence Darwinian fitness of the whole organism (see review by Gillespie, 1991). A study of polymorphism in haemoglobin in A. semotus
and N. culturutus may well prove worthwhile in light of the protein’s adaptive significance for animal’s capability to coping with hypoxia at high elevation as shown in Peromyscus municulutus of North America (Chappell & Snyder,
1984).
Although
M.
kikuchii is confined to small areas on mountaintops, no strong evidence of inbreeding is found (& no different from 0) and its genic variation is higher than that of A . semotus andN.
culturutus. Perhaps the genic variation in M. kikuchii is maintained by some selection forces associated with the environmental fluctuations (e.g. monthly temperature) at high elevation. Besides, the mating system in this vole may play a role in promoting the variation.Gene flow (Table 4) among subpopulations for A. semotus and N. culturutus
is substantial, 3.867 and 5.604 by the ‘private’ alleles method, respectively. By the same estimating method, the highest gene flow in mammals listed by Slatkin (1985) was 2.20 for Peromyscus culfornicus and that listed by Patton & Smith (1990) was 2.94 for Romomys bottue. Therefore, the potential isolating effect imposed by the deep river valleys separating the transects appears minimal for these two species. The high gene flow in A. semotus and N. culturutus might be enough to swamp out local differentiation or cline (if any) within the sharp elevational gradient that is occupied by them. Conversely, gene flow between populations of
M.
kikuchii on different mountaintops is quite low ( < 1) but not completely terminated by the physical and/or habitat isolation. Perhaps downward migration of M. kikuchii during the dry (also cold) season to lower elevation (Yu, 1992, 1994) has facilitated83
gene exchange between populations from various mountaintops through the lower portion of the valleys. The low gene flow in M. kikuchii appears to promote genetic differentiation among its subpopulations. Likewise in the Philippines (Peterson & Heaney, 1993), bats of the genus Haplonycteris having low gene flow
(Nm
= 0.05) show more population differentiation than the genus of Cynopterus, which have higher gene flow(Nm
= 7.5).ACKNOWLEDGEMENTS
I
owe thanks toJ. L.
Patton, C. Patton, 0. P. Pearson, W. P. Sousa, J. G. Groth,M. F.
Smith, D. A. Good, H. Carson, M. Long and B. D. Patterson for critically reviewing various drafts of this manuscript.D.
A. Good and G . Roderick helped in phylogenetic analysis. Two reviewers' comments and suggestions much improved the manuscript. Y. S. Lin, C.M.
Kuo and
L.
L. Lee kindly assisted in obtaining financial support for my field work. I am obliged to Y. S. Lin who provided a home base while I was doing field work in Taiwan.I
also thank all the people who assisted me with the field work.I
particularly appreciate their undampened spirit to slog with me along those steep muddy slopes in heavy rain. The field work was funded by the Yushan National Park of Taiwan, Republic of China.I
was supported by the Museum of Vertebrate Zoology and the Department of Integrative Biology, University of California at Berkeley during my stay in Berkeley. This study served as partial fulfillment for a PhD degree in Zoology from the University of California at Berkeley. A special thanks is given to J.L.
Patton for tremendous support. Finally,I
want to thank Yu-Lan Chien;I
could not have finished my study without her help.REFERENCES
Baker AEM. 1981. Gene flow in house mice: introduction of a new allele into free-living populations.
Evolution 35(2): 243-258.
Bowen B. 1982. Temporal dynamics of microgeographic structure of genetic variation in Microtus
californicus. Journal of Mammalogy 63: 625-638.
Busack SD. 1986. Biogeographic analysis of the herpetofauna separated by the formation of the Strait of Gibraltar. National Geographic Research 2( 1): 17-36.
Buth DG. 1984. The application of electrophoretic data in systematic studies. Annual Review of Ecology
and Systematics 15: 501-522.
CadleJE, PattonJL. 1988. Distribution patterns of some amphibians, reptiles, and mammals of the eastern Andean slope of southern Peru. In: Vanzolini PE, Heyer WR, eds. Worhhop on dktributiom
of Neotropical organisms, Academia Brasileira de Ciencias, KO de Janeiro, Brazil, 221-240.
Chappell, MA, Snyder LRG. 1984. Biochemical and physiological correlates of deer mouse m-chain hemoglobin polymorphisms. Proceedings of National Academy of Science, USA 81: 5484-5488.
Corbet GB. 1978. f i e mammals of the Palaeartic region: a taxonomic review. London and Ithaca, N.Y.: British Museum (Natural History) and Cornell University Press.
Cox CB, Moore F'D. 1985. Biogeography-An ecological and evolutionary approach. 4th ed. Oxford: Blackwell Scientific Publications, 155-160.
Endler JA. 1977. Geographic variation, speciation, and clines. Princeton University Press.
Endler JA. 1982a. Pleistocene forest refuges: fact or fancy? In Prance GT, ed. Biological diversifcation Endler JA. 1982b. Problems in distinguishing historical from ecological factors in biogeography. American
Fairbanks RG. 1989. A 17,000-year glacio-eustatic sea level record: influence of glacial melting rates Felsenstein J. 1985. Confidence limits on phylogenities: an approach using the bootstrap. Evolution
in the Tropics. New York Columbia University Press, 641-657. ZOOh@t 22: 441-452.
on the Younger Dryas event and deep-ocean circulation. Nature 342: 637-642. 39(4): 783-791.
84 HON-TSEN YU
Gaocoyne M, Benjamin GJ, Schwarcz HP. 1979. Sea-level lowering during the Illinoian Glaciation: Gdespie
JH.
1991. The causes of molecular evolution. New York: Oxford University Press. Chaper 1. Harris H, Hopkinson DA. 1976. Handbook of enzyme electrophoresis in human genetics. Amsterdam: North Heaney LR. 1984. Mammalian species richness on islands on the Sunda Shelf, Southeast Asia. Oecolugia Heaney LR. 1986. Biogeography of mammals in SE Asia: Estimates of rates of colonization, extinctionand speciation. Biological Journal of Linnean Society 28: 127-165.
Heaney LR, Rickart EA. 1990. Correlations of clades and clines: Geographic, elevational, and phylogenetic distribution patterns among Philippine mammals. In: Peters G, Hutterer R, eds.
Vertebrates in the Tropics. Bonn, Germany: Museum Alexander Koenig, 321-332.
Hedrlck, PW, Ginevan, ME, Ewing EP. 1976. Genetic polymorphism in heterogeneous environments. Annual Review of Ecology and Systematics 7: 1-32.
Hedrick PW. 1986. Genetic polymorphism in heterogeneous environments: a decade later. Annual Review of Ecology and Systematics 17: 535-566.
Hsu V. 1990. Seismicity and tectonics of a continent-island arc collision zone at the island of Taiwan. Journal of Geophysical Research 95(B4): 4725-4734.
Huang J. 1984. Change of sea-level since the late Pleistocene in China. In: Whyte RO, ed. The evolution of the east Asian environment. University of Hong Kong: Center of Asian Studies.
Kano T. 1940. Zoogeographic studies of the Tsugitaka mountains of Formosa. Tokyo, Japan: Institute for Ethnogeographical Researches.
Liu D, Ding M. 1984. The characteristics and evolution of the paleoenvironment of China since the late Tertiary. In: Whyte RO, ed. The evolution of the east Asian environment. Center of Asian Studies, University of Hong Kong, 11-40.
Mabee F‘M, Humphries J. 1993. Coding polymorphic data: Examples from allozymes and ontogeny. Systematic Biology 42(2): 166-181.
Musser GG. 1981. Results of the Archbold expeditions. No. 105. Notes on systematics of Indo-Malayan murid rodents, and descriptions of new genera and species from Ceylon, Sulawesi, and the Philippines. Bulletin of the American Museum of Natural History 168: 229-334.
Musser, GG, Heaney LR. 1992. A review of the Philippine Muridae. Bulletin of the American Museum
of Natural History 211: 1-138.
Nei M. 1977. F-statistics and analysis of gene diversity in subdivided populations. Annals of Human Genetics, London 41: 225-233.
Nei M. 1978. Estimation of average heterozygosity and genetic distance from a small number of individuals. Genetics 89: 583-590.
Nevo E, Beiles A, Ben-Shlomo R 1984. The evolutionary significance of genetic diversity: ecological, demographic and life history correlates. In: Mani GS, ed. Evolutionary dynamics of genetic diversity. Berlin: Springer-Verlag, 13-2 13.
PattonJL, Smith MF. 1990. The evolutionary dynamics of the pocket gopher Thomomys bottae, with emphasis on California populations. University of California Publications in Zoology, Vol. 723.
Patton JL, Smith MF. 1992. MTDNA phylogeny of Andean mice: a test of diversification across ecological gradients. Evolution 46( 1): 174-183.
Patton JL, Yang SY. 1977. Genetic variation in Thomomys bottae pocket gophers: macro-geographic patterns. Evolution 31: 697-720.
PattonJL, Myers P, Smith MF. 1990. Vicariant versus gradient models of diversification: The small mammal fauna of eastern Andean slopes of Peru. In: Peters G, Hutterer R, eds Vertebrates in the
Tr@ics. Bonn, Germany: Museum Alexander Koenig, 355-371.
Peterson AT, Heaney LR. 1993. Genetic differentiation in Philippine bats of the genera Cynopterus and Haplonycteris. Biological Journal of Linnean Society 49: 203-218.
Rogers JS. 1972. Measures of genetic similarity and genetic distance. University of Texas Publication. Studies in Genetics WJ 7213: 145-153.
Schnell GD, Selander RK. 1981. Environmental and morphological correlates of genetic variation in mammals. In: Smith MH, Toule T, eds. Mammalian population genetics. Athens: University of Georgia Press, 66-90.
Selander RK, Smith MH, Yang SY, Johnson WE, Gentry WB. 1971. Biochemical polymorphism and systematics in the genus Peromysm. I. Variation in the old-field mouse (Peromysm polionotus).
University of Texas Publications, Studies in Genetics W, 7103: 49-90.
Evidence from a Bahama “blue hole”. Science 205: 806-808.
Protein evolution, pp. 3-63. Holland.
61: 11-17.
Slatkin M. 1985. Rare alleles as indicators of gene flow. Evolution 39: 53-65.
Smith MF, Patton JL. 1980. Relationships of pocket gopher (Thomomys bottae) populations of the lower Colorado river. Journal of Mammalogy 61(4): 681-696.
Smith MF, PattonJL, Haher JC, Hafner DJ. 1983. Thomomys bottae pocket gophers of the central Rio Grande valley, New Mexico: local differentiation, gene flow, and historical biogeography.
85 Sneath PHA, Sokd RR. 1973. Numerical taxonomy. San Francisco: W. H. Freeman.
Swofford DL. 1991. P A m Phylogenetic analysis using parsimony. Version 3.0s. Computer program Swofford DL, Selander RB. 1981. BIOSYS-1: a fortran program for the comprehensive analysis of Wilson DE, Reeder DM, (eds) 1993. Mammal species
of
the world. Second edition. Washington and Workman PL, NiswanderJD. 1970. Population studies on southwestern Indian tribes. 11. Local genetic Wright S. 1943. Isolation by distance. Genetics 28: 114-138.Wright S. 1965. The interpretation of population structure by F-statistics with special regard to systems Wright S. 1978. Evolution and genetics of populations, Vol. 4. Variability within and among natural populations.
Yu HT. 1992. An elevational tramect study of the distribution of small mammah in Taiwan. PhD Dissertation,
Yu HT. 1994. Distribution and abundance of small mammals along a subtropical elevational gradient distributed by the Illinois Natural History Survey, Champaign, Illinois.
electrophoretic data in population genetics and systematics. Journal of Heredity 72: 543-555.
London: Smithsonian Institution Press.
differentiation in the Papago. American Journal of Human Genetics 22: 24-49.
of mating. Evolution 19: 395-420.
Chicago, Illinois: University of Chicago Press. University of California at Berkeley, USA.
in central Taiwan. Journal offoology, London: 577-600.
APPENDIX 1 Specimm examined
Taxa, localities, and museum numbers of vouchers for all specimens from which tissue was taken for electrophoretic analysis are as follows (all the specimens are deposited in the Museum of Vertebrate Zoology (MVZ)):
Apodemus semotus
(1) Transect 1. Taiwan: Nantou Co.; Sha-Li-Xian trail, Xin-Yi Township, 2000 m (MVZ180183, 180184, 180159-180176), Sha-L-Xian trail, Xin-Yi Township, 2400 m (MVZ180208-180215, 180217- 180219, 180223-180226, 180228-180232); Chiayi Co.; 3 km up from Pai-Yun Hostel on trail to Yun- Feng campsite, Alishan Township, 3650 m (MVZ180451, 180458, 180479-180487, 180490-180492).
(2) Transect 2. Taiwan: Nantou Co.; Le-Le hut, 5.5 km Ba-Tong-Guan historical trail, Xin-Yi Township, 1560 m (MVZ180076-180095), 12.8 km Ba-Tong-Guan historical trail, Xin-Yi Township, 2300 m (MVZ180371-180380, 180394-180396, 180398, 180400-18040 1, 180403, 180405- 180407), 1.5 km
up from Lao-Nong-Xi campsite, Xin-Yi Township, 3670 m (MVZ180431-180437, 180442-180447). (3) Transect 3. Taiwan: Kaohsiung Co.; 131.6 km southern cross-island highway, Tao-Yuan Township, 1980 m (MVZ180185-180197), 143.4 km southern cross-island highway, Tao-Yuan Township, 2600 m (MVZ180258-180264, 180287-180298, 180319). On trail to Gum-Shan, Tao-Yuan Township, 3300 m (MVZ180495-180498, 1805 19-18052 1, 180529).
Apodemus agrarius 180534).
Collection 5213-5215 in MVZ).
(1) Taiwan: Grassland behind Taichung Veteran Hospital, Taichung city, 150 m (MVZ180533, (2) Continent: Yugoslavia; Cornfield, 5 km N. 3 km E. Sremska Mitrovica, Serbia (Frozen-tissue
Niviventer culturatus
(1) Transect 1. Taiwan: Nantou Co.; Sha-Li-Xian trail, Xin-Yi Township, 2400 m (MVZ180543, 180549, 180550, 180552, 180556, 180557, 180612, 180613, 180617, 180618, 180627, 180630); Chiayi Co.; 2 km down from Pai-Yun Hostel on trail to Ta-Ta-Jia saddle, Alishan Township, 3220 m (2) Transect 2. Taiwan: Nantou Co.; Dui-Guan, 10.2 km Ba-Tong-Guan historical trail, Xin-Yi Township, 1980 m (MVZl80568, 180571, 180573, 180577, 180580, 180583, 180586, 180589, 180592, 180595, 180598, 180601), 1 km down from Lao-Nong-Xi campsite, Xin-Yi Township, 3240 m (MVZ180692-180695, 180698-180701), 1.5 km up from Lao-Nong-Xi campsite, Xin-Yi Township, 3670 m (180691, 180696, 180697).
(3) Transect 3. Taiwan: Kaohsiung Co.; 135.3 km southern cross-island highway, 2280 m (MVZ180632- 180638, 180640, 180650, 180651, 180664-180666). On trail to Guan-Shan, Tao-Yuan Township, 3000 m (MVZ180709, 180711, 180713, 180715, 180717, 180719, 180721). On trail to Guan-Shan, Tao-Yuan Township, 3300 m (MVZ180708, 180722-180725).
86 HON-TSEN YU
Niuiuenter coxingi
Taiwan: Nantou Co.; Le-Le hut, 5.5 km Ba-Tong-Guan historical trail, 1560 m (MVZ180740); Kaohsiung Co., 131.6 !an southern cross-island highway, Tao-Yuan Township, 1980 m (MVZ180735- 180739).
Niuiuenter bukit
MVZ) China: Yunnan Prov., vicinity of Menlung, near Laotian border (Frozen-tissue Collection 5459-5460, .
Microtus kikuchii
(1) Transect 1. Taiwan: Chiayi Co.; 2 km down from Pai-Yun Hostel on trail to Ta-Ta-Jia saddle, Alishan Township, 3220 m (MVZ180746, 180747, 180750, 180751, 180754, 180755, 180722, 180773, 180790, 180791, 180843, 180844, 180847, 180848, 180853, 180854, 180858, 180859, 180862, 180863), 3 km up from Pai-Yun Hostel on trail to Yun-Feng campsite, Alishan Township, 3650 m (MVZ180757, 180758, 180761, 180762, 180766, 180769, 180770, 180776, 180777, 180781, 180782, 180786, 180787, 180793, 180794, 180841, 180842, 180851, 180852, 180857).
(2) Transect 2. Taiwan: Nantou Co.; 1 km down from Lao-Nong-Xi campsite, Xin-Yi Township, 3240 m (MVZ180825-180831, 180834-180840), 1.5 !an up from Lao-Nong-Xi campsite, 3670 m (MVZ180822-180824, 180832, 180833).
(3) Transect 3. Taiwan: Kaohsiung Co.; On trail to Gum-Shan, Tao-Yuan Township, 3000 m (MVZ180871-180875, 180877, 180879-180881); On trail to Guan-Shan, 3300 m (MVZ180867-180870, 180882- 180887).
Microtus fortis
Korea: Kyung Gi Do, Dong Duchun (MVZ148428, 148429).
Microtus californicus
APPENDIX 2
87
Allelic frequencies of rodent populations from Yushan National Park, Taiwan. Sample sizes and related information on each population are available in Table 1.
(a) Allelic frequencies for 13 polymo hic loci in nine populations of Apodemus semotus, and in samples of A. u g r u ~ u r ~ M ) from Taiwan and from the continent
Locus Populations of semotus and allele 1 2 3 4 5 6 7 8 9 AA from Taiwan Me-2 Ldh- 7 Icd- 7 NP Gpi GPd Gd Sod- 7 Acon- 7 pem 6-Pgd La- 7 pap a 1.00 1.00 1.00 1.00 0.95 1.00 1.00 0.97 1.00 b 0.05 0.03 a 0.03 0.03 0.03 0.08 0.04 0.03 0.06 b 0.97 0.97 1.00 1.00 0.97 0.92 0.96 0.97 0.94 a b 0.08 c 1.00 1.00 1.00 1.00 1.00 1.00 1.00 0.92 1.00 a b 0.12 0.10 0.08 0.05 0.04 0.08 0.30 c 0.88 0.90 1.00 0.92 0.95 0.96 0.92 0.70 1.00 a b 1.00 1.00 1.00 1.00 0.97 1.00 1.00 0.97 1.00 C 0.03 0.03 a b 0.03 0.10 c 1.00 0.95 0.97 0.90 1.00 1.00 1.00 1.00 1.00 d 0.05 a 1.00 1.00 1.00 1.00 1.00 1.00 1.00 1.00 1.00 b a b 0.03 0.03 0.03 c 0.97 0.97 1.00 1.00 0.97 1.00 1.00 1.00 1.00 a 1.00 0.97 0.97 1.00 0.97 1.00 0.92 0.97 0.94 b 0.03 0.03 0.03 0.08 0.03 0.06 a 0.05 0.05 0.05 b 0.95 1.00 0.97 1.00 0.95 1.00 1.00 0.95 1.00 C 0.03 a 0.04 0.08 b 1.00 0.97 1.00 0.97 0.92 0.96 0.88 0.97 1.00 C 0.03 0.03 0.08 0.04 0.03 a 1.00 1.00 1.00 1.00 1.00 1.00 1.00 1.00 1.00 b a b 1.00 1.00 1.00 1.00 1.00 1.00 1.00 1.00 1.00 C 1.00 1 .oo 1
.oo
1.oo
0.25 0.75 0.25 0.75 1.oo
1.00 1.oo
1.oo
1.oo
1 .oo 1.00 AA from continent 1.oo
1.00 0.33 0.67 0.50 0.50 1.oo
1.oo
1.oo
1.00 1.00 1.oo
1.00 0.67 0.33 1.oo
88 HON-TSEN W Appendix 2-continued
culturutus, and samples of N . coxingi (NC) and N . bukit (NB)
(b) Allelic frequencies for 14 polymorphic loci in six populations of Niviventer
Locus and allele Me- 7 Me-2 Sordh Icd- 1 Got-2 NP Gpi GPd Sod- 7 Acon- 7 pgm 6-Pgd Alb La- 7 ~ a b d a b C C a b a b a b a b a b a 6 a b C C C a b C a b a b a b a b C 1 0.04 0.96 1
.oo
1.oo
1 .oo 1 .oo 0.17 0.83 1.oo
1.oo
1.oo
1.oo
1.oo
1.oo
0.92 0.08 1.oo
Populations of nrlturatus 2 3 4 5 6 NC NB 1.00 1.00 1.00 1.00 1.00 1.00 1.00 1.00 1.00 0.96 0.04 1.00 1.00 1.00 1.00 1.00 1.00 1.00 1.00 1.00 1.00 1.00 1.00 1.00 1.00 1.00 0.17 0.23 0.04 0.04 1.00 0.83 0.77 0.96 0.96 1.00 1.00 1.00 1.00 1.00 0.04 1.00 1.00 1.00 1.00 0.96 1.00 1.00 1.00 1.00 1.00 1.00 1.00 1.00 1.00 1.00 1.00 1.00 1.00 1.00 1.00 0.08 1.00 1.00 1.00 1.00 0.92 1.00 1.00 1.00 1.00 1.00 0.04 1.00 1.00 0.96 1.00 1.00 1 .oo 1.00 1.00 1.00 1.00 1.00 1 .oo 0.33 0.67 0.25 0.75 1 .oo 1.oo
1.00 1 .oo 1 .oo 1 .oo 1 .oo 1 .oo 1 .oo 1.00 1.00 1.00 1.00 1.00 1.oo
1 .oo 1.00 1 .oo 1 .ooAppendix 2 - continued
(c) Allelic frequencies for 14 polymorphic loci in six populations of Microtus kikuchii and in samples of M. fortis (MF) and M. californicus (MC)
89 Locus and allele Me- 7 Me-2 sordh Icd- 7 Icd-2 Got- 7 Got-.? NP Gpi Sod- 7 Acon- 7