國立交通大學
光電工程研究所
碩士學位論文
超大異常色散被動鎖模掺鉺光纖雷射
之研究
Study of a Passive Mode-Locked
Erbium Doped Fiber Laser with Large
Abnormal Dispersion
研究生:黃柏崴
指導教授:賴暎杰
Study of a Passive Mode-Locked Erbium Doped Fiber Laser
with Large Abnormal Dispersion
研 究 生:黃柏崴 Student:Bo-wei Huang
指導教授:賴暎杰 老師 Advisor:Yin-Chieh Lai
國 立 交 通 大 學
光 電 工 程 研 究 所
碩 士 論 文
A ThesisSubmitted to Institute of Electronics College of Engineering National Chiao Tung University
in partial Fulfillment of the Requirements for the Degree of
Master
In Electro-Optical Engineering
June 2010
Hsinchu, Taiwan, Republic of China
i
摘 要
論文名稱:超大異常色散被動鎖模掺鉺光纖雷射之研究 校所別:國立交通大學光電工程研究所 頁數:1 頁 畢業時間:九十九學年度第二學期 學位:碩士 研究生:黃柏崴 指導教授:賴暎杰 老師 在本論文中,我們利用偏振疊加波鎖模原理架設超大異常色散的鎖模光纖 雷射,其共振腔長達 400 公尺,可產生 500KHz 超低重複率的鎖模脈衝。此雷 射隨著調整激發雷射功率強度和偏振控制器角度可產生不同形式之脈衝,在實驗 上我們觀察到當激發雷射功率較低時,隨著偏振控制器角度的不同可得到穩定 Q 開關鎖模脈衝或者是多個光固子的脈衝序列。當激發功率強度上升到一定程度則 會得到穩定的鎖模脈衝雷射輸出,這時調整偏振控制器角度可得到不同形狀的脈 衝形狀,其中較為特別的為方波輸出。最後透過腔外脈寬壓縮我們可以利用此雷 射的超低重複率來產生超高峰值功率的脈衝。ii
ABSTRACT
Title:Study of a Passive Mode-Locked Erbium Doped Fiber Laser with Large Abnormal Dispersion
Pages:1 Page
School:National Chiao Tung University
Department:Institute of Electro-Optical Engineering
Time:June, 2010 Degree:Master
Researcher:
Bo-wei Huang
Advisor:Prof. Yin-Chieh LaiIn this thesis, we study the characteristics of a passive mode-locked Er-fiber laser with over 400m single mode fibers inside the cavity to achieve a low pulse repetition rate of 500 kHz. The laser can generate different pulse shapes by adjusting the polarization controllers (PCs) and the pump power, Stable Q-switched mode-locked (QML) pulses or modelocked soliton pulses can be generated after properly rotating the angles of the polarization controllers (PCs) in the low pump power. When the pump power is increased, the mode-locking operation can be observed. Then by adjusting the angles of the polarization controllers different shapes of pulse trains can be generated. Finally, through external pulse compression we utilize this laser to produced high peak power pulse trains with low repetition rates.
iii
ACKNOWLEDGEMENT
在交大兩年的碩士生涯裡,首先要特別對我的指導教授 賴暎杰老師在研究的 過程中不斷的給予支持與耐心的指導表達敬意與感謝之意,老師總是不厭其煩地 解答我的疑惑,從賴老師身上學到的不只是知識上的收穫,還有在求學與研究時 應有的態度。 感謝林家弘學長和鞠曉山學長在實驗上不斷的幫助和指導,使我能順利完成 實驗。還要感謝項維巍學長、徐桂珠學姊、郭立強學長、許宜蘘學姊、池昱勳 學長、劉秀鳳學姊、鐘佩芳學姊和顏子祥學長,在實驗和課業上給予我的協 助。另外,感謝在課業上一起學習、一起分享校園生活點滴的朋友們,柏萱、 家豪、姿媛、力行、聖閔,感謝大家讓我的研究生活充滿歡笑。 最後,感謝在生活上幫我分憂解勞的敏甄,還有總是支持我的父母家人和朋友 們,謝謝大家。iv
CONTENTS
ABSTRACT( in Chinese) ... i
ABSTRACT (in English) ... ii
ACKNOWLEDGEMENT ... iii
CONTENTS ... iv
LIST OF FIGURES ... vi
Chapter 1:Introduction ... 1.1 Review of Er-doped fiber laser ... 1
1.2 Mode-locked pulse generation ... 3
1.3 Q-switched mode-locked pulse generation ... 4
1.3 Motivation ... 5
1.4 Structure of the thesis ... 7
References ... 8
Chapter 2:Principles ... 2.1 Nonlinear Polarization Rotation ... 11
2.2 Self- Phase Modulation ... 14
2.3 High Order Dispersion ... 16
2.4 Dispersion Compensation ... 17
2.5 Saturation of additive pulse mode-locking ... 18
2.6 Theory of Q-switching ... 20
Chapter 3:Experiment results ... 3.1 Q-switched mode-locked pulse genration ... 26
3.1-1 Experimental setup... 26
v
3.2 Mode-locked pulse genration ... 39
3.2-1 Experimental setup... 39
3.2-2 Results and discussions ... 40
3.3 Soliton pulses ... 49
3.3-1 Results and discussions ... 49
References ... 54
Chapter 4:Conclusions ... 4.1 Conclusions ... 55
vi
List OF FIGURES
Fig.1.1 The first all-fiber ring cavity to produce stable subpicosecond
pulse.. ... 2
Fig.2.1 Structure of nonlinear polarization rotation. ... 12
Fig.2.2 Mechanism of P-APM ... 13
Fig.2.3 The loss modulation, population inversion and the pulse generation of Q-switch lasers [2.9] ... 20
Fig.2.4 The geometrical setup and the detailed process of pulse formation in the time domain for a Q-switched laser [2.10] ... 21
Fig. 3.1 Schematic diagram of the Er-fiber laser ... 26
Fig. 3.2 Time trace of QML pulse trains ... 28
Fig. 3.3 Expanded single QML envelope, Inset shows the time trace of a single mode-locked pulse ... 28
Fig.3.4 RF spectrum with three pulses ... 29
Fig.3.5 Expanded single QML RF spectrum. ... 29
Fig.3.6 Optical spectrum of QML pulses (Center on 1602) ... 30
Fig. 3.7 (a) Time trace of QML pulse trains and (b) corresponding optical spectrum at 131 mW pump power ... 31
Fig.3.8 Width of Q-switched envelope at different pumping power ... 32
Fig.3.9 Evolution of optical spectrum at different pumping power ... 33
Fig.3.10 Simulation results of the optical spectrum ... 34
Fig.3.11 Optical spectrum of QML pulses (Center on 1586nm) ... 35
Fig.3.12 Optical spectrum of QML after filter (up curve is original spectrum) (middle remain) ... 36 Fig.3.13 Optical spectrum of QML after filter (up curve is original spectrum)
vii
(left edge remain). ... 36
Fig.3.14 Optical spectrum of QML after filter (up curve is original spectrum) (right edge remain) ... 37
Fig.3.15 Expanded single QML envelope (middle remain) ... 37
Fig.3.16 Expanded single QML envelope (left edge remain) ... 38
Fig.3.17 Expanded single QML envelope (right edge remain) ... 38
Fig.3.18 Schematic diagram of the Er-fiber laser ... 39
Fig.3.19 Time trace of pulse train ... 41
Fig.3.20 RF spectrum of pulse train ... 41
Fig.3.21Expanded time trace ... 42
Fig.3.22 Optical spectrum ... 43
Fig.3.23 Cavity transmission at [3.4] ... 44
Fig.3.24 Expanded single square-shaped pulse trace ... 45
Fig.3.25 Optical spectrum of square-shaped pulses ... 46
Fig.3.26 Schematic diagram ... 47
Fig.3.27 autocorrelation trace of the compressed pulse ... 48
Fig.3.28 Optical spectrum after compression ... 48
Fig.3.29 Time traces of soliton pulses ... 49
Fig.3.30 Expanded time traces of two soliton pulses ... 50
Fig.3.31 Optical spectrum of soliton pulses (for two pulses) ... 50
Fig.3.32 Oscilloscope recording of soliton pulses ... 52
Fig.3.33 Expanded time traces of soliton pulses per round trip ... 52
Fig.3.34 Optical spectrum of soliton pulses ... 53
Fig.3.35 Number of soliton pulses at different pumping power ... 53
1
Chapter 1
Introduction
1.1 Review of Er-doped fiber laser
Mode-locked fiber lasers have been extensively investigated in the past two decades both experimentally and theoretically [1.1]. Due to the advantages of low cost, compact volume, reliable turnkey operation, better quality (almost transform-limited short pulses compared to those from laser diodes) and long-term stabilization, mode-locked fiber lasers offer attractive alternatives of pulse laser sources when compared to the expensive and bulky solid state mode-locked lasers [1.2].
Fiber-type devices also have the advantages such as lower fiber coupling loss, simplicity for manufacturing by splicing as well as significant nonlinear effects due to small core area and long interaction length. Due to the high efficiency of the Nd ion as a laser gain medium, early fiber laser works were focused on Nd-doped silica fiber lasers operating at 106 mm. Doping of silica fibers with Er ions was not achieved until the 1980s, when Mears et al generated the first Erbium-Doped fiber Laser[1.3][1.4]. The 1.5μm Er-doped fiber lasers started to receive a lot of attention due to their potential for the applications in optical fiber communication. This is because the gain spectrum of erbium-doped fiber just falls within the lower loss window of silica glass fiber. The success in the development of mode-locked Er-fiber lasers can be attributed to the following advantageous properties: the realization of erbium-doped fiber amplifier (EDFA) that can be pumped in the convenient pumping bands around 980 nm and 1480 nm[1.5], the invention of artificial fast saturable absorber based on polarization additive pulse mode-locking
2
(P-APM)[1.6-1.8]. The ability to tailor the sign and value of group dispersion velocity (GVD) of single mode fibers in the wavelength around 1.55μm, and the implementation of all-fiber passive and active optical devices.
As the same as other mode-locked lasers, Er-fiber lasers can be mode-locked actively, where a modulator produces amplitude or phase modulation, or passively, where some form of optical nonlinearity is utilized to modulate the cavity loss without external control[1.9]. Active mode-locking can generate pulse trains at higher repetition rates when compared with passive mode-locking. On the other hand, passive mode-locking can generate shorter pulses when compared to active mode-locking. To generate shorter pulses at high repetition rates simultaneously, hybrid mode-locking can be used by employing the two approaches simultaneously.
The first all-fiber ring cavity to produce stable subpicosecond pulses at the fundamental repetition rate is shown in Fig. 1 [1.9]. The polarizer at the output of the fiber-pigtailed isolator and the polarization controller set the elliptical polarization state of the light, which then rotates in the fiber due to the Kerr nonlinearity. After one roundtrip through the polarizer again, the nonlinear polarization rotation transforms into nonlinear loss modulation, which shortens the pulse width to achieve mode locking.
Fig. 1.1 The first all-fiber ring cavity to produce stable subpicosecond pulses [1.9]
3
In the recent years, several advances in the performance of passively mode-locked Er-doped fiber lasers have been reported. Sell et al [1.10] succeeded to produce a mode-locked Er fiber laser to reach output pulse energies of ~1 nJ. Their laser pulses are recompressed to a duration of 7.8 fs and the spectral FWHM of 560 nm. The key element of their system is a two-stage assembly of a precompression fiber spliced to a highly nonlinear bulk fiber for supercontinuum generation. The pulse propagation effects within these optical elements include dispersive propagation, self-phase modulation (SPM), as well as higher order effects such as optical shock front generation and the retarded χ(3) response due to Raman-scattering. These are the shortest pulses ever generated with fiber laser technology[1.10].
1.2 Mode-locked pulse generation
The mode-locking techniques can be used to lock the phases of all oscillating modes to form giant narrow pulses in the time domain. Passive mode-locking by using semiconductor saturable absorber mirrors (SESAM), polarization additive pulse mode-locking (P-APM) configurations and nonlinear optical loop mirrors (NOLM) have been frequently reported in the studies of Er-doped fiber laser systems. The principles of P-APM and NOLM exploit nonlinear effects induced by self-phase and cross-phase modulation both resulted from the optical Kerr effect.
Passive mode-locking by utilizing a semiconductor saturable absorber mirror is robust and also widely used in many Er-doped fiber laser studies. The optical absorption excites electrons from the valence band to the conduction band. As electrons accumulate in the conduction band, the absorbing transition is depleted and therefore the net absorption is reduced.
4
In the 1990s, the polarization additive pulse mode-locking (P-APM) techniques were successfully developed to replace the real saturable absorbers, such as the semiconductor saturable absorber mirrors (SESAMs) in the fiber laser cavity [1.11][1.12]. The two light polarization components are added together at the polarizer where the peak of the pulse with more nonlinear rotation transmits at low loss and the wings are blocked. The action is very fast and its strength is adjustable by the polarization controllers. Because of the response time of Kerr nonlinearity is faster than the recovery time of SESAMs, the shortest pulse width in the 1.5 μm band is achieved by using the P-APM Er-fiber laser.
Nonlinear optical loop mirror (NOLM) was also one of the most influential methods to generated mode-locking, resulting in pulses as short as 125 fs [1.13][1.14]. The power imbalance between the counter propagating beams results in a difference in the nonlinear phase shifts of the two beams caused by the self-phase modulation. The mode-locking operation of the laser is due to the intensity dependent reflectivity of the NOLM.
1.3 Q-switched Mode-locked pulse generation
High-power light sources in the eye-safe wavelength regime near 1.55um have many potential applications in free-space communication, range finding, nonlinear frequency conversion, and medical surgery [1.15-1.18]. These prospective applications have led to the Er-doped fiber laser to receive a great deal of interest during the past years.
With a saturable absorber inside the cavity, the self-QML pulses can usually be experimentally observed in solid state lasers before complete CW-mode-locking is reached [1.17]. With mode field mismatch, the passive all
5
fiber Q-switched lasers can be carried out.
Actively mode-locked fiber lasers need a modulator for mode locking, which not only induces extra loss into the laser cavity but also destroys the all-fiber configuration. In contrast, passively mode-locked fiber laser is a promising alternative. Generally, CW mode-locked pulses have the high repetition rate, which is restricted by the cavity length. High repetition pulses have many advantages such as in optical communication, optical switching and optical clocking. Relatively lower repetition rate short pulses can be generated by the Q-switching mode-locked technique in which the CW mode-locked pulses are modulated by long periodic Q-switched envelopes. With a saturable absorber inside the cavity, the self-QML pulses can usually be experimentally observed in solid state lasers before complete CW-mode-locking is reached [1.19].With mode field mismatch, passive all fiber Q-switched lasers can also be carried out [1.20]. It will enhance the pulse peak intensity and avoid accumulating heat, which may lead to thermal lensing in optical nonlinearity measurements [1.21].
1.4 Motivation of the thesis
For the past two decades, passive mode-locked Erbium doped fiber lasers have been intensively investigated for producing stable, compact and maintenance-free ultrashort pulses light sources [1.10]. In particular, passive mode-locked Erbium-doped fiber lasers has become one of the widely investigated and applied light sources in the telecommunication band around 1550 nm. Generally, the net GVD of many Er-doped fiber laser cavities is slightly anomalous to produce soltiton like pulses through the interaction of anomalous GVD with fiber nonlinearity. However, to raise the pulse energy and to avoid pulse breaking, passive mode-locked fiber lasers operated in the
6
net normal dispersion region have also been intensively investigated recently [1.22-1.26]. The longer output pulses in these lasers can be externally compressed afterwards to achieve short pulse-width or high peak power. Recently the behaviors of dissipative solitons in the strong net-normal dispersion region have been reported in details [1.27-1.28]. On the other hand, the characteristics of passive mode-locked fiber lasers in the large net anomalous dispersion region are rare to be reported.
In this work, we investigate an all-fiber Er-doped fiber laser modelocked by the nonlinear polarization rotation mechanism and operated in the strong net amorous dispersion region with a low pulse repletion rate. A long section of over 400 m single mode fiber is used to build up the large net amorous dispersion as well as the large net self-phase modulation inside the cavity for generating stable wave-breaking free pulse output. Moreover, by carefully adjusting polarization controllers and pumping power, stable self-QML pulses with peculiar self-similar-like optical spectrum are experimentally observed in an all-fiber Er-doped fiber laser with 500 kHz low mode-locking repetition-rate and 2.24kHz Q-switched repetititon rate. The experimental observation suggests a new operation state of Er-doped fiber lasers and may be useful for generating high-peak-power pulses for practical applications.
7
1.4 Organization of the thesis
The present thesis is consisted of four chapters. Chapter 1 is an introduction of the past progress on pulse generation in Er-doped fiber lasers and the motivation for doing this research. Chapter 2 describes the principles and theories of P-APM, high order dispersion, Q-switching and mode-locking. Chapter 3 demonstrates our experimental setup and results. The discussion and analyses of our results are also presented. Finally, Chapter 4 gives the conclusions.
8
[1.1] H. A. Haus, “Mode-Locking of Lasers,” IEEE J. Selected Topics Quantum Electron. 6, 363 (2000).
[1.2] http://www.imra.com/
[1.3] R.J. Mears, L. Reekie, I.M. Jauncey, D.N. Payne "Low-noise erbium-doped fibre amplifier operating at 1.54μm." Electronics Letters 23, 1026 (1987).
[1.4] I.M. Jauncey, L. Reekie, R.J. Mears, D.N. Payne, C.J. Rowe, D.C.J. Reid, I. Bennion, C. Edge."Narrow-linewidth fibre laser with integral fibre grating."Electronics Letters 22, 987 (1986).
[1.5] P. C. Becker, N. A. Olsson, J. R. Simpson “Erbium-Doped Fiber Amplifier,” Academic Press (1999).
[1.6] V. J. Matsas, T. P. newson, D. J. Richardson, and D. N. Payne, “ Selfstarting passively mode-locked fibre ring soliton laser exploiting nonlinear polarization rotation,” Electron. Lett. 28, 1391 (1992).
[1.7] M. Hofer, M. E. Fermann, F. Haberl, M. H. Ober, and A. J. Schmidt, “Mode locking with cross-phase and self-phase modulation,” Opt. Lett. 16, 502 (1991).
[1.8] K. Tamura, H. A. Haus, and E. P. Ippen, “Self-starting additive pulse mode-locked erbium fiber ring laser,” Electron. Lett. 28, 2226 (1992).
[1.9] L. E. Nelson, D. J. Jones, K. Tamura, H. A. Haus and E. P. Ippen, “Ultrashort-pulse fiber ring lasers,” Appl. Phys. B 65, 277 (1997).
[1.10] A. Sell, G. Krauss, R. Scheu, R. Huber, and A. Leitenstorfer “8-fs pulses from a compact Er:fiber system: quantitative modeling and experimental implementation,” Opt. Express 17, 1070-1077 (2009).
[1.11] B. C. Collings, K. Bergman, T. Cundiff, S. Tsuda, J. N. Kutz, J. E. Cunningham,W. Y. Jan, M. Koch, and W. H. Knox, “Short cavity
9
Erbiun/Ytterbium Fiber Lasers Mode-Locked with a Saturable Bragg Reflector,” IEEE J. Selected Topics Quantum Electron. 3, 1065 (1997).
[1.12] H. A. Haus, J. G. Fujimoto, and E. P. Ippen, “Structure for additive pulse mode locking,” J. Opt. Soc. Am. B 8, 2068 (1991).
[1.13] M. Salhi, A. Haboucha, H. Leblond, and F. Sanchez, “Theoretical study of figure-eight all-fiber laser,” Phys. Rev. A 77, 033828 (2008)
[1.14] B. Ibarra-Escamilla, O. Pottiez, E. A. Kuzin, R. Grajales-Coutiño, and J. W. Haus, “Experimental Investigation of a Passively Mode-Locked Fiber Laser Based on aSymmetrical NOLM with a Highly Twisted Low-Birefringence Fiber,” Laser Phy., Vol.18, No. 7 (2008)
[1.15] S. G. Grubb, “High-power fiber amplifiers and lasers,” in Optical Amplifiers and their Applications 5,Washington, DC, 42–44 (1996).
[1.16] B. K. Nayar, J. J. Lewandowski, F. J. Wilson, J. A. Chavez, A. B. Grudinin, J. D. Minelly, G. Kennedy, and A. Raven, “High power 1540 nm fiber lasers for surgical applications,” Proc. LEOS’98, 2, Orlando, FL,397–398 (1998).
[1.17] S. U. Alam, P. W. Turner, A. B. Grudinin, and J. Nilsson, “High-energy, high repetition rate, tunable Er-Ybcodoped Q-switched fiber laser,” Tech. Dig. Conf. Lasers and Electro-Optics (LEOS), Baltimore, MD, 218–219 (2001). [1.18] J. E. Nettleton, B. W. Schilling, D. N. Barr, and J. S. Lei, “Monoblock laser for a low-cost, eyesafe, microlaser range finder,” Appl. Opt. 39, 2428-2432 (2000).
[1.19] J.H. Lin, K.H. Lin, C.C. Hsu, W.H. Yang, and W.F. Hsieh, “Supercontinuum generation in a microstructured optical fiber by picosecond self Q-switched mode-locked Nd:GdVO4 laser,” Laser Phys. Lett. 4, 413-417 (2007).
10
[1.20] F. W. Wise, A. Chong, and W. Renninger, “High-energy femtosecond fiber lasers based on pulse propagation at normal dispersion,” Laser Photonics Rev. 2, 58-73 (2008).
[1.21] J.-H. Lin, K.-H. Lin, H.-H. Hsu, and W.-F. Hsieh, “Q-switched and mode-locked pulses generation in Nd : GdVO4 laser with dual loss-modulation mechanism,” Laser Phys. Lett. 5, 276 (2008).
[1.22]A.Chong, W. H. Renninger and F. W. Wise, “All-normal-dispersion femtosecond fiber laser with pulse energy above 20 nJ,” Opt. Lett. 32 2408–2410 (2007).
[1.23] C. Wu and N. K. Dutta, “Dissipative solitons in normal-dispersion fiber lasers,” Phys. Rev. A. 77, 023814-1-023814-4 (2008).
[1.24] A. Ruehl, V. Kuhn, D. Wandt and D. Kracht, “Normal dispersion erbium-doped fiber laser with pulse energies above 10 nJ,” Opt. Lett. 16 3130-3135 (2008).
[1.25] A. Chong, W. H. Renninger and F. W. Wise, “Properties of normal-dispersion femtosecond fiber lasers,” J. Opt. Soc. Am. B 25, 140-148 (2008).
[1.26] F.O. Ilday, J. R. Buckley, W.G. Clark and F.W. Wise, “Self-Similar Evolution of Parabolic Pulses in a Laser,” Phys. Rev. Lett. 92, 213902-1 - 213902-4 (2004).
[1.27] X. Liu, “Dissipative soliton evolution in ultra-large normal-cavity-dispersion fiber lasers,” Opt. Express 17, 9549-9557 (2009). [1.28] X. Liu, L. Wang, X. Li, H. Sun, A. Lin, K. Lu, Y. Wang, and W. Zhao, “Multistability evolution and hysteresis phenomena of dissipative solitons in a passively mode-locked fiber laser with large normal cavity dispersion,” Opt. Express 17, 8606-8517 (2009).
11
Chapter 2
Principles
2.1 Nonlinear Polarization Rotation
Nonlinear polarization rotation can occur in an optical fiber when the initial polarization state is elliptical due to the Kerr effect in glass. The ellipse can be resolved into right- and left-hand circular polarization components of different intensities. The propagation equations of the CW circular polarized lights in the isotropic Kerr medium can be written as [2.1-2.3]:
(2.1.1)
(2.1.2)
The solution of the above equations is
(2.1.3)
(2.1.4)
As a result the, state of an elliptical polarized light will be rotated as shown in Fig. 2.1. The rotated angle is proportional to the propagation distance and the intensity difference of the two circular polarization components.
As stated above, nonlinear polarization rotation can occur in an optical fiber when the initial polarization state is elliptical. The ellipse can be resolved into right- and left-hand circular polarization components of different intensities as show in Eq.(2.1.3) and Eq.(2.1.4). These two circular components then
12
accumulate different nonlinear phase shifts related to the intensity dependence of the refractive index [2.4][2.5]. So with proper settings of the initial polarization ellipse and the phase bias, pulse shortening can occur with the presence of a polarized element.
Fig 2.2 shows how nonlinear polarization rotation can be used in conjunction with bulk polarization optics to obtain an artificial fast saturable absorber and to mode-lock the laser [2.3]. An initial pulse is linearly polarized and then made elliptically polarizated with a quarter-wave plate. The light then passes through an optical fiber where the ellipse rotation occurs and the peak of the pulse rotates more than the pulse wings. At the output of the fiber, the half-wave plate is oriented in such a way that the peak of the pulse passes through the polarizer while the wings of the pulse are extinguished. In this way, pulse shortening is achieved.
13
14
2.2 Self-Phase Modulation (SPM)
The self-phase modulation (SPM) effects can also be easily observed in a silica-core fiber. SPM leads to spectral broadening of optical pulses due to intensity dependence of the refractive index in nonlinear optical media. The refractive index of a fiber can be written as [2.6]
(2.2.1)
where I is the optical intensity, n0 is the linear part of the refractive index and n2
is the nonlinear index coefficient defined by
(2.2.2)
When the pulse width is not too short, we can use the following nonlinear Schrödinger equation for describing pulse propagation:
(2.2.3)
By introducing a normalized amplitude U as
(2.2.4) and neglecting effects of GVD Eq.(2.2.3) becomes
15
(2.2.5)
where LNL is the nonlinear length defined as . Equation (2.2.5)
has the solution:
(2.2.6)
Here is the induced nonlinear phase shift and can be described by:
(2.2.7)
where is the effective length defined as
(2.2.8)
The SPM induces spectral broadening caused by the time dependence of
. The time dependence of the frequency is commonly referred as the
frequency chirp, so the frequency difference is given by
(2.2.9)
This broadening is usually accompanied by the presence of an oscillatory structure in the optical spectrum resulting from the interference between two different parts of the pulse having the same instantaneous frequency. The
16
chirp which is induced by the SPM will affect the pulse shape as well the GVD effect. In the anomalous dispersion regime, the cooperation of SPM and GVD can make the pulse propagate as an optical soliton.
2.3High Order Dispersion
It is sometime necessary to consider the third-order dispersion(TOD) .For example, if the pulse width become shorter around 1ps the expansion parameter of is no longer small enough to be ignored. The propagation equation with is now written as [2.6]
(2.3.1)
This equation can be solved by using the Fourier-transform technique as
(2.3.2)
For the case of a chirp Gaussian pulse, we can introduce a new variable
where
(2.3.3)
Then Eq.(2.3.2) becomes
17
where . The can be eliminated by . The results can be written in terms of Airy function as
(2.3.5)
Since the pulse evolution along the fiber depends on the relative magnitude of and , we can introduce a dispersion length associated with the TOD as
(2.3.6)
This characteristic length can be used for estimating the magnitude of the third order dispersion effects.
2.4 Dispersion Compensation
Group-velocity dispersion induced pulse broadening effects become of serious concern for some applications. The technique of dispersion management provides a solution to this problem. If we have two kinds of fibers that had opposite signs of , then we can combine them to reduce the average dispersion to a small value. When the net GVD is set to zero, the linear dispersion effects are totally compensated [2.6].
The basic idea can be understood from solution of Eq.(2.2.3)(set ). For the dispersion map consisting of two fiber segments the solution becomes
18
Where is the dispersion-map period, and is GVD
parameter of the fiber segment of length (j=1,2). By using , the equation for dispersion compensation can be written as
(2.4.2) As when above equation is satisfied, the pulse recovers its initial width. One can satisfy Eq.(2.4.2) in several ways. Standard single mode fibers are with an anomalous GVD [ ], therefore the dispersion can be compensated by using a relatively short segment of dispersion compensating fibers (DCF) designed to have large normal dispersion with values of .
2.5 Saturation of additive pulse mode-locking
The operation of the all-fiber soliton laser may experience several inherent limitations of the soliton regime. The soliton area theorem states that the product of the peak amplitude and pulse width will remain as a constant as shown below.
(2.5.1)
The energy of a soliton as shown in Eq.2.5.2, is thus limited when either the peak power or pulse width is limited.
19
Because the P-APM mechanism is based on the nonlinear interference, the term of SAM in the master equation can be described more accurately by [2.3][2.7-2.8]. A pulse passing through this APM structure has an energy gain of
(2.5.3)
With the pulse being in the shape of the maximum gain acquired from P-APM is . Then the maximum pulse amplitude as well as the soliton pulse energy is limited. If the pump power is increased to obtain high powers, the peak power of the soliton will eventually reach the limit imposed by this APM saturation. Then the single pulse per cavity round-trip will break up into multiple, uncontrolled (untimed) pulses. This indicates the effect of soliton energy quantization. The phenomenon of soliton energy quantization is observed when the fiber laser have the excessive gain or when the fiber laser has a large SAM coefficient due to the long cavity length of fiber laser.
20
2.6 Theory of Q-switching
The mechanism of Q-switching is by turning on and off the laser resonator loss periodically. That is to say, by spoiling the resonator quality factor Q, the loss inside the cavity will oscillate periodically in order to obtain giant output pulses. So the Q-switching can also be called as the loss switching. One usually introduces the loss oscillation through using a modulated absorber. Because the pump continues to deliver constant power at all time, at the high loss times, energy is stored inside the cavity in the form of an accumulated population inversion. During the on-time, the losses are reduced and the large accumulated population inversion is released, generating giant and short pulses of light as shown in Fig. 2.3.
Fig. 2.3 The loss modulation, population inversion and the pulse generation of Q-switch lasers [2.9]
As shown in figure 2.4, we identify that the shutter is opened at the point of t = 0. The population inversion is far above threshold at that instant in the system. The spontaneous emission along the axis of the cavity is then enormously amplified so that the pulse quickly builds up to a sufficiently strong one through depleting the population inversion.
21
Fig. 2.4 The geometrical setup and the detailed process of pulse formation in the time domain for a Q-switched laser [2.10]
The giant pulse occurs on a very short time scale with a large number of stimulated photons. In view of this large increase in the photon flux, we realize that the population inversion will become depleted as the photon number increases. Consequently, one must keep track of the number of excited states as well as the number of photons.
We now make numerical predictions about the amplitude of the intensity produced by this Q switching operation. We can get rid of at least two of the transverse spatial coordinates by assigning an effective beam area A. We are
22
then left with the two dimensions z and t by ignoring any nonuniformity in the population density or the photon density along the z-axis of the simple cavity. First of all, we have to inquire the time evolution of the photon number inside the cavity presuming that there are a few around to initiate the lasing process. In one round trip the photon number will increase by a factor exp[2(N2-N1)σlg]
and decrease owing to imperfect window transmission (Пj Tj), finite reflectivity
(Пj Ri) and residual absorption (usually in the shutter) as exp-[2αsls]. The net
change in Np during a round trip, the amplified result minus the starting value, divided by τRT (round trip time) is an excellent approximation to dNp/dt.
(2.6.1)
With some abbreviation and approximation, one has
(2.6.2)
Here n = (N2-N1)Alg is the total number of inverted atoms in the cavity
interacting with an optical mode of cross sectional area A, and nth is total
number at threshold. Equation (2.6.2) helps to account for that the photons increase with time if the inversion is larger than the threshold value, and otherwise, they decrease.
The stimulated emission not only increases the photon numbers but also changes the population inversion simultaneously. With a photon being produced, there is one atom changing its state from 2 to 1, which reduces the
23
inversion by 2 (for equal degeneracies) and thus reduces the gain. Now that we know how to model the time evolution of the photon number, the next step is to study the dynamics of the population inversion. The equations for the population of the upper and lower state are given by
-σ
(2.6.3)
σ
(2.6.4)
Subtracting Eq.(2.6.4) from Eq.(2.6.3) and with some derivation, the formula of population inversion can be written as
(2.6.5)
The above equation could have been stated as a direct consequence of the formula of photon number since it merely states that if the number of photons increases by 1, then the population inversion must decrease by 2. By substituting a time scale normalized to the photon lifetime of the passive cavity by T =t/τp and dividing Eq.(2.6.2) by Eq.(2.6.5), one eliminates the time
coordinate from the equation.
(2.6.6)
24
value of the photon number Np(i) (which is negligible compared to what it will
be) to the photon number Np(max) at the peak of the power pulse and
simultaneously integrate the right-hand side from the initial value of the inversion, ni, to the threshold value nth. Thus we can find an elementary
solution for the photon number Np in terms of the population inversion n as
shown below.
(2.6.7)
(2.6.8)
From the above equation, we can further obtain the answer for the peak of the power pulse, output energy, and a reasonable estimation for its FWHM in terms of the photon number Np and population inversion n without using more
complicated mathematical methods. The maximum output power can be expressed in a compact fashion by
25
[2.1] R. H. Stolen, J. Botineau, and A. Ashkin, “Intensity discrimination of optical pulses with birefringent filters”, Opt. Lett. 7, 512 (1982).
[2.2] M. Hofer, M. E. Fermann, F. Haberl, M .H. Ober and A. J. Schmidt, “Mode locking with cross-phase and self-phase modulation”, Opt. Lett. 16, 502 (1991).
[2.3] L. E. Nelson, D. J. Jones, K. Tamura, H. A. Haus, and E. P. Ippen, “Ultrashort pulse fiber ring lasers,” Appl. Phys. B, vol. 65, pp. 277–294, 1997. [2.4]P. D. Maker, R. W. Terhune: Phys. Rev. Lett. 12, 507 (1964)
[2.5]. R. H. Stolen, J. Botineau, A. Ashkin: Opt. Lett. 7, 512 (1982)
[2.6] G. P. Agrawal, Nonlinear Fiber Optics, Academic Press, San Diego, (2001).
[2.7] H. A. Haus, E. P. Ippen, and K. Tamura, “Additive-Pulse Modelocking in Fiber Lasers,” IEEE J. Quantum Electron. 30, 200 (1994).
[2.8] H. A. Haus and A. Mecozzi, “Noise of Mode-Locked Lasers,” IEEE J. Quantum Electron. 29,983 (1993).
[2.9] B. E. A. Saleh and M. C. Teich, “Fundamentals of Photonics,” John Wiley & Sons, New York _1991_.
[2.10] Joseph T. Verdeyen, “Laser Electronics,” third edition, Prentice Hall Englewood Cliffs,New Jersey 07632
26
Chapter 3
Experimental results
Before compression
3.1 Q-switched mode-locked
3.1-1 Experimental setup
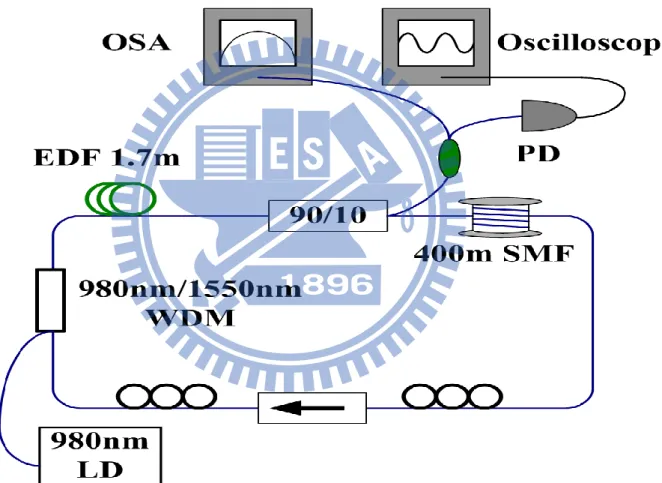
Fig. 3.1 Schematic diagram of the Er-fiber laser
The schematic setup of Q-switched pulses generation from our erbium doped fiber laser with a ring cavity configuration is shown in Fig. 3.1. A laser diode with center wavelength of 980 nm is used to pump the 1.65 m long Er-doped single-mode gain fiber through a wavelength-division multiplexing
27
(WDM) coupler. The Er-fiber is very highly doped and the absorption coefficient is 80 dB/m @ 1530 nm. The isolator is for single direction wave propagation to prevent spatial hole burning and it is polarization-dependent. Two polarization controllers with isolator can provide enough polarization dependent loss for Polarization Additive Pulse Mode-locking (P-APM). Over 400 m of single mode fiber is used inside the laser cavity to reduce the mode-locking repetition rate and to provide large dispersion and high nonlinearity. Finally, we use a 90/10 coupler to divide the light into the power meter (Newport inc.), oscilloscope (Wave Surfer 62 Xs, bandwidth 650 MHz, LeCroy) and optical spectrum analyzer (ADVANTEST Q8384.) for monitoring the state of laser.
3.1-2 Results and discussions
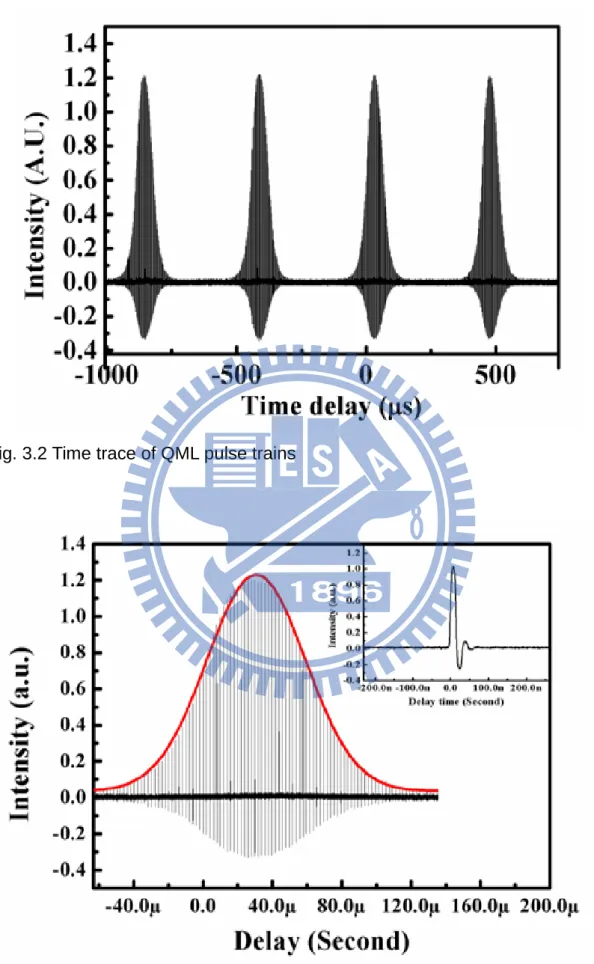
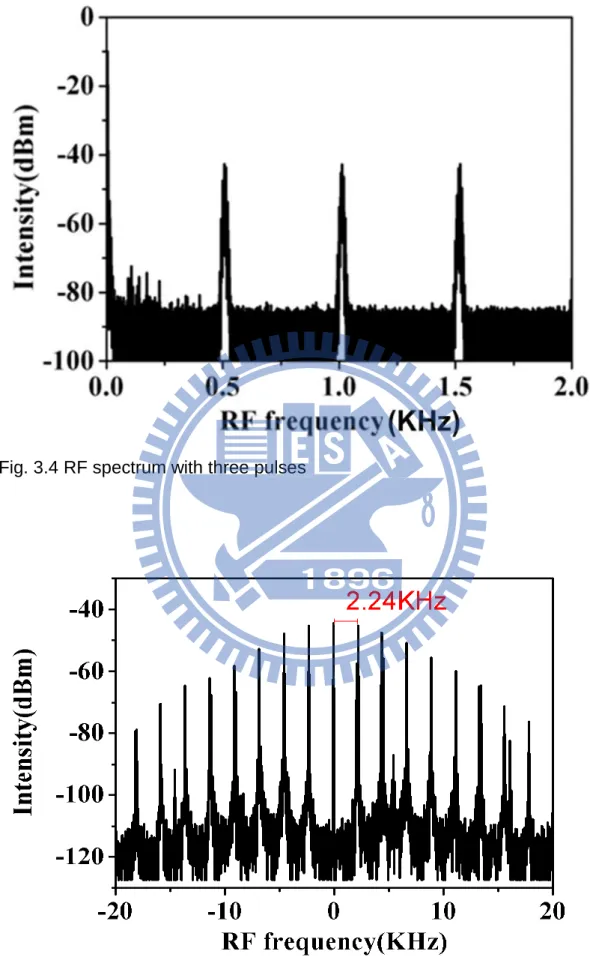
Stable Q-switched mode-locked (QML) pulses can be generated after properly rotating the angles of the polarization controllers (PCs) and adjusting the pump power to be less than 93mW. With a suitable pump power at 89mW, the QML pulse train shown in Fig. 3.2 is observed. Fig. 3.2 show that time spacing between adjacent Q-switched envelopes is about 446 us. Fig. 3.3 reveals the expanded symmetric single Q-switched envelope. Inside the envelope, the mode-locked pulses with a 2 s time spacing can also be obviously seen. The time trace of a single mode-locked pulse is shown in the inset of Fig. 3.3, from which the pulse width is estimated to be below 7 ns. Fig. 3.4 and Fig. 3.5 show that the laser is with a 500 kHz low mode-locking repetition-rate and 2.24kHz Q-switched repetition rate.
28
Fig. 3.2 Time trace of QML pulse trains
Fig. 3.3 Expanded single QML envelope, (Inset shows the time trace of a single mode-locked pulse)
29
Fig. 3.4 RF spectrum with three pulses
30
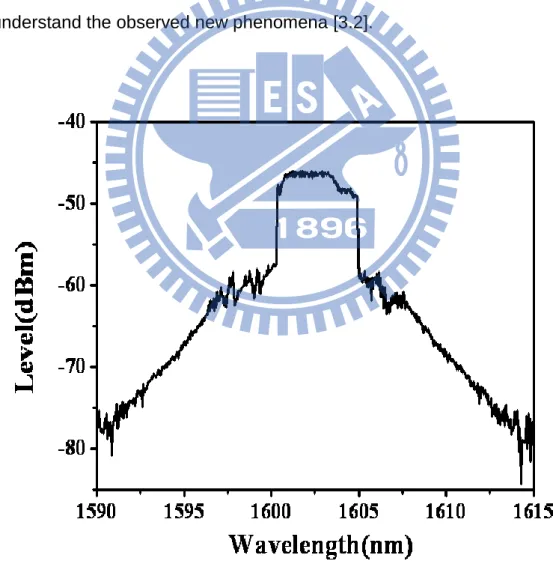
The output optical spectrum is shown in Fig.3.6. We can see the spectrum have the self-similar-like characteristics normally observed in the all normal dispersion region [3.1],in which the plateau with steep edges on the pedestal can be clearly seen. The center wavelength is at the 1602 nm and the 3 dB bandwidth is about 5 nm. Since our laser works in the large anomalous dispersion region, we believe the experimental observation suggests a new self-similar-like operation state of the Er-fiber laser. We have also theoretically confirmed that the soliton pulse with a large nonlinear chirp in the form of will produce a flat-top spectral shape, which should provide a clue
to understand the observed new phenomena [3.2].
31
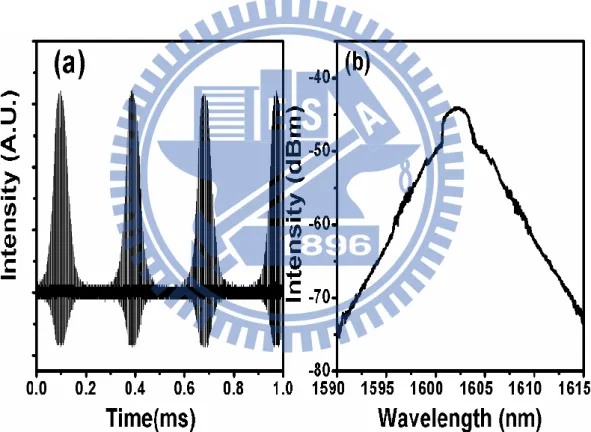
As the pumping power increases, the stable and regular QML pulse trains can still exist but the repetition rate of Q-switched envelope increases. Fig. 3.7(a) shows the time trace of QML pulse train at 131 mW pump power in which the period of Q-switched envelope becomes 290 s. The corresponding optical spectrum in Fig. 3.7(b) is similar to that in Fig. 3.6 but the bandwidth and amplitude of plateau region becomes smaller. Nevertheless, the step edges in the two sides of plateau can still exist and the pedestal has the same slope like that in Fig. 3.6.
Fig. 3.7 (a) Time trace of QML pulse trains and (b) corresponding optical spectrum at 131 mW pump power
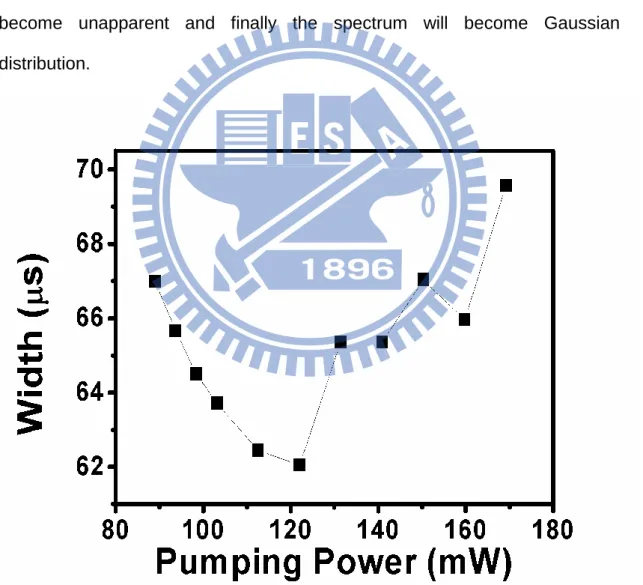
The measured width of the Q-switched envelope as the pumping power increases is shown in Fig. 3.8. The width of Q-switched envelope decreases slightly as the pumping power increases and the shortest width of about 62 s
32
can be obtained at the 122 mW pump power. At even higher pump powers the width and repetition rate will increase simultaneously. We also record the evolution of optical spectrum as the pump power increases and the results are shown in Fig. 3.9. As the pump power increased from 89 mW to 93.7 mW, the bandwidth of plateau above pedestal also increases. Then, the flat region in the top of plateau becomes curved at the 103 mW pump power. At even higher pump powers about 112 mW, the second floor plateau is generates above the original plateau. The steep edges in two side of plateau will become unapparent and finally the spectrum will become Gaussian distribution.
33
34
For confirming our expectation theoretically, we simulated the optical spectrum of a soliton pulse with a large nonlinear chirp. We use mathematica to perform the simulation. The parameter b is representing the linear chirp and b2 is the higher order chirp. We expect the parameter of the higher order chirp b2 is large than the linear chirp parameter b. For this reason, we set b2 as 800 and b as 100 to simulate the pulse spectrum. Fig. 3.10 shows our results, with the appearance just like the experimental QML optical spectrum.
35
Finally we use a tunable optical filter to confirm that the flat-top spectral shape is indeed caused by soliton pulses instead of assembling many continuous-wave components. Fig 3.11 shows the optical spectrum before filtering.
Fig. 3.11 Optical spectrum of QML pulses (Center on 1586nm)
First we filter out the edges of flat-top and keep the center spectrum of 1nm wide as seen in Fig. 3.12. After that we tune the filter to the left edge and right edge respectively, as in Fig. 3.13 and Fig. 3.14. The corresponding time traces are shown in Fig. 3.15, Fig. 3.16 and Fig. 3.17, in which the Q-switched envelopes are the same with the envelope width of about 65 s. These results indicate that the flat-top spectral shape is formed by the same Q-switched mode locked pulse instead of the combination of many continuous-wave components. In other words, the pulses produce all the wavelength components in the flat-top spectrum.
36
Fig. 3.12 Optical spectrum of QML after filtering (up curve is original spectrum) (middle remain)
Fig. 3.13 Optical spectrum of QML after filtering (up curve is original spectrum) (left edge remain)
37
Fig. 3.14 Optical spectrum of QML after filtering (up curve is original spectrum) (right edge remain)
38
Fig. 3.16 Expanded single QML envelope (left edge remain)
39
3.2 Mode-locked pulse generation
In the previous section, the generation of stable Q-switched mode-locked pulses has been successful demonstrated. In this section, we want to study the characteristics of a passive mode-locked Er-fiber laser with over 400m single mode fibers inside the cavity to achieve a low pulse repetition rate of 500 kHz.
3.2-1 Experimental setup
90/1
0
Fig. 3.18 Schematic diagram of the Er-fiber laser
The basic setup is the same as that in the previous section. The 976 nm pump laser diodes are used to pump 1.65 m long Er-doped fiber through a WDM coupler. The fiber ring is including two polarization controllers with total length 340 cm. An isolator and 400m long signal mode fiber is added in the cavity to provide large net nonlinearity as well as large net anomalous
40
dispersion. Finally a 90/10 coupler is connected to the output coupler to divide the light into the power meter, oscilloscope,RF spectrum and optical spectrum analyzer for monitoring the state of the laser. However, in order to observe the optical spectrum before entering the Er-doped fiber we add a 99/1 coupler between the WDM and Er-doped fiber.
3.2-2 Results and discussions
The required pump power for generating mode-lock pulses is more than QML pulses. Above a certain threshold pump power, we can always operate the laser at a relatively stable continuous-wave mode-locking (CW-ML) state without pulse breaking by properly rotating the angles of the polarization controllers (PCs). The time traces of mode-locked pulses measured from the oscilloscope are shown in Fig. 3.19. The typical CW-ML pulse trains show the time interval of pulse separation is about 2 s. The corresponding repetition rate is 500 kHz, which can also be seen by the RF spectrum analyzer as illustrated in Fig. 3.20. Fig. 3.19 and Fig. 3.20 show that the mode-locked pulse train is relative stable in the time domain and the mode locked harmonic components can be clear seen in the RF spectrum.
41
Fig. 3.19 Time trace of pulse train
42
In order to measure the output pulse-width, a high speed detector and 20G sampling oscilloscope are used. The expanded single pulse trace is shown in Fig. 3.21, which reveals that the pulse-width is below 1.8ns. Based on the parameters of a 500 kHz repetition rate, 1.87 ns pulse width and 3.27 mW average power, we estimated the peak power of the laser output is about 3.5 W.
Fig. 3.21Expanded time trace
In addition, a relatively flat optical spectrum of the mode-locked pulses has been observed as shown in Fig. 3.22. The center wavelength is about 1585 nm and the 3dB spectrum bandwidth is 45 nm. We recognize that the optical spectrum obtained in our laser is relatively wider than typical mode-locked
43
single mode Er-doped fiber lasers. This is resulted from the net high third order nonlinearity of the 400 m long single mode fiber. The resulted 45 nm bandwidth from our simple laser configuration already can approach the 50 nm bandwidth performance of the reported frequency comb fiber laser [3.3].
Fig. 3.22 Optical spectrum
By carefully adjusting the polarization controllers we can also generate a square pulse shape. That because the intensity-dependent loss induced by NPR can have different characteristic responses. The round trip intensity transmission, T, of the system can be expressed as
(3.2.1)
44
is beat length. One can drive an approximate expression for the beat length with a given power ( and )
(3.2.2)
Fig. 3.23 shows the numerically evaluated transmission as a function of power, with and . It can be seen that T(p) reaches the maximum value of 1 around p=2.5 and then starts to fall again. It may be these particular nonlinear switching characteristics that lead the laser to generate square-shaped pulses.
45
From Eq.(3.2.2) we can solve a solution for the switching power as
(3.2.3)
As the result of Eq.(3.2.3), if one can increase the fiber length, the threshold
power can be reduced such that the square-shaped pulses may be generated. Our experimental results are shown as follows. The expanded single pulse
trace at the pump power of 233 mW is shown in Fig. 3.24. The pulse-width is about 7.5ns, operated under the cavity fundamental repetition rate of 500 kHz. The optical spectrum is shown in Fig. 3.25 with the 3dB spectrum bandwidth of 5.7 nm
46
Fig. 3.25 Optical spectrum of square-shaped pulses
Finally we compress the output laser pulses externally to generate ultarshort pulses with high peak powers. We use an erbium doped fiber amplifier (EDFA) for further boosting the optical power and use a section of dispersion compensating fibers (DCF) for linear pulse compression. The schematic setup is shown in Fig. 3.26, the polarization- independent isolator been connected to output is used to protect the laser and a 90/10 coupler is used to monitor original laser output. Then, the 400m DCF is used to compensate the dispersion. A pump laser diode with 980 nm center wavelength is used to pump 5 m long Er-doped fiber and its output is connected to the autocorrelator and optical spectrum analyzer for measurement. The dispersion values and units of parameters for some of the fibers used in the experiments are estimated as shown in Table. 3.1
47 SMF DCF Er-doped fiber Table. 3.1 Estimated values of parameters
Autocorrelation W D M P U M P 9 0 /1 0 90/10
DCF
EDF WD M P U M P OSAFig. 3.26 Schematic diagram
Experimentally we have successfully used the dispersion compensating fiber (DCF) and EDFA to compensate the linear chirp of the laser output pulses. We have also observed that the nonlinear effects inside the EDFA may also have contributed to the chirp compensation. Fig. 3.27 and Fig. 3.28 show the characteristics of the compressed pulse. The pulse width decreases from nanosecond to femtosecond. Fig. 3.27 shows the autocorrelation trace of the compressed mode-locked pulse, and the pulse width from gauss fitting is about 230 fs. The laser output power increases to 31mW and the pulse peak power becomes 284kW. The corresponding optical spectrum is shown
48
in Fig. 4.3. The center wavelength is about 1572 nm and the 3dB spectrum bandwidth is 36 nm.
Fig. 3.27 Autocorrelation trace of the compressed pulse
49
3.3 Soliton pulses
3.3-1 Results and discussions
In our laser, the soliton pulses can be generated on under very low pump powers due to the long cavity length. When the pump power reaches about 60mW, the stable soliton pulses can be seen. Fig. 3.29 shows the time traces on the oscilloscope with the repetition rate of 500 kHz. Fig. 3.30 reveals the expanded pulses trace, in which two pulses seperated with a time period of 205 ns can be obviously seen. The soliton pulses breaks up because of the inherent limitations of the soliton regime. We can calculate that the pulse energy in the cavity is 25 pJ. The corresponding optical spectrum shown in Fig. 3.31 indicates that the center wavelength is on 1602.5 nm and the Kelly sidebands can be seen clearly. The distance between the two first-order side-peaks is 2 nm.
50
Fig. 3.30 Expanded time traces of two soliton pulses
51
To confirm the pulses in the cavity are solitons, we calculate the soliton energy of our laser. First the soliton energy can be written as . We estimate the for our pulses is about 1.5 ps and A0 is
(3.3.1)
For SMF and , the soliton energy is . The result agrees with our experimentally observed pulses
energy.
When increasing the pump power above 90 mW, we observe some interesting dynamics of the laser operation. These dynamic effects can be monitored by using the oscilloscope, as shown in Fig. 3.32. In the figure, several isolated solitons are seen on the left of the large peak and they will move towards the trailing edge of right large peak. Chouli et al indicated that similar soliton dynamics seems to appear when the background noises are above a certain threshold, although the required threshold also depends on the settings of the polarization controllers. When the polarization controllers are fixed, a fine control of the amount of the CW background can trigger or stop the soliton dynamics [3.5].
Fig. 3.33 shows the expanded time traces of soliton pulses per round trip. We estimate the number of solitons in the whole bunch is about 117. The recorded spectrum of the output is shown in Fig. 3.34. The measured number of solitons per round trip as the pumping power increases is shown in Fig. 3.35.
52
Fig. 3.32 Oscilloscope recording of soliton pulses
53
Fig. 3.34 Optical spectrum of soliton pulses
54
[3.1] F. W. Wise, A. Chong, and W. Renninger, “High-energy femtosecond fiber lasers based on pulse propagation at normal dispersion,” Laser Photonics Rev. 2, 58-73 (2008).
[3.2] L.E. Nelson, D.J. Jones, K. Tamura, H.A. Haus, E.P. Ippen, “Ultrashort-pulse fiber ring lasers”, Apply Physics B, vol. 65, no. 2, pp. 277–294, 1997.
[3.3] Y.-J. Kim, Y. Kim, B. J. Chun, S. Hyun, and S.-W. Kim, “All-fiber-based optical frequency generation from an Er-doped fiber femtosecond laser,” Opt. Express 17, 10939-10945 (2009).
[3.4] V. J. Matsas, T. P. Newson, D. J. Richardson, D. N. Payne“Selfstarting passively mode-locked fibre ring soliton laser exploiting nonlinear polarisation rotation”Electron.Lett. 28, 1391 (1992)
[3.5] S. Chouli, P. Grelu“Rains of solitons in a fiber laser” Optics express, (2009)
55
Chapter 4
Conclusions
In this thesis, we have investigated a passive mode-locked all-fiber Er-doped fiber laser operated with large net anomalous dispersion as well as large net nonlinearity. In our laser, we can achieve different kinds of pulse characteristics by adjusting the pump power and the polarization controllers as follows.
(1) Q-switched mode-locked pulse
Stable and regular Q-switched mode-locked pulses have been experimentally demonstrated in our Er-doped fiber laser with a 500-kHz low mode-locking repetition rate. From the experimental observation, the stability, pulse shape, pulse width of the generated Q-switched envelopes and also the optical spectral will depend on the pump power. The observed self-similar-like optical spectrum suggests a new operation state of the Er-fiber laser in the large anomalous dispersion region and may be useful for generating high-peak-power pulses from Er- fiber lasers for practical applications.
(2) Mode-locked pulse
Over 400 m single mode fibers have been added in the laser cavity to generate stable wave breaking free pulses with a low pulse repetition rate of 500 kHz and a wide, flat optical spectrum of 45 nm. We have also successfully used dispersion compensating fibers (DCF) to compensate the chirp of the laser output pulses. The pulse width is reduced from nanosecond to femtosecond. We estimate the peak power of the compensated laser output pulse is about 284 kW. This fiber laser configuration may be further applied to chirped pulse amplification systems without resorting to pulse stretchers and
56
pulse pickers.
(3) Mode-locked soliton pulse
Our laser can generate soliton pulses under very low pump powers. The pulse width is 1.5 ps with 500-kHz low mode-locking repetition rate. The corresponding pulse energy is about 25 pw, which is just the soliton energy of the SMF under the 1.5 ps pulse width. When the pump power is increased above 90 mW, we further observe some interesting dynamic soliton effects. These results suggest that the laser may also be used as a new platform for the study of soliton dynamics.
![Fig. 1.1 The first all-fiber ring cavity to produce stable subpicosecond pulses [1.9]](https://thumb-ap.123doks.com/thumbv2/9libinfo/8736841.203329/11.892.167.726.883.1060/fig-fiber-ring-cavity-produce-stable-subpicosecond-pulses.webp)
![Fig 2.2 shows how nonlinear polarization rotation can be used in conjunction with bulk polarization optics to obtain an artificial fast saturable absorber and to mode-lock the laser [2.3]](https://thumb-ap.123doks.com/thumbv2/9libinfo/8736841.203329/21.892.145.746.485.1041/nonlinear-polarization-rotation-conjunction-polarization-artificial-saturable-absorber.webp)
![Fig. 2.3 The loss modulation, population inversion and the pulse generation of Q-switch lasers [2.9]](https://thumb-ap.123doks.com/thumbv2/9libinfo/8736841.203329/29.892.135.752.467.821/fig-modulation-population-inversion-pulse-generation-switch-lasers.webp)
![Fig. 2.4 The geometrical setup and the detailed process of pulse formation in the time domain for a Q-switched laser [2.10]](https://thumb-ap.123doks.com/thumbv2/9libinfo/8736841.203329/30.892.154.755.122.743/geometrical-setup-detailed-process-pulse-formation-domain-switched.webp)