行政院國家科學委員會專題研究計畫 成果報告
在豬隻心房顫動模式中功能性基因體的變化(3/3)
計畫類別: 個別型計畫 計畫編號: NSC93-2314-B-002-014- 執行期間: 93 年 08 月 01 日至 94 年 07 月 31 日 執行單位: 國立臺灣大學醫學院內科 計畫主持人: 賴凌平 報告類型: 完整報告 處理方式: 本計畫可公開查詢中 華 民 國 94 年 10 月 21 日
行政院國家科學委員會補助專題研究計畫
5 成 果 報 告
□期中進度報告
在豬隻心房顫動模式中功能性基因體的變化
(3/3)
計畫類別:5 個別型計畫 □ 整合型計畫
計畫編號:NSC 93-2314-B-002-014-
執行期間: 93 年 8 月 1 日至 94 年 7 月 31
計畫主持人:賴凌平
共同主持人:
計畫參與人員:
成果報告類型(依經費核定清單規定繳交):□精簡報告 5完整報告
本成果報告包括以下應繳交之附件:
□赴國外出差或研習心得報告一份
□赴大陸地區出差或研習心得報告一份
□出席國際學術會議心得報告及發表之論文各一份
□國際合作研究計畫國外研究報告書一份
處理方式:除產學合作研究計畫、提升產業技術及人才培育研究計畫、
列管計畫及下列情形者外,得立即公開查詢
□涉及專利或其他智慧財產權,□一年□二年後可公開查詢
執行單位:國立臺灣大學醫學院內科
中 華 民 國 94 年 10 月 20 日
中文摘要及關鍵詞
前言: 在心房顫動的過程中,心房組織會發生功能性以及結構性的改變,而這些改 變又會造成心房顫動的進一步惡化,因此我們利用 cDNA 微陣列以及二維蛋白電 泳的方式,以期找出心房顫動時,心房組織的變化。 方法及結果: 我們首先在豬隻建立一個心房顫動的模式,而其方法是以右心房每分鐘 600 次的電刺激而造成。在心房快速刺激六星期後,將豬隻犠牲並取得心房組織,接 著我們使用含有 6035 個 cDNA 的微陣列來研究 mRNA 的變化,再以二維電泳的方 式來研究蛋白的變化。在 cDNA 微陣列的實驗中,我們發現在左心房中 387 個基 因有明顯的變化,而在右心房中有 81 個基因有明顯的變化,在這些基因中,以 MLC-2V 的變化最大,在左心房中達 9.4 倍上升,而在右心房中達 7.3 倍上升, 在二維蛋白電泳中,我們發現在 pI 4.5 到 5.0 之間,18-20kd 的位置有三個蛋 白點有明顯上升。經由進一步質譜分析發現,這三個蛋白點都是 MLC-2V,而與 mRNA 的變化相符合。 結論: cDNA 微陣列及二維蛋白電泳都顯示,心房顫動時,心房組織會產生特異性 的變化,而其中 MLC-2V 的上升是典型的變化。英文摘要及關鍵詞(keywords)
Abstract
Introduction Functional and structural changes of the atrial tissue occur during the
natural course of Af and these changes may contribute to further Af. We investigated
the changes in atrial fibrillation (Af) tissue using cDNA microarray and
two-dimensional protein electrophoresis techniques.
Methods and Results We established a porcine model of Af by rapid right atrial appendage pacing at a rate of 600/min. Atrial tissue was obtained after rapid atrial
depolarization for 6 weeks. Microarrays containing 6035 cDNA clones were used to
evaluate the alterations of mRNA while two-dimensional protein electrophoresis was
performed to compare protein patterns. In cDNA microarray studies, we identified
387 genes with significant change in the left atrium and 81 genes in the right atrium.
Among the genes, the ventricular isoform of the myosin regulatory light chain
(MLC-2V) showed the greatest fold of change (9.4 and 7.3 in the left and right atrium
respectively). In protein electrophoresis, the expression levels of three protein spots
spanning from 18 to 20 Kd in the acidic region (PI 4.5 to 5.0) were specifically
elevated in the Af group. Interestingly, through tandem mass spectrometric analysis,
these three spots were identified to be MLC-2V. Thus MLC-2V expression at the
mRNA and protein levels corresponded well and both indicated a significant increase
in Af.
changes in Af tissue. We demonstrated the re-programming of myosin regulatory light
chain isoform composition with a significant increase of its ventricular isoform
(MLC-2V).
Key words atrial fibrillation, cDNA microarray, 2-D PAGE, mass spectrometry,
Introduction
Atrial fibrillation (Af) is the most common tachyarrhythmia in humans. There is
evidence showing that Af begets Af and through this vicious cycle Af becomes
incessant.1 During the natural course of Af, atrial myocytes undergo functional as well
as structural changes and these changes contribute to further Af. Among these changes,
alterations in gene expression with subsequent changes in protein levels are a
common way of adaptation to stress conditions. Past studies also showed that there
are changes at mRNA and protein levels of ion channels, calcium handling proteins,
receptors and so on.2-5 However, most studies focused only on a limited number of
selected candidate genes. In the present study, we investigated the alterations of
mRNAs and proteins from a global point of view. For changes in mRNA levels,
cDNA microarray techniques were used to screen thousands of genes. For changes in
protein levels, two-dimensional protein electrophoresis techniques as well as mass
spectrometric analysis were applied. With these techniques, we were able to screen
the changes of thousands of genes in Af tissue in genomic and proteomic views.6-7
Materials and Methods
Porcine model of Af
The porcine model of atrial fibrillation has been reported in detail previously.8 In
total, there were twelve adult pigs of Yorkshire-Landrace strain used (6 in the Af
81 kg). Under intravenous anesthesia by thiamylal (2-3 mg/kg) (Kyorin
Pharmaceutical Co., Tochigi, Japan), all animals were transvenously implanted with a
high-speed pacemaker (Itrel-III, Medtronic, Minneapolis, MN, USA). The pacemaker
was pacing the atria at a rate of 600 beats per minute in the Af group for four weeks.
After four weeks of continuous pacing, the atrial pacemaker was turned off and the
pigs were in Af. The pigs were sacrificed 2 weeks after turning of the pacemaker and
the total duration of rapid atrial depolarization was 6 weeks. For the control group, the
pacemaker remained off for 6 weeks after the implantation. Transmural tissue blocks
were obtained from the right atria free wall and left atrial free wall.
RNA isolation
Total cellular RNA extraction was performed immediately after obtaining the
atrial tissue. The tissue was homogenized with a Polytrone-Aggregate (Dispergier-und
Mischtechnik, Switzerland) and Trizol solution (Gibco BRL, Grand Island, NY, USA)
was added for RNA extraction.
DNA microarray experiments
Fluorescently labeled cDNA probes were generated by reverse transcription of
total cellular RNA isolated from Af or control atrial tissue in the presence of Cy5 or
Cy3 dCTP respectively (Amersham, Piscataway, NJ, USA). The probes were applied
to microarrays containing 6035 human cDNA clones (UniversoChip,
AsiaBioinnovations Corporation, Newark, CA, USA) for hybridization. The
fluorophores with a scanning laser read at wavelength of 635nm (for Cy5) and 525nm
(for Cy3) respectively.
Two-dimensional polyacrylamide protein electrophoresis (2D-PAGE)
Left atrial tissue was lyophilized for 48 hours and then crushed in a mortar
containing liquid nitrogen. One mg tissue power was homogenized in a 200µl sample buffer (7 urea, 2M thiourea, 4% CHAPS, 65mM DTT). Isoelectric focusing was
performed using immobilized pH gradient strips (Pharmacia, Uppsala, Sweden),
which had a pH range 4~7. A gradient of 300-3500 V was applied to the strips
followed by constant 3500 V, with focusing complete after 120KVh. Equilibrated
strips were inserted onto a 9~16% vertical gradient SDS-PAGE for 5 hours at 20
mA/gel for second dimension separation. After electrophoresis, the gel was silver
stained. The image was scanned and analyzed using Melanie III (GeneBio, Geneva,
Switzerland). Parallel gels were silver stained in the absence of glutaraldehyde for
further mass spectrometric analysis.
Mass spectrometry (MS) analysis
The excised gel pieces were first destained in the destaining solution containing
15 mM potassium ferricyanide and 50 m sodium thiosulfate. After washing in 25 mM
NH4HCO3, the gels were subjected to reduction, pyridylethylation and tryptic
digestion as described by Tsay et al.9 Multiple peptide sequences were determined in a
single run by capillary reverse phase chromatography directly coupled to a liquid
CA, USA) equipped with a standard electrospray source. The ion trap MS was
programmed to acquire three successive scan modes consisting of full-scan MS over
the range 395-1650 m/z, followed by two data-dependent scans on the most abundant
ion in those full scans. The first automatically acquired a high-resolution (zoom) scan
for determination of the charge state; the second (MS/MS) scan gathered the peptide
sequence information. The MS/MS spectra were acquired with a relative collision
energy of 35 and an isolation width of 2.5 Da. Interpretation of the resulting MS/MS
spectra was facilitated by database correlation with the algorithm SEQUEST.10
Reverse transcription (RT), polymerase chain reaction (PCR) and DNA
sequencing
We performed RT-PCR to obtain the deduced amino acid sequence of porcine
MLC-2V. The primer pair was designed according to the consensus sequence of
human, canine and rat MLC-2V. The forward primer was
5’-GAGGCAGTGCTGGGTCCTTT and the reverse primer was
5’-CCACCCAGGCTGCAAAGAAG. The reaction was carried out with a denaturing
temperature of 95oC, annealing temperature of 55oC and extension temperature of
72oC for 35 cycles. The size of the product was confirmed by agarose gel
electrophoresis and DNA sequencing reaction was performed using Big Dye
Terminator chemistry on a 377 ABI PRISM DNA sequencer (Perkin-Elmer, Wellesley,
Quantitative real time RT-PCR
Quantitativereal-time RT-PCR was used to measure the relative mRNA amount
of MLC-2V in porcine and human left atrial samples.Triplicate aliquots of each RNA
sample were used in the reactions. Glyceraldehyde-3-phosphate dehydrogenase
(GAPDH) was used as the internal control. One-step real-time RT-PCR was
performed using TaqMan PCR Master Mix reagent kit (Perkin-Elmer Applied
Biosystems, Foster City, CA). All reactions were carried out in 50-µl volumes
containing0.5 µl of RNaseOUT RNase inhibitor, 50 ng of sample RNA, each forward
and reverse primer in 300nM and fluorescently labeled probes in 250nM (Table 1).
Reactions were performed in the Perkin-Elmer ABI Prism7700 sequence detection
system. We recorded the threshold cycle value (CT), which representsthe cycle at
which a statistically significant increase in thenormalized reporter signal above a
chosen threshold canfirst be detected, according to the manufacturer’s manual. The
∆∆CT method was used to quantify the MLC2V mRNA and GAPDH.11 A relative expression value of MLC2V to GAPDH was obtained. Fold differences were
calculatedby dividing the mean of Af samples by the normal samples.
Statistical analyses
For cDNA microarray experiments, a foreground over background ratio of more
than 1.5 was considered a significant expression12 and genes without significant
expression intensities were represented by foreground intensities subtracting
background intensities. The intensities were further normalized to the mean intensity
of all genes on the same slide. Differential expression values were calculated as the
ratio of Cy5 to Cy3 intensities (Af to control). One sample t test was used to calculate
the p value of whether the ratio was different from the unit. A significant increase or
decrease of gene expression was defined as a ratio >2.5 or < 0.4 (2.5 fold increase or
decrease) together with a p value < 0.05.12
To examine if the Af tissue had a distinct gene expression pattern, hierarchical
analysis was performed using the Cluster and Treeview program by Eisen et al.13
Parametric data were compared between the Af and control groups using
Student’s t test. A p value < 0.05 was considered statistically significant.
Results
Of the twelve pigs, 6 pigs with active pacing for 4 weeks all showed Af at the
end of pacing. The Af persisted after turning off the pacemaker for 2 weeks until they
were sacrificed. For the other 6 pigs with shamed-operation, sinus rhythm was
observed 4 weeks after the operation. These pigs had sinus rhythm through out the
study period.
Differences in gene expression in Af
Among the 6053 genes, 387 genes showed a significant change of expression
2.5 (Cy5/Cy3 >2.5) and 285 showed a fold of change less than 0.4 (Cy3/Cy5>2.5). In
the right atrium, there were 81 genes showing a significant change, with 40 showing a
significant increase and 41 showing a significant decrease. Among the 81 genes
showing a significant change in the right atrium, 39 genes also showed a significant
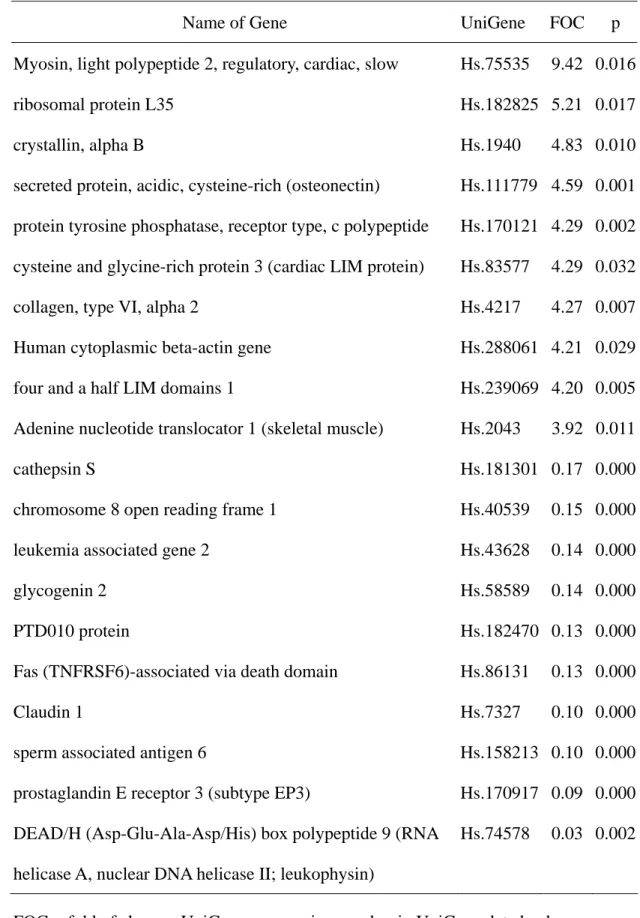
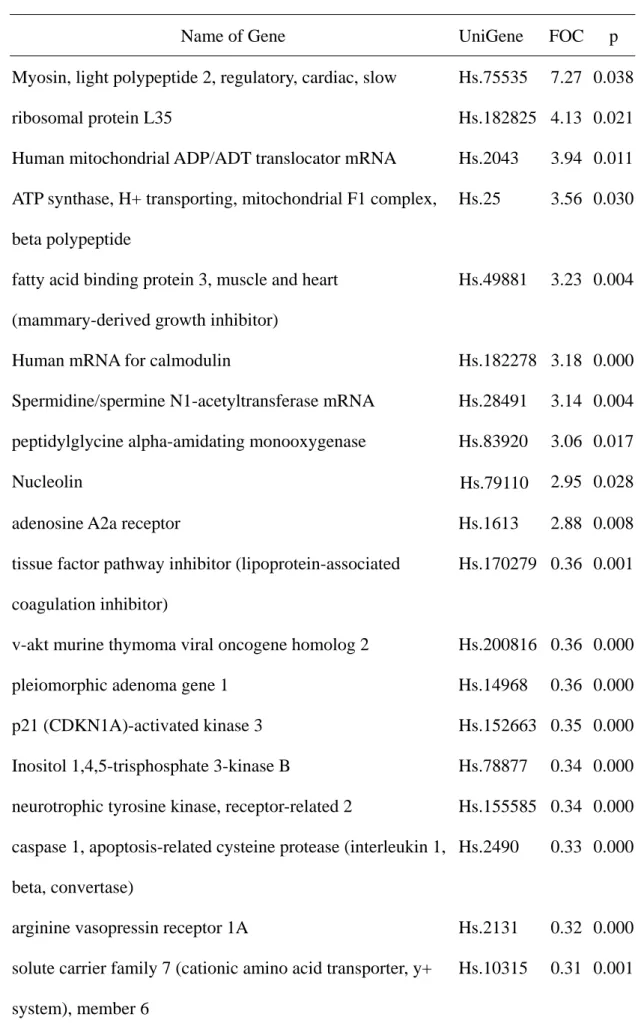
change concordantly in the left atrium (Table 2). Table 3 and 4 show the 10 most
significantly upregulated and downregulated genes in the left and right atria
respectively. Since there were more genes showing significant change in the left
atrium, we performed clustering analysis for the gene expression changes in the left
atrium. Figure 1 shows the dendrogram of the results of hierarchical analysis in the
left atrium. The brightness of the bars in the figure denotes the level of expression.
Through the visual display in Figure 1, it is evident that the expression patterns were
similar for pigs in the same group (Af group or control group) and the Af tissue had
distinct gene expression patterns from control tissues.
Expression patterns in functional categories
Genes were classified into 7 functional categories according to the biological
function of the encoded protein using a previously established classification scheme.14
Figure 2 shows the number of significantly changed genes by different functional
categories. The genes involved in cell signaling/communication outnumbered the
genes in other category. Genes involved in transcription/translation regulation had the
second largest number of genes. Table 5 and 6 list the genes with significant change in
2D-PAGE and MS analysis
Figure 3 shows representative results of the 2D-PAGE. The protein pattern was
consistent in all twelve gels and the pattern was also similar to previous published
human atrial tissue 2D-PAGE images. With regard to the changes in the gels, an
obvious change could be detected by visual inspection, as indicated by arrows in
Figure 3. These protein spots were at PI 4.5 to 5.0 with molecular weights about 18 to
20 kD. The total optical density number of the three protein spots was significantly
higher in the Af group than in the control group (1.35±0.53 vs 0.39±0.52, in arbitrary
unit, p < 0.01). To identify the nature of the three protein spots, these protein spots
were cut from the gel and subjected to mass spectrometry analysis. The amino acid
sequences of four peptide fragments were obtained. A BLASTp search result showed
that all the four fragments matched with the ventricular isoform of myosin regulatory
light chain (MLC-2V) (Fig. 4). Therefore, the three spots were all MCL-2V probably
with different degrees of phosphorylation.
Because the ventricular isoform of the MLC-2 was significantly increased in pigs
with Af, we also calculated the MLC-2V/MLC-2A ratio using total optical density
number of both proteins in the 2D-PAGE. We found that the ratio was significantly
increased in the Af group (0.85±0.54 vs 0.16±0.17, p<0.014).
RT-PCR and DNA sequencing
Agarose gel electrophoresis of the RT-PCR products for MLC-2V showed a
and the base sequence of the coding region of MLC-2V was obtained. The sequence
was deposited in GenBank with an accession number of AF513016. When translated
to protein, the deduced amino acid sequence was 97% homologous to canine MLC-2V,
96% to human MLC-2V, 95% to rat MLC-2V and 93% to mouse MLC-2V. Figure 4
shows the alignment of the MLC-2V amino acid sequence among different species
with the 4 peptidal fragments identified by MS in rectangles.
Quantitative real time RT-PCR
Quantitative real time RT-PCR was performed to confirm the change of MLC-2V
mRNA in porcine tissue. The fold of change was 8.72 (p< 0.036), which was very
similar to that detected in microarray studies (9.24, p <0.016).
.
Discussion
Recent bio-technological advances in DNA microarray and 2D-PAGE have made
it possible to investigate the changes of mRNAs and proteins of thousands of genes
simultaneously. In the present study, we successfully applied these techniques to
profile the changes in Af tissue. We showed that Af tissue had distinct gene expression
patterns after 6 weeks of rapid atrial depolarization. We also identified MLC-2V as
the most significantly changed gene at both mRNA and protein levels. The changes of
MLC-2V mRNA were further confirmed by quantitative real time RT-PCR in porcine
and human left atrial tissues. To the best of our knowledge, this is the first report to
In the cDNA microarray study, we found that the changes in the left atrium were
more prominent than those in the right atrium, though there was considerable overlap.
The reason why the left atrium had more significantly changed genes was not clear.
However, we propose some possible mechanisms. First, it has been reported that the
left atrium has a shorter cycle length than the right atrium during Af. This means that
the left atrium was excited at an even faster rate than the right atrium during Af.
Second, Af with rapid ventricular rate might induce heart failure and increased left
ventricular end diastolic pressure. This pressure might cause increased left atrial
stretch and contribute to more gene expression changes.
Comparison with other studies on changes in Af
The present study has several unique features when compared with previous
studies. First, thousands of genes were screened simultaneously. Previous studies
focused on only a limited number of genes with a candidate gene approach. With such
an approach, only genes involving known related pathways were chosen. Furthermore,
we investigated the changes in Af tissue at a relatively early stage of Af (6 weeks) as
compared to many clinical studies. Clinical investigations are usually performed at a
late stage of disease because atrial tissues are usually obtained during open heart
surgery when the patients have medical refractory conditions. However, Af was
induced by rapid atrial pacing in the present study. It is possible that the
pathophysiological pathways are different from clinical Af, which is commonly
There are many past studies that focus on the changes in ion channels because Af
is a disease of electric impulse generation and propagation. Among the studies on ion
channels, downregulation of L-type calcium channel is the most reproducibly reported
one. It is directly linked to the shortening of the atrial effective refractory period and
plays important roles in the perpetuation of Af. In comparison to these studies, we
also found that the mRNA of the pore-forming subunit (α1C subunit) of the L-type calcium channel was significantly reduced in the left atrium (fold of change = 0.37, p
< 0.05) and borderlinely reduced in the right atrium (fold of change = 0.51, not < 0.4
but p < 0.05). This finding is consistent with those in previous studies.3,16,17 In
addition, we further identified a substantial number of altered genes regarding cell
signaling/communication and transcription/translation regulation (protein/gene
expression). The findings might suggest that changes in regulatory genes occur
relatively early in Af and these changes have rarely been reported before. The changes
in cell signaling/communication and transcription/translation regulation in Af may be
fundamental and deserve future investigations.
Myosin light chain 2-V
Microarray studies identified MLC-2V as the most significantly upregulated
gene. However, identifying MLC-2V as the increased protein was not straightforward.
We first identified three protein spots with a significant increase in 2D-PAGE.
However, further analysis was hampered because the data bank of porcine proteins is
MLC-2V as the protein spots. We further used molecular cloning techniques to solve
the porcine MLC-2V cDNA coding sequences and protein sequences.
MLC-2 is also named as the regulatory light chain because phosphorylation of
this protein modifies force development muscle. In cardiac myocyte shortening, it has
been demonstrated that cardiac MLC-2 phosphorylation produces a dramatic increase
in the sensitivity of tension development to increasing extra-cellular calcium
concentrations.18 MLC-2 proteins are encoded by a multiple gene family, giving rise
to a number of isoforms that are expressed in a tissue specific manner. In adult atrial
tissue, the MLC-2A is the atrial isoform while the ventricle contains the ventricular
isoform (MLC-2V). In the present study, we demonstrated an alteration of the MLC-2
isoform composition in fibrillating atrial tissue. There was a dramatic increase of the
MLC-2V mRNA in the atrial tissue (9.42 and 7.27 fold increase in LA and RA
respectively) while the MLC-2A mRNA was only mildly elevated (2.61 and 2.56 fold
increase in LA and RA respectively). As to the protein level, the MLC-2V protein
amount increased significantly while MLC-2A showed no significant change (Fig 3).
This resulted in a much higher MCL-2V/MLC-2A ratio. Since MLC-2 is an important
regulator of muscle contraction, the alteration in isoform composition should have
important functional implication in Af. In a report on experiments on transgenic mice,
the total replacement of MLC-2A with MLC-2V resulted in an enhanced contractility
and decreased amplitude of calcium transient in atrial myocytes.19,20 The cross bridge
composition has also been reported in spontaneous hypertensive rats as well as in
human right atria from patients with various kinds of heart disease.21,22 With the
reprogramming of MLC-2 isoform expression in Af, we expect changes in contractile
force and cross bridge cycling properties, which might be important in the
pathogenesis of Af. However, with only limited studies in small animals with this
regard, the functional consequence and clinical significance of this alteration in Af
deserve further investigation.
Limitations
We used human cDNA microarrays to profile the gene expression pattern in
porcine myocardial tissue. Although interspecies cross reactivity has been reported,23
as yet there were no specific data available regarding human and porcine cross
reactivity. In microarray studies using cDNA clones greater than 100 base pairs (not
oligonucleotides), the binding of probes and clones are similar to Southern and
Northern blotting techniques, in which interspecies cross reactivity is well known.
Pulmonary venous tissue is important in the initiation or maintenance of atrial
fibrillation.24 Unfortunately, the tissue sample collected did not include pulmonary
venous tissue. We believe that future research to profile the pulmonary venous tissue
gene expression pattern will be very important.
Functional studies regarding the consequences of myosin regulatory light chain
isoform reprogramming were not performed in the present study. The cDNA
advantage of ready to go sequence information for further study. However, novel
genes with significant changes could not be found. The cDNA microarray and
2D-PAGE techniques are high through-put screening methods. These screening
investigations provide a list of potentially important genes and protein spots. For the
genes or spots identified with significant changes, further investigations are needed to
confirm the changes as well as to explore the functional and therapeutic importance of
the changes. Expression information itself is not sufficient to establish a
pathophysiological pathway critical to Af. However, the database provided here is
very useful in generating a testable hypothesis.
The data in the present manuscript represent changes observed after 6 weeks of
rapid atrial depolarization. A time course information is not provided. It is possible
that a transient change at an earlier stage may have been missed in the present study.
Acknowledgement
We appreciate excellent technical help from Ms. Lilian Chung and Ms. Mu-Ying
Kuo. The GAPDH probe for quatitative real time RT-PCR was a generous gift from
References
1. Wijffels MC, Kirchhof CJ, Dorland R, Power J, Allessie MA.. Atrial fibrillation
begets atrial fibrillation. A study in awake chronically instrumented goats.
Circulation 1995;92:1954-68.
2. Lai LP, Su MJ, Lin JL, Tsai CH, Lin FY, Chen YS, Hwang JJ, Huang SKS,
Tseng YZ, Lien WP. Measurement of funny current (If) channel mRNA in
human atrial tissue: correlation with left atrial filling pressure and atrial
fibrillation. J Cardiovasc Electrophysiol 1999;10:947-53.
3. Lai LP, Su MJ, Lin JL, Lin FY, Tsai CH, Chen YS, Huang SKS, Tseng YZ, Lien
WP. Down-regulation of L-type calcium channel and sarcoplasmic reticular
Ca(2+)-ATPase mRNA in human atrial fibrillation without significant change in
the mRNA of ryanodine receptor, calsequestrin and phospholamban: an insight
into the mechanism of atrial electrical remodeling. J Am Coll Cardiol
1999;33:1231-7.
4. Goette A, Arndt M, Rocken C, Spiess A, Staack T, Geller JC, Huth C, Ansorge S,
Klein HU, Lendeckel U. Regulation of angiotensin II receptor subtypes during
atrial fibrillation in humans. Circulation 2000;101:2678-81.
5. Grammer JB, Zeng X, Bosch RF, Kuhlkamp V. Atrial L-type Ca2+-channel,
beta-adrenoreceptor, and 5-hydroxytryptamine type 4 receptor mRNAs in human
6. Duggan DJ, Bittner M, Chen Y, Meltzer P, Trent JM. Expression profiling using
cDNA microarrays. Nat Genet 1999;21:10-4.
7. Klose J, Kobalz U. Two-dimensional electrophoresis of proteins: an updated
protocol and implications for a functional analysis of the genome.
Electrophoresis 1995;16:1034-59.
8. Lin JL, Lai LP, Lin CS, Du CC, Wu TJ, Chen SP, Lee WC, Yang PC, Tseng YZ,
Lien WP, Huang SKS. Electrophysiological mapping and histological
examinations of the swine atrium with sustained (≧24 h) atrial fibrillation: a
suitable animal model for studying atrial fibrillation. Cardiology 2003;99:78-84.
9. Tsay YG, Wang YH, Chiu CM, Shen BJ, Lee SC. A strategy for identification and
quantitation of phosphopeptides by liquid chromatography/tandem mass
spectrometry. Anal Biochem 2000;287:55-64.
10. Eng JK, McCormick AL, Yates JR. An approach to correlate tandem mass
spectral data of pep-tides with amino acid sequences in a protein database. J Am
Soc Mass Spectrom 1994;5:976-89.
11. Winer J, Jung CK, Shackel I, Williams PM. Development and validation of
real-time quantitative reverse transcriptase-polymerase chain reaction for
monitoring gene expression in Cardiac myocytes in vitro. Analytical
12. Hwang JJ, Allen PD, Tseng GC, Lam CW, Fananapazir L, Dzau VJ, Liew CC.
Microarray gene expression profiles in dilated and hypertrophic cardiomyopathic
end-stage heart failure. Physiol Genomics 2002;10:31-44.
13. Eisen MB, Spellman PT, Brown PO, Botstein D. Cluster Analysis and Display of
Genome-Wide Expression Patterns. Proc Natl Acad Sci 1998;95:14863-8.
14. Adams MD, Kerlavage AR, Fleischmann RD, Fuldner RA, Bult CJ, Lee NH,
Kirkness EF, Weinstock KG, Gocayne JD, White O, Sutton G, Blake JA, Brandon
RG, Chiu MW, Clayton RA, Cline RTt, Cotton MDd, Earlehughes J, Fine LDd,
Fitzgerald LMm, Fitzhugh WM, Fritchman JLl, Geoghagen NSM, Glodek A,
Gnehm CL, Hanna MC, Hedblom E, Hinkle PS, Kelley JM, Klimek KM, Kelley
JC, Liu LI, Marmaros SM, Merrick JM, Morenopalanques RF, Mcdonald LA,
Nguyen DT, Pellegrino SM, Phillips CA, Ryder SE, Scott JL, Saudek DM,
Shirley R, Small KV, Spriggs TA, Utterback TR, Weldman JF, Li Y, Barthlow R,
Bednarik DP, Cao LA, Cepeda MA, Coleman TA, Collins EJ, Dimke D, Feng P,
Ferrie A, Fischer C, Hastings GA, He WW, Hu JS, Huddleston KA, Greene JM,
Gruber J, Hudson P, Kim A, Kozak DL, Kunsch C, Ji HJ, Li HD, Meissner PS,
Olsen H, Raymond L, Wei YF, Wing J, Xu C, Yu GL, Ruben SM, Dillon PJ,
Fannon MR, Rosen CA, Haseltine WA, Fields C, Fraser CM, Venter JC. Initial
assessment of human gene diversity and expression patterns based upon 83
million nucleotides of cDNA sequence. Nature 1995;377(suppl):3-174.
remodeling during atrial fibrillation. Cardiovasc Res. 2002;54:230-46.
16. Van Gelder IC, Brundel BJ, Henning RH, Tuinenburg AE, Tieleman RG,
Deelman L, Grandjean JG, De Kam PJ, Van Gilst WH, Crijns HJ. Alteration in
gene expression of proteins involved in the calcium handling in patients with
atrial fibrillation. J Cardiovasc Electrophysiol 1999;10:552-60.
17. Brundel BJ, van Gelder IC, Henning RH, Tuinenburg AE, Deelman LE,
Tieleman RG, Grandjean JG, van Gilst WH, Crijns HJ. Gene expression of
proteins influencing the calcium homeostasis in patients with persistent and
paroxysmal atrial fibrillation. Cardiovasc Res 1999;42:443-54.
18. Moore RL, Musch TI, Cheung JY. Modulation of cardiac contractility by myosin
light chain phosphorylation. Med Sci Sports Exerc 1991;23:1163-9.
19. Buck SH, Konyn PJ, Palermo J, Robbins J, Moss RL. Altered kinetics of
contraction of mouse atrial myocytes expressing ventricular myosin regulatory
light chain. Am J Physiol 1999;276:H1167-71.
20. Pawloski-Dahm CM, Song G, Kirkpatrick DL, Palermo J, Gulick J, Dorn GW,
Robbins J, Walsh RA. Effects of total replacement of atrial myosin light chain-2
with the ventricular isoform in atrial myocytes of transgenic mice. Circulation
1998;97:1508-13.
21. Kumar C, Saidapet C, Delaney P, Mendola C, Siddiqui MA. Expression of
ventricular-type myosin light chain messenger RNA in spontaneously
22. Wankerl M, Bohm M, Morano I, Ruegg JC, Eichhorn M, Erdmann E. Calcium
sensitivity and myosin light chain pattern of atrial and ventricular skinned
cardiac fibers from patients with various kinds of cardiac disease. J Mol Cell
Cardiol 1990;22:1425-38.
23. Dong Y, Glasner JD, Blattner FR, Triplett EW. Genomic interspecies microarray
hybridization: rapid discovery of three thousand genes in the maize endophyte,
Klebsiella pneumoniae 342, by microarray hybridization with Escherichia coli
K-12 open reading frames. Appl Environ Microbiol 2001;67:1911-21.
24. Haissaguerre M, Jais P, Shah DC, Takahashi A, Hocini M, Quiniou G, Garrigue
S, Le Mouroux A, Le Metayer P, Clementy J. Spontaneous initiation of atrial
fibrillation by ectopic beats originating in the pulmonary veins. N Engl J Med
Legend to Figure
Figure 1: Dendrogram showing the gene expression patterns in the left atrial
tissue from 6 pigs with atrial fibrillation and 6 control pigs. The expression level
is represented by the brightness of the bars. Pigs with the most similar expression
patterns were linked by lines and positioned side by side. Relatedness was
calculated again for the next most similar expression patterns and the process
was repeated until all the pigs were positioned in the dendrogram. Through this
visual display, it is evident that the 6 pigs with atrial fibrillation had distinct gene
expression pattern from the 6 control pigs. AF = atrial fibrillation, SR = sinus
rhythm.
Figure 2: The number of significantly changed genes by different functional
categories. The genes involved in cell signaling/communication outnumbered the
genes in other categories. Genes involved in protein/gene expression had the
second largest number of genes.
Figure 3: Representative two-dimensional protein electrophoresis results by
silver stain. The two gels have similar patterns. The major differences are the
three protein spots (indicated by arrow heads) at PI 4.5 to 5.0 with molecular
Figure 4: Amino acid sequence of the porcine myosin regulatory light chain
ventricular isoform deduced from the sequencing results in RT-PCR product. The
regions in rectangulars represent the fragments identified by mass spectrometry.
Table 1. Base sequences of the primers and probes used for quantitative real-time reverse transcription-polymerase chain reaction
Sequence MLC2V
Forward primer AGGTGTCCCTCAGATCATTCTTG Reverse primer CAGGAATTTAAGGAGGCCTTCA
Probe (5'labeled-Fam) AAGCCATCCCTGTTCTGGTCCATGATG
GAPDH
Forward primer CAGCAATGCCTCCTGTACCA Reverse primer GATGCCGAAGTTGTCATGGA Probe (5'labeled-Vic) AACTGCTTGGCACCCCTGGCC
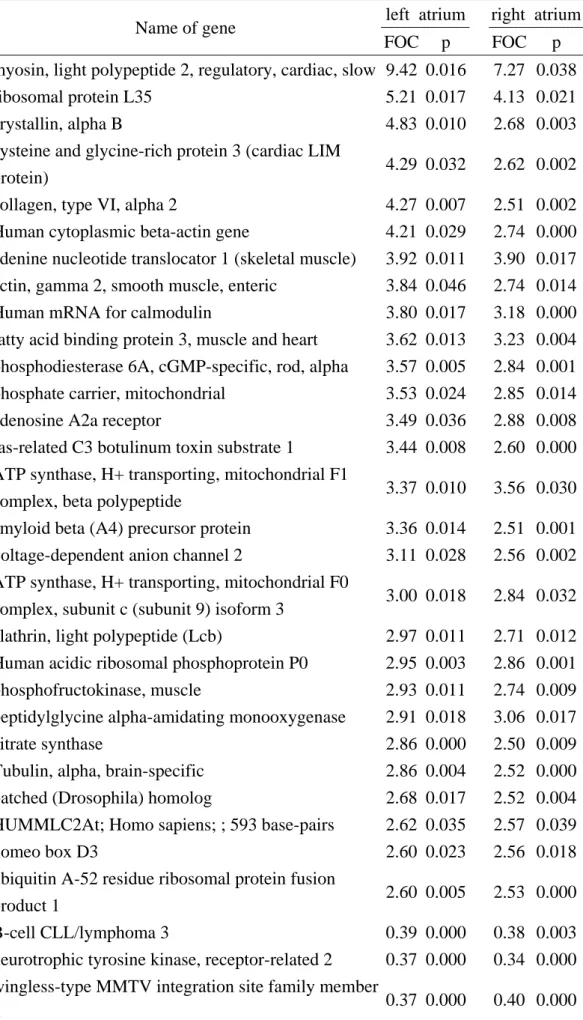
Table 2: Genes showing significant change in both left and right atrium
left atrium right atrium Name of gene
FOC p FOC p myosin, light polypeptide 2, regulatory, cardiac, slow 9.42 0.016 7.27 0.038 ribosomal protein L35 5.21 0.017 4.13 0.021 crystallin, alpha B 4.83 0.010 2.68 0.003 cysteine and glycine-rich protein 3 (cardiac LIM
protein) 4.29 0.032 2.62 0.002
collagen, type VI, alpha 2 4.27 0.007 2.51 0.002 Human cytoplasmic beta-actin gene 4.21 0.029 2.74 0.000 adenine nucleotide translocator 1 (skeletal muscle) 3.92 0.011 3.90 0.017 actin, gamma 2, smooth muscle, enteric 3.84 0.046 2.74 0.014 Human mRNA for calmodulin 3.80 0.017 3.18 0.000 fatty acid binding protein 3, muscle and heart 3.62 0.013 3.23 0.004 phosphodiesterase 6A, cGMP-specific, rod, alpha 3.57 0.005 2.84 0.001 phosphate carrier, mitochondrial 3.53 0.024 2.85 0.014 adenosine A2a receptor 3.49 0.036 2.88 0.008 ras-related C3 botulinum toxin substrate 1 3.44 0.008 2.60 0.000 ATP synthase, H+ transporting, mitochondrial F1
complex, beta polypeptide 3.37 0.010 3.56 0.030 amyloid beta (A4) precursor protein 3.36 0.014 2.51 0.001 voltage-dependent anion channel 2 3.11 0.028 2.56 0.002 ATP synthase, H+ transporting, mitochondrial F0
complex, subunit c (subunit 9) isoform 3 3.00 0.018 2.84 0.032 clathrin, light polypeptide (Lcb) 2.97 0.011 2.71 0.012 Human acidic ribosomal phosphoprotein P0 2.95 0.003 2.86 0.001 phosphofructokinase, muscle 2.93 0.011 2.74 0.009 peptidylglycine alpha-amidating monooxygenase 2.91 0.018 3.06 0.017 citrate synthase 2.86 0.000 2.50 0.009 Tubulin, alpha, brain-specific 2.86 0.004 2.52 0.000 patched (Drosophila) homolog 2.68 0.017 2.52 0.004 HUMMLC2At; Homo sapiens; ; 593 base-pairs 2.62 0.035 2.57 0.039 homeo box D3 2.60 0.023 2.56 0.018 ubiquitin A-52 residue ribosomal protein fusion
product 1 2.60 0.005 2.53 0.000
B-cell CLL/lymphoma 3 0.39 0.000 0.38 0.003 neurotrophic tyrosine kinase, receptor-related 2 0.37 0.000 0.34 0.000 wingless-type MMTV integration site family member
meningioma expressed antigen 6 0.36 0.000 0.38 0.000 carnitine palmitoyltransferase II 0.35 0.000 0.40 0.000 pleiomorphic adenoma gene 1 0.35 0.000 0.36 0.000 selectin L (lymphocyte adhesion molecule 1) 0.35 0.000 0.36 0.000 guanylate binding protein 2 0.35 0.000 0.38 0.000 caspase 1, apoptosis-related cysteine protease 0.33 0.000 0.33 0.000 Human translation initiation factor eIF-2alpha 0.32 0.000 0.37 0.000 guanylate cyclase 1, soluble, beta 3 0.29 0.000 0.38 0.001 FOC = fold of change.
Table 3: The ten most up- and down-regulated genes in the left atrium
Name of Gene UniGene FOC p
Myosin, light polypeptide 2, regulatory, cardiac, slow Hs.75535 9.42 0.016
ribosomal protein L35 Hs.182825 5.21 0.017
crystallin, alpha B Hs.1940 4.83 0.010
secreted protein, acidic, cysteine-rich (osteonectin) Hs.111779 4.59 0.001
protein tyrosine phosphatase, receptor type, c polypeptide Hs.170121 4.29 0.002
cysteine and glycine-rich protein 3 (cardiac LIM protein) Hs.83577 4.29 0.032
collagen, type VI, alpha 2 Hs.4217 4.27 0.007
Human cytoplasmic beta-actin gene Hs.288061 4.21 0.029
four and a half LIM domains 1 Hs.239069 4.20 0.005
Adenine nucleotide translocator 1 (skeletal muscle) Hs.2043 3.92 0.011
cathepsin S Hs.181301 0.17 0.000
chromosome 8 open reading frame 1 Hs.40539 0.15 0.000
leukemia associated gene 2 Hs.43628 0.14 0.000
glycogenin 2 Hs.58589 0.14 0.000
PTD010 protein Hs.182470 0.13 0.000
Fas (TNFRSF6)-associated via death domain Hs.86131 0.13 0.000
Claudin 1 Hs.7327 0.10 0.000
sperm associated antigen 6 Hs.158213 0.10 0.000
prostaglandin E receptor 3 (subtype EP3) Hs.170917 0.09 0.000
DEAD/H (Asp-Glu-Ala-Asp/His) box polypeptide 9 (RNA
helicase A, nuclear DNA helicase II; leukophysin)
Hs.74578 0.03 0.002
Table 4: The ten most up- and down-regulated genes in the right atrium
Name of Gene UniGene FOC p
Myosin, light polypeptide 2, regulatory, cardiac, slow Hs.75535 7.27 0.038
ribosomal protein L35 Hs.182825 4.13 0.021
Human mitochondrial ADP/ADT translocator mRNA Hs.2043 3.94 0.011
ATP synthase, H+ transporting, mitochondrial F1 complex,
beta polypeptide
Hs.25 3.56 0.030
fatty acid binding protein 3, muscle and heart
(mammary-derived growth inhibitor)
Hs.49881 3.23 0.004
Human mRNA for calmodulin Hs.182278 3.18 0.000
Spermidine/spermine N1-acetyltransferase mRNA Hs.28491 3.14 0.004
peptidylglycine alpha-amidating monooxygenase Hs.83920 3.06 0.017
Nucleolin Hs.79110 2.95 0.028
adenosine A2a receptor Hs.1613 2.88 0.008
tissue factor pathway inhibitor (lipoprotein-associated
coagulation inhibitor)
Hs.170279 0.36 0.001
v-akt murine thymoma viral oncogene homolog 2 Hs.200816 0.36 0.000
pleiomorphic adenoma gene 1 Hs.14968 0.36 0.000
p21 (CDKN1A)-activated kinase 3 Hs.152663 0.35 0.000
Inositol 1,4,5-trisphosphate 3-kinase B Hs.78877 0.34 0.000
neurotrophic tyrosine kinase, receptor-related 2 Hs.155585 0.34 0.000
caspase 1, apoptosis-related cysteine protease (interleukin 1,
beta, convertase)
Hs.2490 0.33 0.000
arginine vasopressin receptor 1A Hs.2131 0.32 0.000
solute carrier family 7 (cationic amino acid transporter, y+
system), member 6
Hs.10315 0.31 0.001
delta-isomerase 1
Table 5: Genes in the cell signaling/communication category showing significant changes in the left atrium
Name of Gene UniGene FOC p
crystallin, alpha B Hs.1940 4.83 0.010 apolipoprotein D Hs.75736 3.91 0.007 Human mRNA for calmodulin Hs.182278 3.80 0.017 thymosin, beta 4, X chromosome Hs.75968 3.80 0.016 S100 calcium-binding protein A1 Hs.255978 3.78 0.001
annexin A4 Hs.77840 3.67 0.014
adenosine A2a receptor Hs.1613 3.49 0.036 ras-related C3 botulinum toxin substrate 1 (rho family, small
GTP binding protein Rac1) Hs.173737 3.44 0.008 Human aminoacylase-1 (ACY1) Hs.334707 3.13 0.042 nuclear receptor subfamily 4, group A, member 1 Hs.1119 3.12 0.003 voltage-dependent anion channel 2 Hs.78902 3.11 0.028 connective tissue growth factor Hs.75511 3.03 0.040 ATP synthase, H+ transporting, mitochondrial F0 complex,
subunit c (subunit 9) isoform 3 Hs.429 3.00 0.018 Human malate dehydrogenase (MDHA) Hs.75375 2.92 0.031 H.sapiens mRNA for elongation factor-1-gamma Hs.256184 2.90 0.016 Human guanine nucleotide-binding protein G-s, alpha
subunit Hs.374523 2.81 0.026
creatine kinase, mitochondrial 2 (sarcomeric) Hs.80691 2.65 0.012 heterogeneous nuclear ribonucleoprotein A2/B1 Hs.75598 2.62 0.028 peroxisome proliferative activated receptor, delta Hs.106415 2.61 0.002 protease inhibitor 6 (placental thrombin inhibitor) Hs.41072 2.56 0.013 thymosin, beta 10 Hs.76293 2.55 0.013 thrombospondin 4 Hs.75774 2.54 0.013
phospholemman Hs.160318 2.51 0.000
CDC28 protein kinase 2 Hs.83758 0.40 0.000 insulin-like growth factor binding protein 3 Hs.77326 0.40 0.000 3-hydroxyisobutyryl-Coenzyme A hydrolase Hs.236642 0.40 0.000 frizzled (Drosophila) homolog 7 Hs.173859 0.40 0.000 nucleoporin 62kD Hs.247460 0.39 0.000
fibulin 2 Hs.198862 0.39 0.000
guanine nucleotide binding protein (G protein), beta
polypeptide 1 Hs.76064 0.39 0.000
B-cell CLL/lymphoma 3 Hs.31210 0.39 0.000 doublecortin and CaM kinase-like 1 Hs.21355 0.39 0.000 branched chain keto acid dehydrogenase E1, beta
tumor necrosis factor (ligand) superfamily, member 10 Hs.83429 0.38 0.000 golgi SNAP receptor complex member 2 Hs.100651 0.38 0.000 NIMA (never in mitosis gene a)-related kinase 2 Hs.153704 0.38 0.000 tumor necrosis factor receptor superfamily, member 10b Hs.258205 0.38 0.000 catenin (cadherin-associated protein), alpha-like 1 Hs.58488 0.38 0.000 neurotrophic tyrosine kinase, receptor-related 2 Hs.155585 0.37 0.000 calcium channel, voltage-dependent, L type, alpha 1C
subunit Hs.260083 0.37 0.000
PAK-interacting exchange factor beta Hs.172813 0.37 0.000 SEC22, vesicle trafficking protein (S. cerevisiae)-like 1 Hs.50785 0.37 0.000 Phosphatidic acid phosphatase type 2a Hs.41569 0.36 0.000 spondin 1, (f-spondin) extracellular matrix protein Hs.5378 0.36 0.000 solute carrier family 11 (proton-coupled divalent metal ion
transporters), member 2 Hs.261269 0.36 0.000 phosphoinositide-3-kinase, catalytic, gamma polypeptide Hs.32942 0.36 0.000 granzyme K (serine protease, granzyme 3; tryptase II) Hs.3066 0.36 0.000 leukemia inhibitory factor receptor Hs.2798 0.36 0.000 diacylglycerol kinase, delta (130kD) Hs.241489 0.35 0.000 3-hydroxyisobutyryl-Coenzyme A hydrolase Hs.236642 0.35 0.000 a disintegrin and metalloproteinase domain 12 (meltrin
alpha) Hs.266112 0.35 0.000
vaccinia related kinase 2 Hs.82771 0.35 0.000 thyroid hormone receptor interactor 6 Hs.119498 0.35 0.000 nuclear matrix protein p84 Hs.1540 0.35 0.000 Homo sapiens cytokine receptor related protein 4 (CYTOR4) Hs.259518 0.35 0.000 interferon, alpha-inducible protein (clone IFI-6-16) Hs.251988 0.35 0.000 guanylate cyclase 1, soluble, alpha 3 Hs.75295 0.35 0.000 selectin L (lymphocyte adhesion molecule 1) Hs.82848 0.35 0.000 guanine nucleotide binding protein (G protein), alpha
activating activity polypeptide, olfactory type Hs.154145 0.35 0.000 dual-specificity tyrosine-(Y)-phosphorylation regulated
kinase 2 Hs.250573 0.35 0.000
guanylate binding protein 2, interferon-inducible Hs.171862 0.35 0.000 pericentriolar material 1 Hs.75737 0.35 0.000 growth factor receptor-bound protein 14 Hs.83070 0.35 0.000 solute carrier family 6 (neurotransmitter transporter, GABA),
member 1 Hs.22003 0.35 0.000
nuclear receptor coactivator 2 Hs.256646 0.34 0.002 FK506-binding protein 5 Hs.7557 0.34 0.000 solute carrier family 5 (inositol transporters), member 3 Hs.253283 0.33 0.000 Homo sapiens Williams-Beuren syndrome chromosome Hs.21075 0.33 0.000
region 11 (WBSCR11) mRNA
transferrin receptor (p90, CD71) Hs.77356 0.33 0.000 polymerase (DNA-directed), alpha (70kD) Hs.81942 0.32 0.000 SRY (sex-determining region Y)-box 9 (campomelic
dysplasia, autosomal sex-reversal) Hs.2316 0.32 0.000 Homo sapiens genes encoding RNCC protein, DDAH
protein, Ly6-C protein, Ly6-D protein and immunoglobulin receptor
Hs.241586 0.31 0.000
GM2 ganglioside activator protein Hs.169476 0.31 0.000 solute carrier family 12 (sodium/potassium/chloride
transporters), member 2 Hs.110736 0.31 0.000 protein phosphatase, EF hand calcium-binding domain 1 Hs.254709 0.31 0.000 frizzled (Drosophila) homolog 1 Hs.94234 0.31 0.000 integrin, alpha 2 (CD49B, alpha 2 subunit of VLA-2
receptor) Hs.1142 0.30 0.000
retinoblastoma-binding protein 1 Hs.91797 0.30 0.000
grancalcin Hs.79381 0.30 0.000
solute carrier family 26 (sulfate transporter), member 2 Hs.29981 0.30 0.000
aquaporin 4 Hs.252151 0.29 0.000
RAS p21 protein activator (GTPase activating protein) 1 Hs.758 0.29 0.000 guanylate cyclase 1, soluble, beta 3 Hs.77890 0.29 0.000
thymopoietin Hs.250957 0.29 0.000
phosphorylase kinase, beta Hs.78060 0.29 0.000 transferrin receptor (p90, CD71) Hs.77356 0.28 0.000 natural killer cell receptor, immunoglobulin superfamily
member Hs.81743 0.28 0.000
serine/threonine kinase 17a (apoptosis-inducing) Hs.9075 0.27 0.000 hyaluronan-mediated motility receptor (RHAMM) Hs.258169 0.27 0.000 synaptosomal-associated protein, 23kD Hs.184376 0.27 0.000 protein phosphatase 2 (formerly 2A), regulatory subunit A
(PR 65), beta isoform Hs.108705 0.27 0.000 ras GTPase activating protein-like Hs.227806 0.26 0.000 gamma-aminobutyric acid (GABA) A receptor, alpha 2 Hs.91343 0.26 0.000 guanylate cyclase 1, soluble, alpha 3 Hs.75295 0.25 0.000 rab3 GTPase-activating protein, non-catalytic subunit
(150kD) Hs.197289 0.25 0.000
eukaryotic translation elongation factor 1 epsilon 1 Hs.172247 0.21 0.000 5-hydroxytryptamine (serotonin) receptor 2A Hs.256867 0.18 0.000 solute carrier family 5 (inositol transporters), member 3 Hs.172455 0.17 0.000
claudin 1 Hs.7327 0.10 0.000
prostaglandin E receptor 3 (subtype EP3) Hs.170917 0.09 0.000 FOC = fold of change; UniGene = accession number in UniGene data bank.
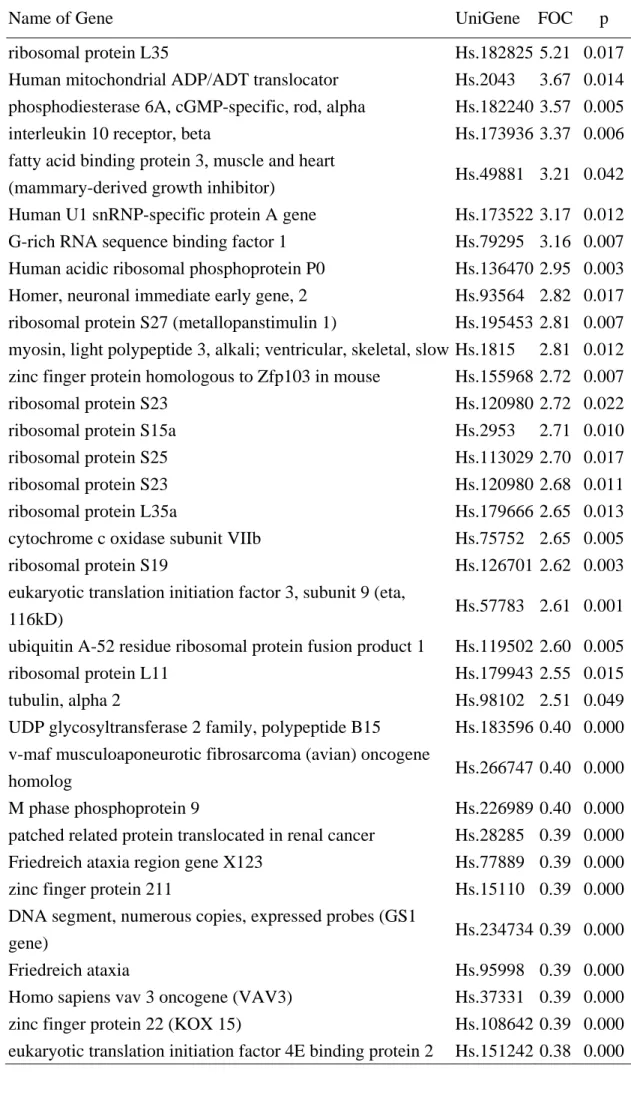
Table 6: Genes in the protein/gene expression category showing significant changes in the left atrium
Name of Gene UniGene FOC p
ribosomal protein L35 Hs.182825 5.21 0.017 Human mitochondrial ADP/ADT translocator Hs.2043 3.67 0.014 phosphodiesterase 6A, cGMP-specific, rod, alpha Hs.182240 3.57 0.005 interleukin 10 receptor, beta Hs.173936 3.37 0.006 fatty acid binding protein 3, muscle and heart
(mammary-derived growth inhibitor) Hs.49881 3.21 0.042 Human U1 snRNP-specific protein A gene Hs.173522 3.17 0.012 G-rich RNA sequence binding factor 1 Hs.79295 3.16 0.007 Human acidic ribosomal phosphoprotein P0 Hs.136470 2.95 0.003 Homer, neuronal immediate early gene, 2 Hs.93564 2.82 0.017 ribosomal protein S27 (metallopanstimulin 1) Hs.195453 2.81 0.007 myosin, light polypeptide 3, alkali; ventricular, skeletal, slow Hs.1815 2.81 0.012 zinc finger protein homologous to Zfp103 in mouse Hs.155968 2.72 0.007 ribosomal protein S23 Hs.120980 2.72 0.022 ribosomal protein S15a Hs.2953 2.71 0.010 ribosomal protein S25 Hs.113029 2.70 0.017 ribosomal protein S23 Hs.120980 2.68 0.011 ribosomal protein L35a Hs.179666 2.65 0.013 cytochrome c oxidase subunit VIIb Hs.75752 2.65 0.005 ribosomal protein S19 Hs.126701 2.62 0.003 eukaryotic translation initiation factor 3, subunit 9 (eta,
116kD) Hs.57783 2.61 0.001
ubiquitin A-52 residue ribosomal protein fusion product 1 Hs.119502 2.60 0.005 ribosomal protein L11 Hs.179943 2.55 0.015 tubulin, alpha 2 Hs.98102 2.51 0.049 UDP glycosyltransferase 2 family, polypeptide B15 Hs.183596 0.40 0.000 v-maf musculoaponeurotic fibrosarcoma (avian) oncogene
homolog Hs.266747 0.40 0.000
M phase phosphoprotein 9 Hs.226989 0.40 0.000 patched related protein translocated in renal cancer Hs.28285 0.39 0.000 Friedreich ataxia region gene X123 Hs.77889 0.39 0.000 zinc finger protein 211 Hs.15110 0.39 0.000 DNA segment, numerous copies, expressed probes (GS1
gene) Hs.234734 0.39 0.000
Friedreich ataxia Hs.95998 0.39 0.000 Homo sapiens vav 3 oncogene (VAV3) Hs.37331 0.39 0.000 zinc finger protein 22 (KOX 15) Hs.108642 0.39 0.000 eukaryotic translation initiation factor 4E binding protein 2 Hs.151242 0.38 0.000
Homo sapiens RNA cyclase homolog (RNAC) Hs.113052 0.38 0.000 ADP-ribosyltransferase (NAD+; poly (ADP-ribose)
polymerase)-like 1 Hs.77225 0.38 0.000 EGF-like-domain, multiple 5 Hs.5599 0.37 0.000 mutS (E. coli) homolog 5 Hs.257454 0.37 0.000 heterogeneous nuclear protein similar to rat helix
destabilizing protein Hs.249247 0.37 0.000 thyroid hormone receptor-associated protein, 240 kDa
subunit Hs.11861 0.37 0.000
matrix metalloproteinase 16 (membrane-inserted) Hs.90800 0.36 0.000 ret finger protein-like 3 antisense Hs.251045 0.36 0.000 zinc finger protein, X-linked Hs.2074 0.35 0.000 zinc finger protein 273 Hs.89732 0.35 0.000 pleiomorphic adenoma gene 1 Hs.14968 0.35 0.000 C3H-type zinc finger protein; similar to D. melanogaster
muscleblind B protein Hs.266010 0.35 0.000 transcriptional intermediary factor 1 Hs.183858 0.35 0.000
HMBA-inducible Hs.15299 0.34 0.000
DEAD/H (Asp-Glu-Ala-Asp/His) box polypeptide 16 Hs.266143 0.33 0.000 chromodomain helicase DNA binding protein 2 Hs.36787 0.33 0.001 fucosyltransferase 2 (secretor status included) Hs.46328 0.33 0.000 survival of motor neuron protein interacting protein 1 Hs.102456 0.33 0.000 CBF1 interacting corepressor Hs.89421 0.32 0.000 Human translation initiation factor eIF-2alpha mRNA,
3'UTR Hs.266313 0.32 0.000
Homo sapiens zinc-fingers and homeoboxes 1 (ZHX1),
mRNA Hs.12940 0.32 0.000
GTP cyclohydrolase 1 (dopa-responsive dystonia) Hs.86724 0.31 0.000
homeo box A2 Hs.58116 0.31 0.000
cAMP responsive element binding protein 1 Hs.79194 0.31 0.000 cofactor required for Sp1 transcriptional activation, subunit 2
(150kD) Hs.21586 0.31 0.000
DEAD/H (Asp-Glu-Ala-Asp/His) box polypeptide 21 Hs.266290 0.30 0.000 cyclic nucleotide gated channel alpha 1 Hs.1323 0.29 0.000 glial cells missing (Drosophila) homolog b Hs.227098 0.27 0.000 M phase phosphoprotein 10 (U3 small nucleolar
ribonucleoprotein) Hs.183418 0.27 0.000 zinc finger protein 23 (KOX 16) Hs.22182 0.27 0.000 general transcription factor IIIA Hs.75113 0.27 0.000 ribosomal protein S5 pseudogene 1 Hs.237225 0.25 0.000 Sp2 transcription factor Hs.77031 0.24 0.000
cAMP responsive element binding protein-like 2 Hs.13313 0.21 0.000 nucleophosmin (nucleolar phosphoprotein B23, numatrin) Hs.173205 0.20 0.000
glycogenin 2 Hs.58589 0.14 0.000