DOI 10.1007/s11419-006-0005-3
ORIGINAL ARTICLE
S.-M. Wang
Department of Forensic Sciences, Central Police University, Taoyuan, Taiwan
M.-Y. Wu · R.H. Liu (*)
Department of Medical Technology, Fooyin University, 151 Ching-Hsueh Road, Ta-Liao Hsiang, Kaohsiung Hsien 831, Taiwan
e-mail: rayliu@uab.edu R.J. Lewis · D.V. Canfield
Bioaeronautical Sciences Research Laboratory, FAA Civil Aerospace Medical Institute, Oklahoma City, OK, USA
Evaluation of isotopically labeled internal standards and methods
of derivatization for quantitative determination of cocaine and
related compounds
Sheng-Meng Wang · Meng-Yen Wu · Ray H. Liu Russell J. Lewis · Dennis V. Canfield
Received: 14 March 2006 / Accepted: 20 April 2006
© Japanese Association of Forensic Toxicology and Springer-Verlag Tokyo 2006
in the open literature and should be of routine reference value to forensic and clinical laboratories that are en-gaged in the analysis of these drugs/metabolites. Full-scan MS data were further used to select ion pairs with potential for designating the analytes and ISs in quanti-tative analysis protocols. The CC data of these ion pairs were evaluated using data collected under the selected ion-monitoring mode and summarized in table format. The data exhibited similar CC characteristics in each alkyl, acetyl, or TMS series. Among the potentially us-able ion pairs derived from a specific CD group, there was a trend that the ion pairs with higher mass showed better CC data. The CC data derived from the use of ISs labeled with more deuterium atoms were generally more favorable. These data should save enormous amounts of time and effort for practicing laboratories in their search for optimal analytical parameters.
Key words Cocaine · Benzoylecgonine · Cross
contribution · GC-MS · Quantitation · Derivatization
Introduction
Chemical derivatization (CD) of analytes with active functional groups is now a routine and universal step in preparing samples for gas chromatography-mass spec-trometric (GC-MS) analysis. Chemical derivatizations were traditionally carried out to (1) increase compatibil-ity with the chromatographic environment; (2) achieve required separation or resolution efficiency; (3) improve detection limit; and (4) facilitate structure elucidation [1]. With current emphasis in the quantitative determina-tion of drugs/metabolites adapting GC-MS protocols with isotopically labeled analogs of the analytes as inter-Abstract Gas chromatography-mass spectrometry
(GC-MS) is the preferred method for the analysis of drugs/ metabolites in biological specimens with use of iso-topically labeled analogs of the analytes as internal standards (ISs). An important aspect of the chemical derivatization (CD) for GC-MS analysis is that the CD products derived from the analyte and the selected IS must generate ions suitable for designating the analyte and the IS. These ions should not have significant cross contribution (CC), i.e., IS contribution to the intensities of the ions designated for the analyte, and vice versa. With this in mind, the authors have conducted a search of isotopically labeled analogs of commonly abused cocaine and related compounds (cocaine, norcocaine, benzoylecgonine, cocaethylene, ecgonine, ecgonine methyl ester, anhydroecgonine methyl ester) that are commercially available. These ISs and analytes were derivatized with various groups of reagents, and the CD products were analyzed by GC-MS. MS data are pre-sented in two forms: (1) systematic presentation of full-scan spectra; and (2) tabulation of CC data for ions with potential for designating the ISs and analytes. Many (if not most) of these full-scan spectra are not yet available
nal standards (ISs), an additional aspect associated with CD has to be addressed. Specifically, CD products of the analyte and the selected IS must generate ions suitable for specifically indicating the analyte and the IS; these ions must not have significant cross contribution (CC), i.e., contribution to the intensity of the ion designated for the analyte by the IS, and vice versa [2–5].
With this in mind, this study has been conducted to evaluate the CC phenomenon associated with the analy-sis of cocaine and cocaine-related compounds, including cocaine, norcocaine, benzoylecgonine, cocaethylene, ecgonine, ecgonine methyl ester, and anhydroecgonine methyl ester. These drugs/metabolites were included for the following two reasons: (1) these compounds are com-monly encountered in forensic and clinical laboratories; and (2) isotopically labeled analogs of these drugs/ metabolites are commercially available.
Materials and methods Standards and reagents
The following analytes and their respective deuterated
analogs, in methanol solution (1 mg or 100µg/ml), were
purchased from Cerilliant (Austin, TX, USA): cocaine,
cocaine-d3; norcocaine, norcocaine-d3; benzoylecgonine,
benzoylecgonine-d3, benzoylecgonine-d8; cocaethylene,
cocaethylene-d3, cocaethylene-d8; ecgonine, ecgonine-d3;
ecgonine methyl ester, ecgonine methyl ester-d3;
anhydroecgonine methyl ester, anhydroecgonine methyl
ester-d3. The exact structures of these compounds
are included in respective mass spectrum figures (Figs. 1–7)
The following CD reagents were purchased from Pierce Chemical (Rockford, IL, USA): trifluoroacetic anhydride (TFAA), pentafluoropropionic anhydride
0 50 100 50 100 150 200 250 300 350 Relative Int. (%) 303.1 272.1 105.0 198.1 182.1 82.0 77.0 H H O C O COOCH3 NCH3 Cocaine-d0 C17H21NO4 MW: 303.35 0 50 100 50 100 150 200 250 300 350 Relative Int. (%) m/z 105.0 201.1 306.1 185.1 77.0 275.1 85.1 CD3 N COOCH3 O C O H H Cocaine-d3 C17H18D3NO4 MW: 306.37 122.1 125.1 1-A-i 1-A-ii
Fig. 1 Mass spectra of cocaine (i) and its deuterated analog
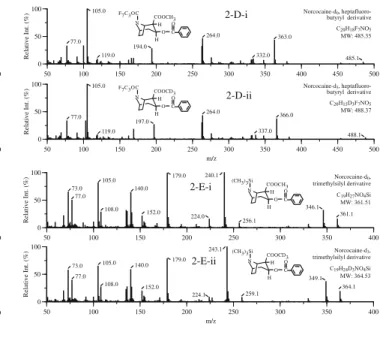
cocaine-d3 (ii) 0 50 100 50 100 150 200 250 300 Relative Int. (%) m/z 171.1 136.0 68.1 77.0 108.1 292.1 H H O C O COOCD3 N H Norcocaine-d3 C16H16D3NO4 MW: 292.34 105.0 0 50 100 50 100 150 200 250 300 Relative Int. (%) 136.0 168.1 68.0 77.0 108.0 289.1 H N COOCH3 O C O H H Norcocaine-d0 C16H19NO4 MW: 289.33 105.0 0 50 100 50 100 150 200 250 300 350 400 Relative int. (%) 263.1 77.1 194.1 105.1 164.1 232.1 Norcocaine-d0, trifluoroacetyl derivative C18H18F3NO5 MW: 385.33 H H O C O COOCH3 N F3COC 385.2 0 50 100 50 100 150 200 250 300 350 400 Relative int. (%) m/z 164.1 266.1 77.1 197.1 105.1 232.1 Norcocaine-d3, trifluoroacetyl derivative C18H15D3F3NO5 MW: 388.35 F3COC N COOCD3 OC O H H 388.1 0 50 100 50 100 150 200 250 300 350 400 450 Relative Int. (%) 119.1 313.1 77.1 166.1 105.1 214.1 194.1 226.1 Norcocaine-d0, pentafluoro-propionyl derivative C19H18F5NO5 MW: 435.34 F5C2OC N COOCH3 O C O H H 435.2 0 50 100 50 100 150 200 250 300 350 400 450 Relative Int. (%) m/z 316.1 77.1 226.1 105.1 214.1 119.1 197.1 169.1 Norcocaine-d3, pentafluoro-propionyl derivative C19H15D3F5NO5 MW: 438.36 H H O C O COOCD3 N F5C2OC 438.2 2-A-i 2-C-ii 2-A-ii 2-B-i 2-B-ii 2-C-i 0 50 100 50 100 150 200 250 300 350 400 450 500 Relative Int. (%) 363.0 105.0 194.0 77.0 264.0 332.0 Norcocaine-d0, heptafluoro-butyryl derivative C20H18F7NO5 MW: 485.35 H H O C O COOCH3 N F7C3OC 485.1 119.0 0 50 100 50 100 150 200 250 300 350 400 450 500 Relative Int. (%) m/z 105.0 366.0 337.0 264.0 197.0 77.0 Norcocaine-d3, heptafluoro-butyryl derivative C20H15D3F7NO5 MW: 488.37 F7C3OC N COOCD3 O C O H H 488.1 119.0 0 50 100 50 100 150 200 250 300 350 400 Relative Int. (%) 152.0 346.1 77.0 361.1 240.1 73.0 140.0 179.0 224.0 Norcocaine-d0, trimethylsilyl derivative C19H27NO4Si MW: 361.51 105.0 108.0 256.1 (CH3)3Si N COOCH3 O C O H H 0 50 100 50 100 150 200 250 300 350 400 Relative Int. (%) m/z 179.0 152.0 349.1 140.0 364.1 73.0 105.0 77.0 243.1 224.1 Norcocaine-d3, trimethylsilyl derivative C19H24D3NO4Si MW: 364.53 108.0 259.1 H H O C O COOCD3 N (CH3)3Si 2-D-i 2-D-ii 2-E-i 2-E-ii
Fig 2 Mass spectra of norcocaine (i) and its deuterated analog
norcocaine-d3 (ii). A Underivatized; B TFA-derivatized; C
PFP-derivatized; D HFB-PFP-derivatized; E TMS-derivatized. See text (Materials and methods) for derivatization abbreviations
0 50 100 50 100 150 200 250 300 350 Relative Int. (%) 303.1 272.0 105.0 198.1 182.1 82.0 77.0 Benzoylecgonine-d0, methyl derivative C17H21NO4 MW: 303.35 122.0 0 50 100 50 100 150 200 250 300 350 Relative Int. (%) 306.1 275.1 105.0 201.1 185.1 85.0 77.0 COOCH3 CD3 N O H H C O Benzoylecgonine-d3, methyl derivative C17H18D3NO4 MW: 306.33 123.0 0 50 100 50 100 150 200 250 300 350 Relative Int. (%) m/z 311.1 280.1 110.0 201.1 185.1 85.0 82.0 Benzoylecgonine-d8, methyl derivative C17H13D8NO3 MW: 311.29 D D D D D O C H H O NCD3 COOCH3 125.1 0 50 100 50 100 150 200 250 300 350 Relative Int. (%) 317.1 272.1 166.0 212.1 196.1 122.0 77.0 82.0 105.0 Benzoylecgonine-d0, ethyl derivative C18H23NO4 MW: 317.38 0 50 100 50 100 150 200 250 300 350 Relative Int. (%) 105.0 85.1 199.1 125.1 77.0 275.1 215.1 320.1 Benzoylecgonine-d3, ethyl derivative C18H20D3NO4 MW: 320.60 169.1 0 50 100 50 100 150 200 250 300 350 Relative Int. (%) m/z 325.1 199.1 110.0 82.1 215.1 125.1 280.1 85.1 Benzoylecgonine-d8, ethyl derivative C18H15D8NO4 MW: 325.56 169.1 COOCH3 O C H H O NCH3 CH3 N COOC2H5 O H H C O O C H H O COOC2H5 NCD3 D D D D D O C H H O NCD3 COOC2H5 3-A-i 3-A-ii 3-A-iii 3-B-i 3-B-ii 3-B-iii 0 50 100 50 100 150 200 250 300 350 400 450 Relative Int. (%) 421.2 316.1 105.1 272.2 300.2 82.1 77.1 Benzoylecgonine-d0, pentafluoro-1-propoxy derivative C19H20F5NO4 MW: 421.36 0 50 100 50 100 150 200 250 300 350 400 450 Relative Int. (%) 319.1 424.2 105.1 275.2 303.2 85.1 77.1 Benzoylecgonine-d3, pentafluoro-1-propoxy derivative C19H17D3F5NO4 MW: 424.34 0 50 100 50 100 150 200 250 300 350 400 450 Relative Int. (%) m/z 429.2 319.1 110.1 280.2 303.2 85.1 82.1 Benzoylecgonine-d8, pentafluoro-1-propoxy derivative C19H12D8F5NO4 MW: 429.30 0 50 100 50 100 150 200 250 300 350 400 450 Relative Int. (%) 164.0 334.0 318.0 82.0 77.0 272.1 439.1 COOCH(CF3)2 CH3 N O H H C O Benzoylecgonine-d0, hexafluoro-2-propoxy derivative C19H19F6NO4 MW: 439.35 105.0 148.0 0 50 100 50 100 150 200 250 300 350 400 450 Relative Int. (%) 337.0 105.0 167.0 321.1 85.1 77.0 275.1 442.1 COOCH(CF3)2 O C H H O NCD3 Benzoylecgonine-d3, hexafluoro-2-propoxy derivative C19H16D3F6NO4 MW: 442.33 151.0 0 50 100 50 100 150 200 250 300 350 400 450 Relative Int. (%) m/z 337.1 110.0 167.0 321.1 85.1 82.0 280.1 447.1 Benzoylecgonine-d8, hexafluoro-2-propoxy derivative C19H11D8F6NO4 MW: 447.29 COOCH(CF3)2 CD3 N O H H C O D D D D D 151.0 COOCH2C2F5 O C H H O NCH3 COOCH2C2F5 CD3 N O H H C O COOCH2C2F5 D D D D D O C H H O NCD3 3-E-i 3-E-ii 3-E-iii 3-F-i 3-F-ii 3-F-iii 0 50 100 50 100 150 200 250 300 350 Relative Int. (%) 331.2 272.2 105.1 226.2 210.2 82.1 77.1 COOC3H7 CH3 N O H H C O Benzoylecgonine-d0, propyl derivative C19H25NO4 MW: 331.41 122.1 0 50 100 50 100 150 200 250 300 350 Relative Int. (%) 334.2 275.2 105.1 229.2 213.2 77.1 85.1 COOC3H7 O C H H O NCD3 Benzoylecgonine-d3, propyl derivative C19H22D3NO4 MW: 334.39 125.1 0 50 100 50 100 150 200 250 300 350 Relative Int. (%) m/z 110.1 339.3 280.2 229.2 213.2 82.1 85.1 Benzoylecgonine-d8, propyl derivative C19H17D8NO4 MW: 339.35 D D D D D O C H H O NCD3 COOC3H7 125.1 0 50 100 50 100 150 200 250 300 350 400 Relative Int. (%) 122.0 240.1 105.0 272.1 224.1 82.0 77.0 345.1 COOC4H9 O C H H O NCH3 Benzoylecgonine-d0, butyl derivative C20H27NO4 MW: 345.44 166.0 0 50 100 50 100 150 200 250 300 350 400 Relative Int. (%) 105.0 243.1 348.1 275.1 227.1 85.1 77.0 COOC4H9 CD3 N O H H C O Benzoylecgonine-d3, butyl derivative C20H24D3NO4 MW: 348.42 125.1 169.0 0 50 100 50 100 150 200 250 300 350 400 Relative Int. (%) m/z 280.1 353.2 110.0 243.1 227.1 82.1 85.1 Benzoylecgonine-d8, butyl derivative C20H19D8NO4 MW: 353.38 125.1 169.0 COOC4H9 CD3 N O H H C O D D D D D 3-C-i 3-C-ii 3-C-iii 3-D-i 3-D-ii 3-D-iii 0 50 100 50 100 150 200 250 300 350 400 Relative Int. (%) 361.2 122.1 105.1 256.2 82.1 240.2 73.1 COOSi(CH3)3 CH3 N O H H C O Benzoylecgonine-d0, trimethylsilyl derivative C19H27NO4Si MW: 361.51 346.2 0 50 100 50 100 150 200 250 300 350 400 Relative Int. (%) 364.3 125.1 105.1 259.2 85.1 243.2 73.1 COOSi(CH3)3 O C H H O NCD3 Benzoylecgonine-d3, trimethylsilyl derivative C19H24D3NO4Si MW: 364.49 349.2 0 50 100 50 100 150 200 250 300 350 400 Relative Int. (%) m/z 369.3 125.2 110.1 259.2 85.1 243.2 73.1 Benzoylecgonine-d8, trimethylsilyl derivative C19H19D8NO4Si MW: 369.45 COOSi(CH3)3 CD3 N O H H C O D D D D D 354.3 0 50 100 50 100 150 200 250 300 350 400 450 Relative Int. (%) 403.2 346.1 204.0 282.1 82.0 73.0 105.0 179.0 COOSi(CH3)2C(CH3)3 O C H H O NCH3 Benzoylecgonine-d0, t-butyldimethylsilyl derivative C22H33NO4Si MW: 403.59 122.0 298.1 0 50 100 50 100 150 200 250 300 350 400 450 Relative Int. (%) 406.2 349.1 207.0 285.1 85.1 73.0 105.0 179.0 COOSi(CH3)2C(CH3)3 CD3 N O H H C O Benzoylecgonine-d3, t-butyldimethylsilyl derivative C22H30D3NO4Si MW: 406.57 125.1 301.1 0 50 100 50 100 150 200 250 300 350 400 450 Relative Int. (%) m/z 411.2 354.1 212.1 285.1 85.1 73.0 110.0 184.0 Benzoylecgonine-d8, t-butyldimethylsilyl derivative C22H25D8NO4Si MW: 411.53 D D D D D O C H H O NCD3 COOSi(CH3)2C(CH3)3 125.1 301.1 3-G-i 3-G-ii 3-G-iii 3-H-i 3-H-ii 3-H-iii
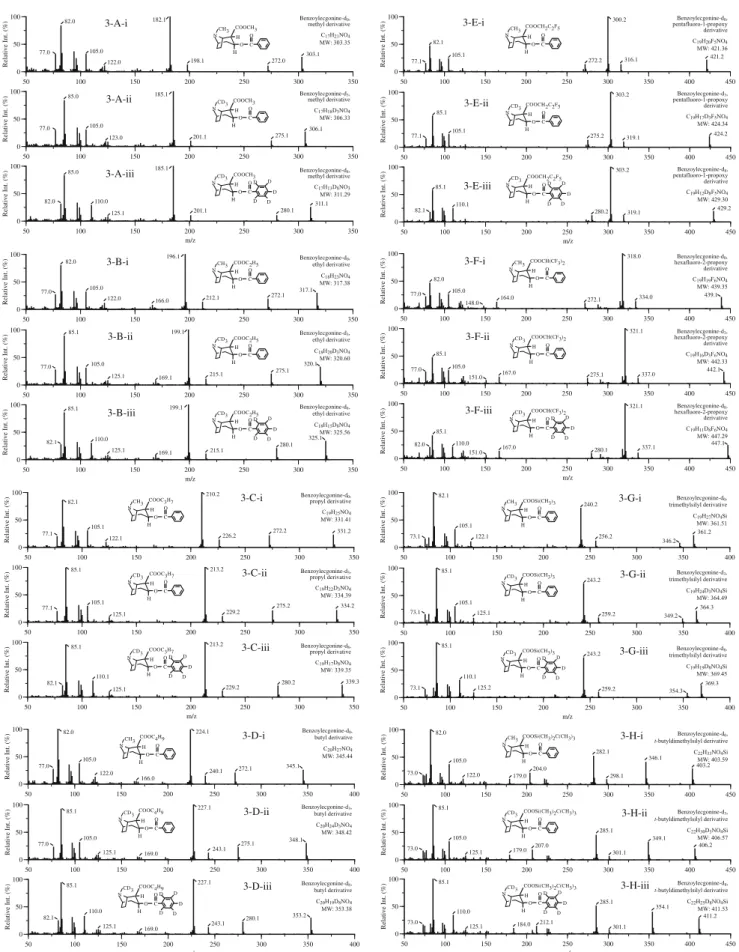
Fig. 3 Mass spectra of benzoylecgonine (i) and its deuterated
analogs benzoylecgonine-d3 (ii) and benzoylecgonine-d8 (iii). A
Methyl-derivatized; B ethyl-derivatized; C propyl-derivatized; D
butyl-derivatized; E PFPoxy-derivatized; F HFPoxy-derivatized;
G TMS-derivatized; H t-BDMS-derivatized. See text (Materials
agents and their sources are 2,2,3,3,3-pentafluoro-1-propanol (PFP-OH), 1,1,1,3,3,3-hexafluoro-2-2,2,3,3,3-pentafluoro-1-propanol (HFP-OH), iodoethane, and iodopropane: Acros Or-ganics (Geel, Belgium); iodomethane: Eastman Kodak (Rochester, NY, USA); iodobutane: Avocado Research (Heysham, Lancashire, UK); tetramethylammonium hydroxide (TMAH, 25% in methanol): Sigma-Aldrich (St. Louis, MO, USA); dimethylsulfoxide (DMSO): Aldrich (Milwaukee, WI, USA). All other common chemicals and solvents were of HPLC grade.
Derivatization
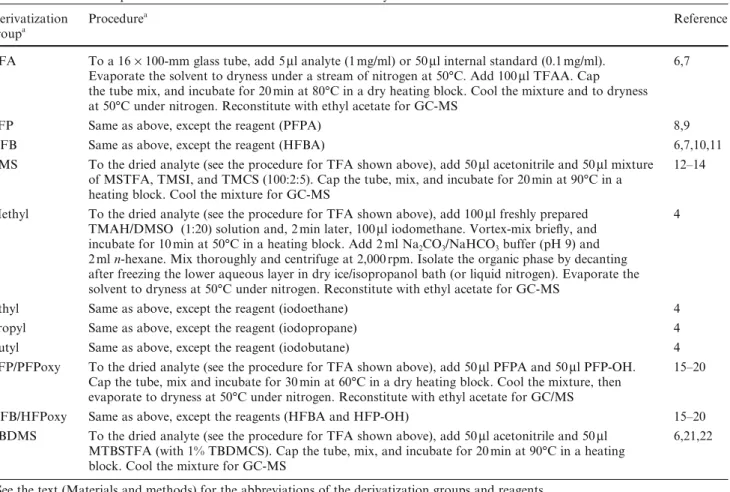
Derivatization groups included in this study were trifluoroacetyl (TFA), pentafluoropropionyl (PFP), heptafluorobutyryl (HFB), methyl, ethyl, propyl, butyl, 2,2,3,3,3-pentafluoro-1-propanoxy (PFPoxy),1,1,1,3,3, 3-hexafluoro-2-propanoxy (HFPoxy), trimethylsilyl (TMS), and t-butyldimethylsilyl (t-BDMS). Derivatiza-tion procedures and references, where these procedures were reported, are summarized in Table 1. The struc-tures of the resulting products are shown in respective mass spectrum figures.
0 50 100 50 100 150 200 250 300 350 Relative Int. (%) 166.0 212.1 272.1 317.1 196.1 105.0 82.0 122.1 77.0 H H O C O COOCH2CH3 NCH3 Cocaethylene-d0 C18H23NO4 MW: 317.38 0 50 100 50 100 150 200 250 300 350 Relative Int. (%) m/z 320.1 275.1 215.1 169.1 199.1 105.0 85.1 125.1 77.0 CD3 N COOCH2CH3 O C O H H Cocaethylene-d3 C18H20D3NO4 MW: 320.40 0 50 100 50 100 150 200 250 300 350 Relative Int. (%) m/z 220.1 169.1 204.1 105.0 85.1 125.1 77.0 325.2 275.1 Cocaethylene-d8 C18H15D8NO4 MW: 325.43 CD3 N COOCD2CD3 OC O H H 4-A-i 4-A-ii 4-A-iii
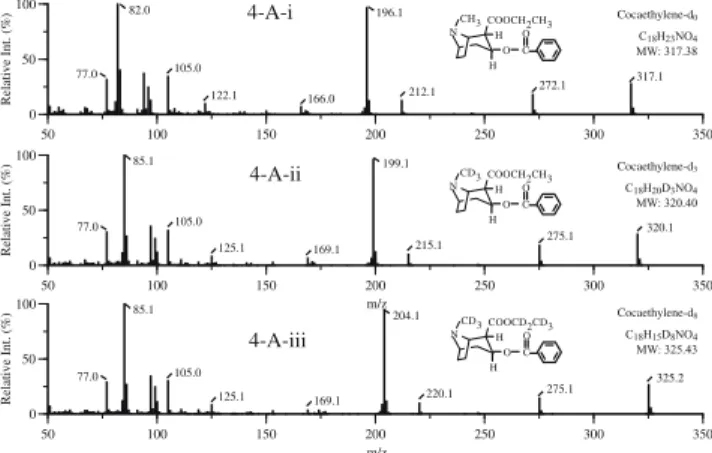
Fig. 4 Mass spectra of cocaethylene (i) and its deuterated analogs
cocaethylene-d3 (ii) and cocaethylene-d8 (iii)
0 50 100 50 100 150 200 250 300 350 Relative Int. (%) 0 50 100 50 100 150 200 250 300 350 Relative Int. (%) m/z 83.1 96.1 314.1 212.1 73.0 147.0 85.1 147.0 99.1 215.1 73.0 317.1 329.1 332.1 Ecgonine-d3, di-trimethylsilyl derivative C15H28D3NO3Si2 MW: 332.54 Ecgonine-d0, di-trimethylsilyl derivative C15H31NO3Si2 MW: 329.56 0 50 100 50 100 150 200 250 300 350 400 450 Relative Int. (%) 0 50 100 50 100 150 200 250 300 350 400 450 Relative Int. (%) m/z 82.1 275.1 356.2 359.2 73.0 96.1 85.1 99.1 275.1 73.0 Ecgonine-d3, di-t-butyl-dimethylsilyl derivative C21H40D3NO3Si2 MW: 416.70 Ecgonine-d0, di-t-butyl-dimethylsilyl derivative C21H43NO3Si2 MW: 413.72 398.2 401.2 0 50 100 50 100 150 200 250 300 350 400 450 Relative Int. (%) 0 50 100 50 100 150 200 250 300 350 400 450 Relative Int. (%) m/z 318.0 264.0 94.0 267.0 431.0 82.0 321.0 97.1 434.0 85.1 Ecgonine-d3, trifluoroacetyl/ hexafluoro-2-propoxy derivative C14H11D3F9NO5 MW: 450.22 Ecgonine-d0, trifluoroacetyl/ hexafluoro-2-propoxy derivative C14H14F9NO5 MW: 447.24 H H CH3 N OSi(CH3)3 COOSi(CH3)3 H H COOSi(CH3)3 OSi(CH3)3 N CD3 COOSi(CH3)2C(CH3)3 OSi(CH3)2C(CH3)3 N CH3 H H CD3 N OSi(CH3)2C(CH3)3 COOSi(CH3)2C(CH3)3 H H COOCH(CF3)2 OOC–CF3 N CH3 H H CD3 N OOC–CF3 COOCH(CF3)2 H H 5-A-i 5-A-ii 5-C-i 5-B-i 5-B-ii 5-C-ii 0 50 100 50 100 150 200 250 300 350 400 450 500 Relative Int. (%) 0 50 100 50 100 150 200 250 300 350 400 450 500 Relative Int. (%) m/z 300.0 463.0 119.0 94.0 82.0 303.1 317.0 119.0 85.1 466.0 97.1 314.0 Ecgonine-d3, pentafluoro- propionyl/pentafluoro-1-propoxy derivative C15H14D3F10NO5 MW: 482.24 Ecgonine-d0, pentafluoro- propionyl/pentafluoro-1-propoxy derivative C15H17F10NO5 MW: 479.26 H H CH3 N OOC–C2F5 COOCH2C2F5 H H COOCH2C2F5 OOC–C2F5 N CD3 5-D-i 5-D-ii 5-E-i 5-E-ii 0 50 100 50 100 150 200 250 300 350 400 450 500 550 600 Relative Int. (%) 318.0 364.0 94.0 82.0 531.0 Ecgonine-d0, heptafluoro- butyryl/hexafluoro-2-propoxy derivative C16H14F13NO5 MW: 547.25 COOCH(CF3)2 OOC–C3F7 NCH3 H H 0 50 100 50 100 150 200 250 300 350 400 450 500 550 600 Relative Int. (%) m/z 97.0 367.0 321.0 85.1 534.1 Ecgonine-d3, heptafluoro- butyryl/hexafluoro-2-propoxy derivative C16H11D3F13NO5 MW: 550.24 CD3 N OOC–C3F7 COOCH(CF3)2 H H
Fig. 5 Mass spectra of ecgonine (i) and its deuterated analog
ecgonine-d3 (ii). A Di-TMS-derivatized; B di-t-BDMS-derivatized;
C TFA/HFPoxy-derivatized; D PFP/PFPoxy-derivatized; E HFB/
HFPoxy-derivatized. See text (Materials and methods) for derivatization abbreviations
(PFPA), heptafluorobutyric anhydride (HFBA), N-methyl-N-trimethylsilyltrifluoroacetamide (MSTFA), N,O-bis(trimethylsilyl)trifluoroacetamide (BSTFA) with 1% trimethylchlorosilane (TMCS), and N-methyl-N-(t-butyldimethylsilyl)trifluoroacetamide (MTBSTFA) with 1% t-butyldimethylchlorosilane (t-BDMCS). Other
re-Instrumentation, analytical parameters, and data collection procedure
GC-MS analysis was performed on an Agilent 6890 GC interfaced to an Agilent 5973 MS (Agilent, Palo Alto, CA, USA). A 12-m HP-ULTRA-1 cross-linked 100% methyl siloxane capillary column (0.20-mm i.d., 0.33-µm film thickness) from Agilent (Wilmington, DE, USA) was used for this study. Helium carrier gas flow rate was 1.0 ml/min. The injector and GC-MS interface tempera-tures were maintained at 250 and 280°C, respectively. Various GC oven temperatures and programming pa-rameters were adapted for the analyses of various CD products. Because pure compounds were adapted in this study, temperature programming was not a critical pa-rameter in this study. However, various unknown CD products were routinely observed; parameters reported in the literature for respective CD reactions were typi-cally adapted.
Typically, a full-scan mass spectrum of the derivatized analyte was obtained by injecting the CD product into the GC-MS system. The scan range was typically set
0 50 100 5 2 0 0 2 0 5 1 0 0 1 0 5 0 Relative Int. (%) 112.0 168.1 199.1 96.1 82.1 55.1
Ecgonine methyl ester-d0 C10H17NO3 MW: 199.24 1182.1 140.1 CH3 N COOCH3 OH H H 0 50 100 5 2 0 0 2 0 5 1 0 0 1 0 5 0 Relative Int. (%) m/z 202.1 171.1 115.1 99.1
85.1 Ecgonine methyl ester-d3 C17H14D3NO3 MW: 202.26 60.1 143.1 185.1 H H OH COOCH3 NCD3 0 50 100 50 100 150 200 250 300 350 Relative Int. (%) m/z 0 50 100 50 100 150 200 250 300 350 Relative Int. (%) 125.1 85.0 97.0 267.1 185.1 69.0 298.1
Ecgonine methyl ester-d3, trifluoroacetyl derivative C12H13D3F3NO4 MW: 298.27 157.1 CD3 N COOCH3 OOC–CF3 H H 122.1 82.0 94.0 264.0 182.1 69.0 295.1
Ecgonine methyl ester-d0, trifluoroacetyl derivative C12H16F3NO4 MW: 295.25 154.1 H HOOC–CF3 COOCH3 NCH3 0 50 100 50 100 150 200 250 300 350 400 Relative Int. (%) m/z 0 50 100 50 100 150 200 250 300 350 400 Relative Int. (%) 119.0 182.1 82.0 94.0 69.0 314.0 345.0
Ecgonine methyl ester-d0, pentafluoropropionyl derivative C13H16F5NO4 MW: 345.26 118.9 97.0 85.0 69.0 185.1 348.1 317.0
Ecgonine methyl ester-d3, pentafluoropropionyl derivative C13H13D3F5NO4 MW: 348.28 H HOOC–C2F5 COOCH3 NCH3 CD3 N COOCH3 OOC–C2F5 H H 6-A-i 6-A-ii 6-B-i 6-B-ii 6-C-i 6-C-ii 0 50 100 50 100 150 200 250 300 350 400 450 Relative Int. (%) m/z 0 50 100 50 100 150 200 250 300 350 400 450 Relative Int. (%) 82.0 182.1 94.0 364.0 395.1 69.0
Ecgonine methyl ester-d0, heptafluorobutyryl derivative C14H16F7NO4 MW: 395.27 119.0 168.9 85.0 97.1 367.0 69.0 185.1 398.1 Ecgonine methyl ester-d3,
heptafluorobutyryl derivative C14H13D3F7NO4 MW: 398.28 119.0 169.0 CH3 N COOCH3 OOC–C3F7 H H H HOOC–C3F7 COOCH3 NCD3 0 50 100 50 100 150 200 250 300 Relative Int. (%) 155.0 182.1 240.1 271.1 82.0 96.1 73.0
Ecgonine methyl ester-d0, trimethylsilyl derivative C13H25NO3Si MW: 271.42 0 50 100 50 100 150 200 250 300 Relative Int. (%) m/z 274.1 243.1 158.1 185.1 85.1 99.1 73.0
Ecgonine methyl ester-d3, trimethylsilyl derivative C13H22D3NO3Si MW: 274.44 H HOSi(CH3)3 COOCH3 NCH3 CD3 N COOCH3 OSi(CH3)3 H H 0 50 100 50 100 150 200 250 300 350 Relative Int. (%) 155.0 282.1 182.1 256.1 82.1 96.1 73.0
Ecgonine methyl ester-d0, t-butyldimethylsilyl derivative C16H31NO3Si MW: 313.51 313.1 0 50 100 50 100 150 200 250 300 350 Relative Int. (%) m/z 158.1 285.1 185.1 259.1 85.1 99.1 73.0
Ecgonine methyl ester-d3, t-butyldimethylsilyl derivative C16H28D3NO3Si MW: 316.53 316.1 H HOSi(CH3)2C(CH3)3 COOCH3 NCH3 CD3 N COOCH3 OSi(CH3)2C(CH3)3 H H 6-D-i 6-D-ii 6-E-i 6-E-ii 6-F-i 6-F-ii
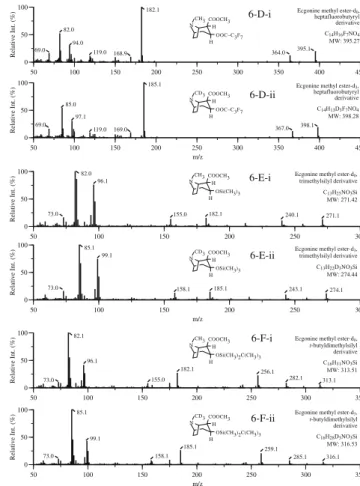
Fig. 6 Mass spectra of ecgonine methyl ester (i) and its deuterated
analog ecgonine methyl ester-d3 (ii). A Underivatized; B
TFA-derivatized; C PFP-TFA-derivatized; D HFB-TFA-derivatized; E
TMS-derivatized; F t-BDMS-derivatized. See text (Materials and methods) for derivatization abbreviations
0 50 100 0 2 0 5 1 0 0 1 0 5 0 Relative Int. (%) 181.1 166.0 122.1 138.0 152.0 82.1 COOCH3 NCH3 Anhydroecgonine methyl ester-d0 C10H15NO2 MW: 181.23 94.0 57.1 0 50 100 0 2 0 5 1 0 0 1 0 5 0 Relative Int. (%) m/z 155.0 184.1 169.1 125.1 141.0 85.1 CD3 N COOCH3 Anhydroecgonine methyl ester-d3 C10H12D3NO2 MW: 184.25 97.1 60.1 7-A-i 7-A-ii
Fig. 7 Mass spectra of anhydroecgonine methyl ester (i) and
anhydroecgonine methyl ester-d3 (ii)
As an example of the analytes and the derivatization reagents, the CD reaction for ecgonine with TFA and HFPoxy is shown below.
+ F3C C O C CF3 O O + F3C C CF3 OH H N OCOCF3 H CH3 H COOCH(CF3)2 N H COOH CH3 H OH
from m/z 50 to the molecular weight of the anticipated product with the maximal number of CD groups, rounded to the next 50 or 100. A separate run was re-peated for each isotopic analog of an analyte. Informa-tions derived from ion chromatograms (retention time and mass spectrometric data) were used to characterize the analyte and its IS.
Full-scan mass spectrometric data from these runs were reviewed to select ions that may be suitable for designating the analyte and its IS in routine GC-MS protocols. These CD products [the analyte of interest and its isotopic analog(s)] were injected (separately) into the GC-MS again under the selected ion-monitoring (SIM) mode, and the ions selected from the full-scan mass spectrometric data were also monitored. General criteria adapted for SIM ion selection were: (1) full-scan intensity data indicated less than 10% CC; and (2) the ion’s relative intensity in the full-scan mass spectrum was ≥10%. Ions with lower intensity were included when there were less than three pairs of ions that met the above criteria.
Mass spectrometric data derived from the SIM runs were then used to evaluate the CC data (analyte
contri-bution to the intensities of ions designated for its isoto-pic analog, and vice versa). Details of the methodology are described in our earlier publications [3,4].
Results and discussion Data presentation
Two sets of data are presented in this report. The first set of data is a systematic compilation of full-scan mass spectra of various CD products of the analytes along with their commercially available isotopically labeled analogs. The full-scan mass spectra that were collected, as described in the previous section, were stored as digi-tal data that were then converted (DeltaGraph, Seattle, WA, USA) into mass spectra of more desirable format and are systematically presented in Figs. 1–7.
The mass spectra in these figures are organized as follows. All mass spectra resulting from the use of one derivatization group for a specific analyte and its isotopic analog(s) are shown together in one figure. For example, Fig. 3A includes the mass
Table 1 Procedures adapted for the derivatizations included in this study
Derivatization Procedurea Reference
groupa
TFA To a 16 × 100-mm glass tube, add 5 µl analyte (1mg/ml) or 50 µl internal standard (0.1mg/ml). 6,7 Evaporate the solvent to dryness under a stream of nitrogen at 50°C. Add 100µl TFAA. Cap
the tube mix, and incubate for 20 min at 80°C in a dry heating block. Cool the mixture and to dryness at 50°C under nitrogen. Reconstitute with ethyl acetate for GC-MS
PFP Same as above, except the reagent (PFPA) 8,9
HFB Same as above, except the reagent (HFBA) 6,7,10,11
TMS To the dried analyte (see the procedure for TFA shown above), add 50µl acetonitrile and 50 µl mixture 12–14 of MSTFA, TMSI, and TMCS (100:2:5). Cap the tube, mix, and incubate for 20 min at 90°C in a
heating block. Cool the mixture for GC-MS
Methyl To the dried analyte (see the procedure for TFA shown above), add 100µl freshly prepared 4 TMAH/DMSO (1:20) solution and, 2 min later, 100µl iodomethane. Vortex-mix briefly, and
incubate for 10 min at 50°C in a heating block. Add 2 ml Na2CO3/NaHCO3 buffer (pH 9) and
2 ml n-hexane. Mix thoroughly and centrifuge at 2,000 rpm. Isolate the organic phase by decanting after freezing the lower aqueous layer in dry ice/isopropanol bath (or liquid nitrogen). Evaporate the solvent to dryness at 50°C under nitrogen. Reconstitute with ethyl acetate for GC-MS
Ethyl Same as above, except the reagent (iodoethane) 4
Propyl Same as above, except the reagent (iodopropane) 4
Butyl Same as above, except the reagent (iodobutane) 4
PFP/PFPoxy To the dried analyte (see the procedure for TFA shown above), add 50µl PFPA and 50µl PFP-OH. 15–20 Cap the tube, mix and incubate for 30 min at 60°C in a dry heating block. Cool the mixture, then
evaporate to dryness at 50°C under nitrogen. Reconstitute with ethyl acetate for GC/MS
HFB/HFPoxy Same as above, except the reagents (HFBA and HFP-OH) 15–20
t-BDMS To the dried analyte (see the procedure for TFA shown above), add 50µl acetonitrile and 50 µl 6,21,22 MTBSTFA (with 1% TBDMCS). Cap the tube, mix, and incubate for 20 min at 90°C in a heating
block. Cool the mixture for GC-MS
spectra for the methyl-derivatives of the following
compounds: benzoylecgonine, benzoylecgonine-d3,
and benzoylecgonine-d8. The mass spectra of these
com-pounds with other derivatization groups attached are shown in the remaining figure parts, i.e., Fig. 3B–H for the derivatives with ethyl, propyl, butyl, PFPoxy, HFPoxy, TMS, and t-BDMS groups, respectively. The corresponding figures for the mass spectra of cocaine, norcocaine, cocaethylene, ecgonine, ecgonine methyl
ester, and anhydroecgonine methyl ester are shown in Figs. 1, 2, 4–7, respectively.
Many of the mass spectra shown in Figs. 1–7 are not available in the literature. Certainly, they have not been systematically compiled as hereby presented and should be of routine reference value to laboratories engaged in drug analysis.
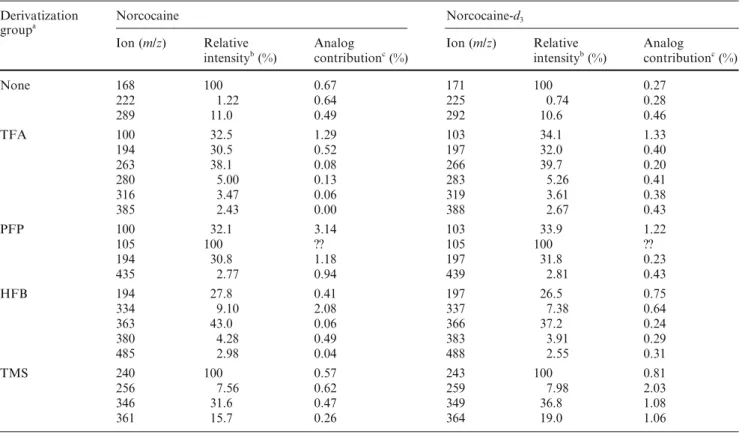
The second set of data (CC) is presented in table format as pairs of ions with the potential for designating
Table 3 Relative intensity and cross contribution data of ions with potential for designating the analyte and the adapted internal standard
for norcocaine/norcocaine-d3
Derivatization Norcocaine Norcocaine-d3
groupa
Ion (m/z) Relative Analog Ion (m/z) Relative Analog
intensityb (%) contributionc (%) intensityb (%) contributionc (%)
None 168 100 0.67 171 100 0.27 222 1.22 0.64 225 0.74 0.28 289 11.0 0.49 292 10.6 0.46 TFA 100 32.5 1.29 103 34.1 1.33 194 30.5 0.52 197 32.0 0.40 263 38.1 0.08 266 39.7 0.20 280 5.00 0.13 283 5.26 0.41 316 3.47 0.06 319 3.61 0.38 385 2.43 0.00 388 2.67 0.43 PFP 100 32.1 3.14 103 33.9 1.22 105 100 ?? 105 100 ?? 194 30.8 1.18 197 31.8 0.23 435 2.77 0.94 439 2.81 0.43 HFB 194 27.8 0.41 197 26.5 0.75 334 9.10 2.08 337 7.38 0.64 363 43.0 0.06 366 37.2 0.24 380 4.28 0.49 383 3.91 0.29 485 2.98 0.04 488 2.55 0.31 TMS 240 100 0.57 243 100 0.81 256 7.56 0.62 259 7.98 2.03 346 31.6 0.47 349 36.8 1.08 361 15.7 0.26 364 19.0 1.06
Ion pairs with 5% (or higher) cross contribution by the analog are not listed
aSee the text (Materials and methods) for the abbreviations for the derivatization groups bRelative intensity based on full-scan data (see Fig. 2)
cAnalog contribution (cross contribution) is derived from selected ion-monitoring data
Table 2 Relative intensity and cross contribution data of ions with potential for designating the analyte and the adapted internal standard
for cocaine/cocaine-d3
Derivatization Cocaine Cocaine-d3
group
Ion (m/z) Relative Analog Ion (m/z) Relative Analog
intensitya (%) contributionb (%) intensitya (%) contributionb (%)
None 82 91.1 2.72 85 94.3 0.65
182 100 0.54 185 100 0.16
198 11.9 0.65 201 9.98 1.12
272 10.6 0.72 275 10.5 1.07
303 26.4 0.43 306 26.0 0.55
Ion pairs with 5% (or higher) cross contribution by the analog are not listed
aRelative intensity based on full-scan data (see Fig. 1)
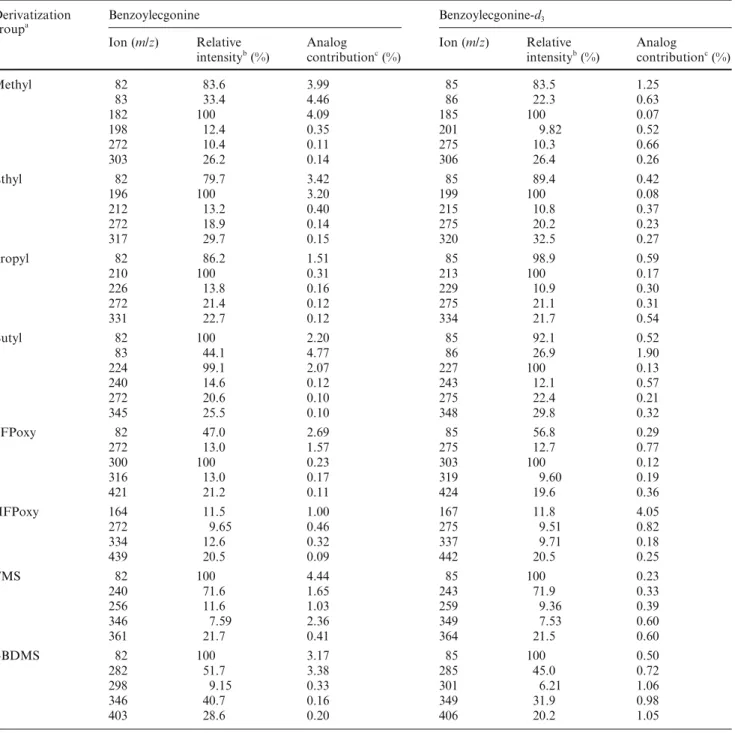
the analytes and their isotopic analogs, when the latter are used as the IS in quantitative GC-MS analysis proto-cols. Each table includes the data derived from the use of one specific isotopic analog, but includes all forms of CDs. For example, Table 4 includes the CC data
result-ing from the use of benzoylecgonine-d3 as the IS for the
analysis of benzoylecgonine. This table includes all data
resulting from the use of the following derivatization groups: methyl, ethyl, propyl, PFPoxy, HFPoxy, TMS, and t-BDMS. Corresponding data derived from the use
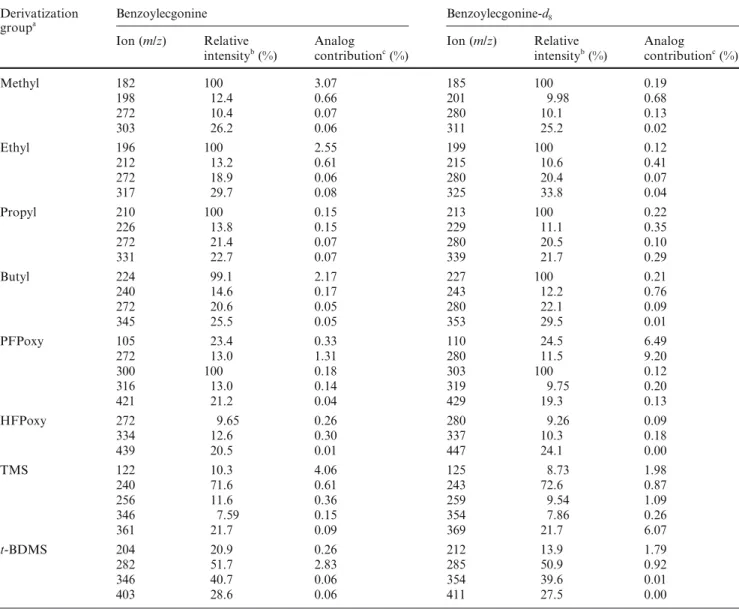
of benzoylecgonine-d8 are shown in Table 5. Data for
cocaine, norcocaine, cocaethylene, ecgonine, ecgonine methyl ester, and anhydroecgonine methyl ester are shown in Tables 2, 3 and 6–9, respectively.
Table 4 Relative intensity and cross contribution data of ions with potential for designating the analyte and the adapted internal standard
for benzoylecgonine/benzoylecgonine-d3
Derivatization Benzoylecgonine Benzoylecgonine-d3
groupa
Ion (m/z) Relative Analog Ion (m/z) Relative Analog
intensityb (%) contributionc (%) intensityb (%) contributionc (%)
Methyl 82 83.6 3.99 85 83.5 1.25 83 33.4 4.46 86 22.3 0.63 182 100 4.09 185 100 0.07 198 12.4 0.35 201 9.82 0.52 272 10.4 0.11 275 10.3 0.66 303 26.2 0.14 306 26.4 0.26 Ethyl 82 79.7 3.42 85 89.4 0.42 196 100 3.20 199 100 0.08 212 13.2 0.40 215 10.8 0.37 272 18.9 0.14 275 20.2 0.23 317 29.7 0.15 320 32.5 0.27 Propyl 82 86.2 1.51 85 98.9 0.59 210 100 0.31 213 100 0.17 226 13.8 0.16 229 10.9 0.30 272 21.4 0.12 275 21.1 0.31 331 22.7 0.12 334 21.7 0.54 Butyl 82 100 2.20 85 92.1 0.52 83 44.1 4.77 86 26.9 1.90 224 99.1 2.07 227 100 0.13 240 14.6 0.12 243 12.1 0.57 272 20.6 0.10 275 22.4 0.21 345 25.5 0.10 348 29.8 0.32 PFPoxy 82 47.0 2.69 85 56.8 0.29 272 13.0 1.57 275 12.7 0.77 300 100 0.23 303 100 0.12 316 13.0 0.17 319 9.60 0.19 421 21.2 0.11 424 19.6 0.36 HFPoxy 164 11.5 1.00 167 11.8 4.05 272 9.65 0.46 275 9.51 0.82 334 12.6 0.32 337 9.71 0.18 439 20.5 0.09 442 20.5 0.25 TMS 82 100 4.44 85 100 0.23 240 71.6 1.65 243 71.9 0.33 256 11.6 1.03 259 9.36 0.39 346 7.59 2.36 349 7.53 0.60 361 21.7 0.41 364 21.5 0.60 t-BDMS 82 100 3.17 85 100 0.50 282 51.7 3.38 285 45.0 0.72 298 9.15 0.33 301 6.21 1.06 346 40.7 0.16 349 31.9 0.98 403 28.6 0.20 406 20.2 1.05
Ion pairs with 5% (or higher) cross contribution by the analog are not listed
aSee the text (Materials and methods) for the abbreviations for the derivatization groups bRelative intensity based on full-scan data (see Fig. 3)
Table 5 Relative intensity and cross contribution data of ions with potential for designating the analyte and the adapted internal standard
for benzoylecgonine/benzoylecgonine-d8
Derivatization Benzoylecgonine Benzoylecgonine-d8
groupa
Ion (m/z) Relative Analog Ion (m/z) Relative Analog
intensityb (%) contributionc (%) intensityb (%) contributionc (%)
Methyl 182 100 3.07 185 100 0.19 198 12.4 0.66 201 9.98 0.68 272 10.4 0.07 280 10.1 0.13 303 26.2 0.06 311 25.2 0.02 Ethyl 196 100 2.55 199 100 0.12 212 13.2 0.61 215 10.6 0.41 272 18.9 0.06 280 20.4 0.07 317 29.7 0.08 325 33.8 0.04 Propyl 210 100 0.15 213 100 0.22 226 13.8 0.15 229 11.1 0.35 272 21.4 0.07 280 20.5 0.10 331 22.7 0.07 339 21.7 0.29 Butyl 224 99.1 2.17 227 100 0.21 240 14.6 0.17 243 12.2 0.76 272 20.6 0.05 280 22.1 0.09 345 25.5 0.05 353 29.5 0.01 PFPoxy 105 23.4 0.33 110 24.5 6.49 272 13.0 1.31 280 11.5 9.20 300 100 0.18 303 100 0.12 316 13.0 0.14 319 9.75 0.20 421 21.2 0.04 429 19.3 0.13 HFPoxy 272 9.65 0.26 280 9.26 0.09 334 12.6 0.30 337 10.3 0.18 439 20.5 0.01 447 24.1 0.00 TMS 122 10.3 4.06 125 8.73 1.98 240 71.6 0.61 243 72.6 0.87 256 11.6 0.36 259 9.54 1.09 346 7.59 0.15 354 7.86 0.26 361 21.7 0.09 369 21.7 6.07 t-BDMS 204 20.9 0.26 212 13.9 1.79 282 51.7 2.83 285 50.9 0.92 346 40.7 0.06 354 39.6 0.01 403 28.6 0.06 411 27.5 0.00
Ion pairs with 5% (or higher) cross contribution by the analog are not listed
aSee the text (Materials and methods) for the abbreviations for the derivatization groups bRelative intensity based on full-scan data (see Fig. 3)
cAnalog contribution (cross contribution) is derived from selected ion-monitoring data
Ion pairs included in Tables 2–9 were limited at two levels. First, as described in the Material and methods section, full-scan data with an ion pair having greater than 10% CC or less than 10% relative intensity were not included in the SIM data collection. At the second level, when the resulting CC based on SIM data was greater than 5%, this pair was also excluded from the table. It is
believed that ion pairs with CC > 5% result in a narrow
linear range and should not be incorporated into routine protocols [23]. Because full-scan mass spectra can reveal ion pairs with substantial CC (>10%), the emphasis of the listings (Tables 2–9) is to identify potential ion pairs that may not be apparent or not be sufficiently precise
based on full-scan data, and not ion pairs that should be excluded.
Derivatization with analogous groups
This study included CD groups that are series of analogs with similar chemical properties, but different masses. For example, the alkyl series included methyl, ethyl, pro-pyl, and butyl groups; the acyl series included TFA, PFP, and HFB groups; and the TMS series included TMS and t-BDMS. Because the principal fragmentation patterns within the same series of CD products remain the same, the CC characteristics of the ion pairs
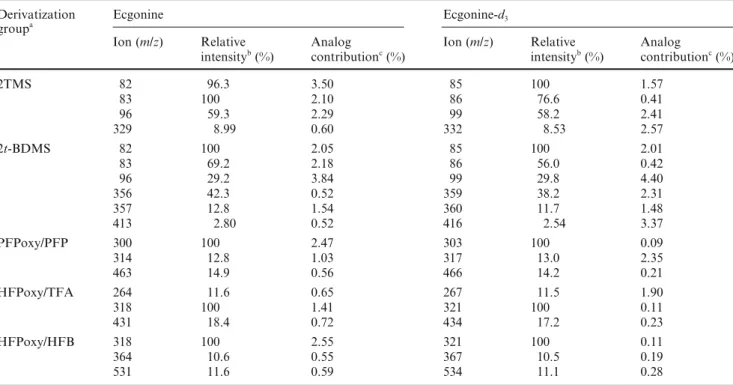
exhib-Table 7 Relative intensity and cross contribution data of ions with potential for designating the analyte and the adapted internal standard
for ecgonine/ecgonine-d3
Derivatization Ecgonine Ecgonine-d3
groupa
Ion (m/z) Relative Analog Ion (m/z) Relative Analog
intensityb (%) contributionc (%) intensityb (%) contributionc (%)
2TMS 82 96.3 3.50 85 100 1.57 83 100 2.10 86 76.6 0.41 96 59.3 2.29 99 58.2 2.41 329 8.99 0.60 332 8.53 2.57 2t-BDMS 82 100 2.05 85 100 2.01 83 69.2 2.18 86 56.0 0.42 96 29.2 3.84 99 29.8 4.40 356 42.3 0.52 359 38.2 2.31 357 12.8 1.54 360 11.7 1.48 413 2.80 0.52 416 2.54 3.37 PFPoxy/PFP 300 100 2.47 303 100 0.09 314 12.8 1.03 317 13.0 2.35 463 14.9 0.56 466 14.2 0.21 HFPoxy/TFA 264 11.6 0.65 267 11.5 1.90 318 100 1.41 321 100 0.11 431 18.4 0.72 434 17.2 0.23 HFPoxy/HFB 318 100 2.55 321 100 0.11 364 10.6 0.55 367 10.5 0.19 531 11.6 0.59 534 11.1 0.28
Ion pairs with 5% (or higher) cross contribution by the analog are not listed
aSee the text (Materials and methods) for the abbreviations for the derivatization groups bRelative intensity based on full-scan data (see Fig. 5)
cAnalog contribution (cross contribution) is derived from selected ion-monitoring data
Table 6 Relative intensity and cross contribution data of ions with potential for designating the analyte and the adapted internal standard
for cocaethylene/cocaethylene-d3 and cocaethylene/cocaethylene-d8
Derivatization Cocaethylene Cocaethylene-dn
group
Ion (m/z) Relative Analog Ion (m/z) Relative Analog
intensitya (%) contributionb (%) intensitya (%) contributionb (%)
None 82 100 1.95 85c 100c 0.79c 196 96.9 0.49 199c 96.2c 0.22c 212 12.6 0.62 215c 10.1c 1.18c 272 18.0 0.27 275c 18.0c 0.48c 317 27.8 0.34 320c 28.4c 0.61c None 82 100 2.26 85d 100d 0.60d 196 96.9 0.06 204d 94.5d 0.09d 212 12.6 0.06 220d 9.92d 0.04d 272 18.0 0.08 275d 14.4d 0.43d 317 27.8 0.06 325d 26.8d 0.05d
Ion pairs with 5% (or higher) cross contribution by the analog are not listed
aRelative intensity based on full-scan data (see Fig. 4)
bAnalog contribution (cross contribution) is derived from selected ion-monitoring data cn = 3
dn = 8
ited by these products are expected to be similar. This is clearly demonstrated by the data shown in Table 4 that include the following sets of ion pairs: m/z 182/185, 198/ 201, and 303/306 with methyl as the CD group; m/z 196/ 199, 212/215, and 317/320 with ethyl as the CD group;
m/z 210/213, 226/229, and 331/334 with propyl as the CD group; and m/z 224/227, 240/243, and 345/348 with butyl as the CD group. Similarly, data exhibited similar CC characteristics for the acyl series (Table 8) and the TMS series (Tables 4, 7, 8).
Table 9 Relative intensity and cross contribution data of ions with potential for designating the analyte and the adapted internal standard
for anhydroecgonine methyl ester/anhydroecgonine methyl ester-d3
Derivatization Anhydroecgonine methyl ester Anhydroecgonine methyl ester-d3
groupa
Ion (m/z) Relative Analog Ion (m/z) Relative Analog
intensitya (%) contributionb (%) intensitya (%) contributionb (%)
None 152 100 1.60 155 100 0.19
181 33.5 1.27 184 34.9 0.14
Ion pairs with 5% (or higher) cross contribution by the analog are not listed
aRelative intensity based on full-scan data (see Fig. 7)
bAnalog contribution (cross contribution) is derived from selected ion-monitoring data
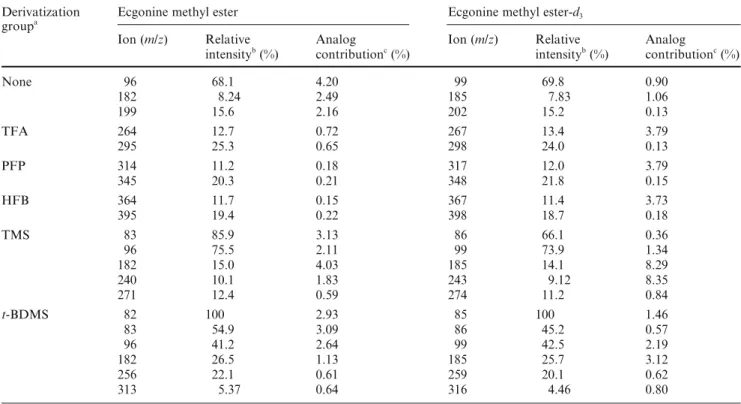
Table 8 Relative intensity and cross contribution data of ions with potential for designating the analyte and the adapted internal standard
for ecgonine methyl ester/ecgonine methyl ester-d3
Derivatization Ecgonine methyl ester Ecgonine methyl ester-d3
groupa
Ion (m/z) Relative Analog Ion (m/z) Relative Analog
intensityb (%) contributionc (%) intensityb (%) contributionc (%)
None 96 68.1 4.20 99 69.8 0.90 182 8.24 2.49 185 7.83 1.06 199 15.6 2.16 202 15.2 0.13 TFA 264 12.7 0.72 267 13.4 3.79 295 25.3 0.65 298 24.0 0.13 PFP 314 11.2 0.18 317 12.0 3.79 345 20.3 0.21 348 21.8 0.15 HFB 364 11.7 0.15 367 11.4 3.73 395 19.4 0.22 398 18.7 0.18 TMS 83 85.9 3.13 86 66.1 0.36 96 75.5 2.11 99 73.9 1.34 182 15.0 4.03 185 14.1 8.29 240 10.1 1.83 243 9.12 8.35 271 12.4 0.59 274 11.2 0.84 t-BDMS 82 100 2.93 85 100 1.46 83 54.9 3.09 86 45.2 0.57 96 41.2 2.64 99 42.5 2.19 182 26.5 1.13 185 25.7 3.12 256 22.1 0.61 259 20.1 0.62 313 5.37 0.64 316 4.46 0.80
Ion pairs with 5% (or higher) cross contribution by the analog are not listed
aSee the text (Materials and methods) for the abbreviations for the derivatization groups bRelative intensity based on full-scan data (see Fig. 6)
cAnalog contribution (cross contribution) is derived from selected ion-monitoring data
In general, among the potentially usable ion pairs derived from a specific CD group, the ion pairs with higher mass appear to exhibit better CC data. For ex-ample, in Table 4, with methyl as the CD group, the CC data for the m/z 303/306 pair are superior to the CC data for the m/z 182/185 pair. This is also true when ethyl, propyl, and butyl are used as the CD groups. On the other hand, the corresponding ion pairs derived from the CD group with higher mass do not necessarily exhibit better CC characteristics than those derived from the CD groups with lower mass. For example,
differences among the CC data exhibited by the highest mass ion pairs, i.e., m/z 303/306 (methyl as the CD group), 317/320 (ethyl as the CD group), 226/229 (propyl as the CD group), and 345/248 (butyl as the CD group), are not apparent; increasing the molecular mass of the CD group alone does not necessarily improve the CC parameters.
The d8-labeled ISs were used together with the d3
-labeled standards for benzoylecgonine (Tables 4, 5) and
cocaethylene (Table 6); the d8-labeled ISs generally gave
Derivatization with CD groups exhibiting different chemical properties
As demonstrated in an earlier study [21], variations in ISs and/or CD groups (of nonanalogous series) can aid in the production of ion pairs with better CC chara-cteristics. Exactly which isotopically labeled IS and whether the alkyl, acyl, or TMS series CD group can generate the ion pairs with the best CC characteristics can only be compared through trial and error. For ex-ample, CC characteristics of ion pairs resulting from the derivatization of benzoylecgonine with butyl, TMS, and HFPoxy as the CD groups are shown in Tables 4 and 5. When a single CD reagent is used to derivatize an analyte containing multiple reaction sites, the reaction may result in the attachment of only one functional group to the analyte. This may cause stereo effects or reduced reactivity of the second reaction site toward the CD reagent. If an appropriate second CD reagent and condition are applied, the attachment of a second CD group will result in a product with a higher molecular weight, and will likely generate more diverse fragmenta-tion patterns, favorable to the producfragmenta-tion of ion pairs with better CC characteristics. This phenomenon could not be well illustrated here, because only one compound with multiple derivatization sites was included in this study (Table 7). However, data derived from a parallel study on a series of amphetamines clearly demonstrated this trend [24].
While the approach adopting multiple derivatization may improve the generation of ion pairs with higher quality CC characteristics, it will certainly increase the analytical cost. Scientifically, it may also negatively affect the limit of detection, if the yield of the derivatization reaction is low.
Scope and limitations
In addition to systematically presenting full-scan mass spectra of drug analytes and their isotopically labeled analogs, the emphasis of this report is placed on the compilation of ion CC data. These data were obtained using the analyte and the IS presenting approximately the same levels. This is a logical choice, because the concen-trations of the analyte and the IS in the “cutoff” standard adopted in most workplace drug testing protocols are often the same. As reported in an earlier study [25], when the analyte concentration in the test sample is exactly the same as the IS concentration in the one-point cutoff calibration standard, CC will not affect the accuracy of the determination, i.e., the positive/negative outcome.
Obviously, for most test specimens, the analyte concentration will be higher or lower than the cutoff
concentration. Under this circumstance, the observed concentration of the analyte will be lower or higher than the true value depending on the CC characteristics. For example, if the contribution of the IS to the intensity of the ion designated for the analyte is significant, the lower limit of quantitation will be unfavorably affected as re-ported by Urry et al. [26]. Interested readers are referred to earlier reports [25,27] for further details.
As mentioned above, the premise of this work is (1) the systematic presentation of full-scan mass spectra of the analytes and their isotopically labeled analogs in various CD forms and (2) the evaluation of ions that may potentially be used for SIM in targeted compound analysis protocols. Other aspects (such as those listed below), that may be important to the selection of the most desirable CD method for a specific application, are not the focus of this study and may not be adequately addressed:
• Availability of an adequate number of high mass ions with unique fragments including part of the analyte; • Chromatographic characteristics of the resulting
derivatives that may provide the optimal resolution between the analytes and interfering compounds in the specific analytical system of interest;
• Yield of the CD reaction and the stability of the result-ing CD product; and
• Safety issues related to the reagent, reaction condition, and by-products that relate to the analyst and the follow-up analytical system.
Conclusions
Following a review on (1) the structural features of cocaine-related drugs/metabolites; (2) commercially available isotopically labeled analogs of these com-pounds; and (3) commonly utilized CD approaches, the authors have carried out a series of CD experiments and collected a set of full-scan mass spectra and CC data for ion pairs with potential for designating the analytes and the ISs. The resulting spectrometric data represent the most comprehensive collection of full-scan mass spectra of these drugs and their isotopically labeled analogs in various CD forms. The comprehensive listing of CC data hereby presented should save an enormous amount of time and effort for practicing laboratories in their search for analytical parameters to establish optimal protocols for quantitation.
Acknowledgments The authors are grateful for the financial
sup-port received from the following sources: (Taiwanese) National Science Council (NSC 94–2745-M-242–003-URD), (Taiwanese) National Bureau of Controlled Drugs, Department of Health
(DOH94-NNB-1003), and US Federal Aviation Administration’s Civil Aerospace Medical Institute (Oklahoma City, OK, USA). Ms. Bud-gen Chen provided most of the molecular formula and molecular weight information included in Figs. 1–7. The authors are especially grateful to Ms. Roxane M. Ritter for her assistance during collection of the mass spectra.
Referencess
1. Liu RH, Gadzala DE (1997) Handbooks of drug analysis— applications in forensic and clinical laboratories. American Chemical Society, Washington DC, pp 134–141, pp 224– 225
2. Valtier S, Cody JT (1995) Evaluation of internal standards for the analysis of amphetamine and methamphetamine. J Anal Toxicol 19:375–380
3. Chang W-T, Lin D-L, Liu RH (2001) Isotopic analogs as internal standards for quantitative analyses by GC/MS— evaluation of cross-contribution to ions designated for the analyte and the isotopic internal standard. Forensic Sci Int 121:174–182
4. Liu RH, Foster G, Cone EJ, Kumar SD (1995) Selecting an appropriate isotopic internal standard for gas chro-matography/mass spectrometry analysis of drugs of abuse— pentobarbital example. J Forensic Sci 40:983–989
5. Liu RH, Lin D-L, Chang W-T, Liu C, Tsay W-I, Li J-H, Kuo T-L (2002) Isotopically labeled analogues for drug quantita-tion. Anal Chem 74:618A–626A
6. Hornbeck CL, Czarny RJ (1989) Quantitation of metham-phetamine and ammetham-phetamine in urine by capillary GC/MS part I. Advantages of trichloroacetyl derivatization. J Anal Toxicol 13:144–149
7. Hornbeck CL, Carrig JE, Czarny RJ (1993) Detection of a GC/MS artifact peak as methamphetamine. J Anal Toxicol 17:257–263
8. Gilbert RB, Peng PI, Wong D (1995) A labetalol metabolite with analytical characteristics resembling amphetamines. J Anal Toxicol 19:84–86
9. Gan BK, Baugh D, Liu RH, Walia AS (1991) Simultaneous analysis of amphetamine, methamphetamine, and 3,4-methylenedioxymethamphetamine (MDMA) in urine samples by solid-phase extraction, derivatization, and gas chromatog-raphy/mass spectrometry. J Forensic Sci 36:1331–1341 10. Cody JT, Schwarzhoff R (1993) Interpretation of
metham-phetamine and ammetham-phetamine enantiomer data. J Anal Toxicol 17:321–326
11. Jones JB, Mell LD Jr (1993) A simple wash procedure for improving chromatography of HFAA derivatized am-phetamine extracts for GC/MS analysis. J Anal Toxicol 17:447
12. Elian AA (1999) Detection of low levels of flunitrazepam and its metabolites in blood and bloodstains. Forensic Sci Int 101:107–111
13. Reagent insert (2003) N-Methyl-N-trimethylsilyltrifluoroace-tamide. Pierce Biotechnology Inc., Rockford, IL, USA
14. Yoo YC, Chung HS, Kim IS, Jin WT, Kim MK (1995) Deter-mination of nalbuphine in drug abusers’ urine. J Anal Toxicol 19:120–123
15. Szirmai M, Beck O, Stephansson N, Halldin MM (1996) A GC-MS study of three major acidic metabolites of delta-1-tetrahydrocannabinol. J Anal Toxicol 20:573–578
16. Huang W, Moody DE, Andrenyak DM, Smith EK, Foltz RL, Huestis MA, Newton JF (2001) Simultaneous determination of delta-9-tetrahydrocannabinol and 11-nor-9-carboxy-delta-9-tetrahydrocannabinol in human plasma by solid-phase ex-traction and gas chromatography-negative ion chemical ionization-mass spectrometry. J Anal Toxicol 25:531–537 17. Bourland JA, Hayes EF, Kelly RC, Sweeney SA, Hatab MM
(2000) Quantitation of cocaine, benzoylecgonine, cocae-thylene, methylecgonine, and norcocaine in human hair by positive ion chemical ionization (PICI) gas chromatography-tandem mass spectrometry. J Anal Toxicol 24:489–495 18. Moore C, Guzaldo F, Donahue T (2001) The determination of
11-nor-delta-9-tetrahydrocannabinol-9-carboxylic acid (THC-COOH) in hair using negative ion gas chromatography-mass spectrometry and high-volume injection. J Anal Toxicol 25: 555–558
19. Baptista MJ, Monsanto PV, Marques EGP, Bermejo A, Avila S, Castanheira AM, Margalho C, Barroso M, Vieira DN (2002) Hair analysis for delta-9-THC, delta-9-THC-COOH, CBN and CBD, by GC/MS-EI comparison with GC/MS-NCI for delta-9-THC-COOH. Forensic Sci Int 128:66–78 20. Jurado C, Gimenez MP, Menendez M, Repetto M (1995)
Simultaneous quantitation of opiates, cocaine and cannab-inoids in hair. Forensic Sci Int 70:165–174
21. Lin D-L, Chang W-T, Kuo T-L, Liu RH (2000) Chemical derivatization and the selection of deuterated internal stan-dard for quantitative determination—methamphetamine ex-ample. J Anal Toxicol 24:275–280
22. Melgar R, Kelly RC (1993) A novel GC/MS derivatization method for amphetamines. J Anal Toxicol 17:399–402 23. Wang S-M, Chye S-M, Liu RH, Lewis RJ, Canfield DV (2006)
Mass spectrometric data characteristics of commonly abused amphetamines with sequential derivatization at two active sites. Forensic Sci Int (in press)
24. Chen B-G, Wang S-M, Wang C-D, Liu RH (2006) Evaluation of cross contribution to the intensity of ion designated for the analyte by the internal standard and vice versa—a precision study. J Anal Toxicol (in press)
25. Liu RH, Baugh LD, Allen EE, Salud SC, Fentress JC, Chadha H, Walia AS (1989) Isotopic analogues as the internal standard for quantitative determination of benzoylecgonine: concerns with isotopic purity and concentration level. J Foren-sic Sci 34:986–990
26. Urry FM, Kushnier M, Nelson G, McDowell M, Jennison T (1996) Improving ion mass ratio performance at low concen-trations in methamphetamine GC-MS assay through internal standard selection. J Anal Toxicol 20:592–595
27. Whiting TC, Liu RH, Chang W-T, Bodapati MR (2001) Isotopic analogs as internal standards for quantitative analy-ses of drugs/metabolites by GC-MS—non-linear calibration approaches. J Anal Toxicol 25:179–189