The Thirteenth KKNN Seminar on Civil Engineering December 7-8, 2000, Taipei, Taiwan
THE DEFORMATION CHARACTERISTIC OF MUSHAN SANDSTONE
Meng-Chai Weng , Fu-Shu Jeng, Tsan-Hwei Huang
Department of Civil Engineering, National Taiwan University, Taipei 10617, Taiwan [email protected], [email protected],
Abstract
Tunnel construction in sedimentation strata along western Taiwan may encounter cases of excess deformation. One of the reasons that cause squeezing is shear dilation of the weak rock. In this research, Mushan sandstone, one of the strata in western Taiwan, is used as test specimens. Pure shear stress path tests are performed to study the shear dilation of Mushan sandstone. Test data reveals that coupling of shear stress and volumetric strain, i.e. shear dilation is significant. Meanwhile, test results were decomposed into elastic and plastic components to further examine the stress-strain behavior of weak rock. The results indicate that: (a) Shear dilation occurs during both elastic and plastic deformation, and the shear dilation is mainly induced by plastic strain. (b) A set of elliptical plastic potential surface is accordingly proposed, based on the plastic flow observed in experiments.
Introduction
Most of the rocks in western Taiwan are Tertiary weak rocks, including sandstone, shale and mudstone. Owing to the juvenile rock forming process, these rocks exhibit weakness not only in strength but also in the capability of resisting weathering. Furthermore, these rocks possess undesired characteristics, including wetting softening, shear dilation and creep as well, which cause lots of problems in engineering practice, especially in tunneling engineering (Jeng et al., 1996).
Among those factors, this paper focuses on the shear dilation behavior of weak sandstone through a series of triaxial tests. Meanwhile, test results are decomposed into elastic and plastic components to further examine the stress-strain behavior of weak rock.
Characteristics of Specimen Adopted
In this research, Mushan sandstone, one of the strata in western Taiwan, is used as test specimens, and specimens are cored perpendicular to their sedimentary bedding with 5.5 cm in diameter and 12.5 cm in height. After preparation, the specimens are oven dried at 105 ℃ and stored in air-dried condition. The physical properties are measured according to the methods suggested by ISRM (ISRM, 1981), and the results indicate that the dry density is 2.3 g/cm3; porosity is 8.27 % and the water content when saturated is 3.60 %. Moreover, petrographic analysis is also applied in this research, and the results reveal
Mushan sandstone is mainly composed of quartz, rock fragments, and matrix with an average grain size of about 0.72 mm.
Experimental Setting
Pure shear stress path tests (path OAB in Figure 1) are performed to isolate the influence of volumetric loading from the shear loading. As shown in Figure 1, the stress path of a Conventional Triaxial Compression test (CTC) is path OAC, in which the specimen is first applied with hydrostatic stress (path OA), followed by an increase of axial stress (path AC). In such a test, both the hydrostatic stress and the shear stress increase upon the increment of axial stress. Therefore, the volumetric behavior is jointly effected by the shearing and the hydrostatic loading. To isolate the influence of hydrostatic loading during the stage of shearing (path AB), such that the hydrostatic remains unchanged during the shearing stage. Typical tests are carried out at confining pressure in the range 20-60 MPa.
The usually expressions of stress and strain are defined blow: (1) volumetric stress
kk I p σ 3 1 = = 1 3 1 ; (2) shear stress ji ijs s J 2 1 2 = ; (3) volumetric strain εv = I'1=εkk; (4) shear strain ji ije e J 2 1 '2 =
Experimental Results and Discussion Failure envelope
Based on testes under various confining pressures, the failure envelope of sandstone is accordingly found as the one shown in Figure 2, with can be expressed in terms of an extended Drucker-Prager failure criterion in 3D-stress space as:
(
I1,I2)
= J2 − I1−k =0f α (1)
The corresponding parameters of Mushan sandstone are: k = 11.60 MPa and α = 0.344, If a Mohr-Coulomb criterion is employed, the cohesion (c) and the friction angle (φ) are 9.99 MPa and 36.1º, respectively.
Deformation under volumetric stress condition
When the sandstone is subjected to hydrostatic compression (stress path OA shown in
Figure 1), its volume is contracted as shown in Figure 3. All these curves exhibit a similar
trend, which is non-linear with an increasing curvature upon greater hydrostatic pressure. In order to further examine the stress-strain behavior of weak rock, test results are decomposed into elastic and plastic components. The elastic component is deduced from
the total strain according the unloading – reloading process, andthe magnitudes of plastic and elastic volumetric strain are decomposed as shown in Figure 4.
Elastic deformation
The elastic deformation under volumetric stress assembles to a quadratic curve (shown in
Figure 4), which is convex to the strain axis. This result reveals that the elastic bulk
modulus increases as the volumetric stress increases. Namely, the sandstone becomes stiffer under greater confining pressure.
Plastic deformation
In order to examine the plastic deformation under hydrostatic compression, the trajectory of plastic strain p
ij p ijδε
δε
ξ = versus volumetric stress is illustrated in Figure 5. The trajectory of plastic strain under lower stress level is much more than that at high stress level. As stress increases to about 35 MPa, the trajectory decreases to a stable value and remains unchanged. The phenomenon may be explained that the closure of major pores under lower stress level. This result reveals that as the hydrostatic pressure increase to a particular magnitude (e.g., 35 MPa), almost no plastic volumetric strain occurs; i.e., the volumetric deformation is dominated by elastic behavior.
Deformation under shear stress condition
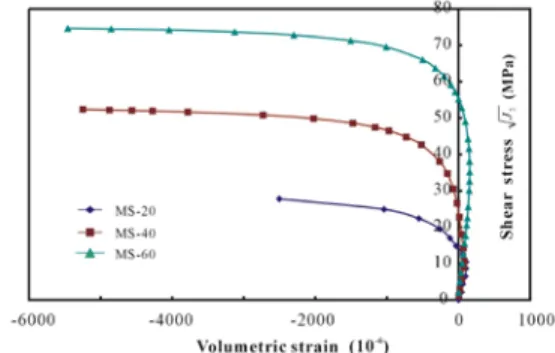
The shear stress versus volumetric strain and shear strain curves at confining pressure in the range 20-60 MPa are depicted in Figure 6 and 7, and the deformation at different confining pressure is quantitatively similar. In Figure 6 as the sandstone is applied with pure shearing (stress path AB shown in Figure 1), it is first compressed and then dilated upon greater levels of shear stress. Moreover, The shear strain induced in the pure shearing stage is shown in Figure 7, which reveals that significant shear strain is induced as the applied shear stress approaches to its ultimate strength.
Test results can also be decomposed into elastic and plastic components, which are deduced from the unloading – reloading process. The analysis results are shown in Figure
8 and 9. The shear deformation under a confining pressure of 60 MPa will be illustrated
later.
Elastic deformation
In isotropic elastic material, a pure shear stress, which causes only shear strain and will not induce any volume deformation. However, for the geo-material, shear stress would cause elastic volume deformation. In Figure 8, it is perceived that shear stress would induce elastic dilation, though the amount of elastic deformation only plays a minor role in the total dilation. In Figure 9 it shows that shear stress is proportional to elastic shear strain. Therefore, it means the shear modulus G remains constant in the pure shear procedure.
Plastic deformation
In order to identify the plastic flow distribution and the shape of plasic potential surface, the plastic flow is poltted in 13 J2
I −
obvious tendency that the plastic flow varies with the shear stress in the counterclockwise direction. Furthermore, the degree variation of plastic flow β ( p
v p s δε δε β= tan ) is shown in
Figure 11. The degree of plastic flow β increases when stress ratio η (
1 2 3⋅ J I =
η ) raises. When the degree β equals to 90o
, it reaschs a phase change point. The phase change point indicates that the deformation transforms from compaction into dilation. Therefore, phase change point is usually defined as the shear dilation threshold.
Besides the degree of plastic flow, the amount of plastic strain is also concerned. The trajectory of plastic strain ξ ( p
ij p ijδε
δε
ξ = ) versus volumetric stress is plotted as Figure 12.
At first, the trajectory increases slowly as the stress ratio increases. Later on, when the stress ratio raises to the phase change point, the trajectory increases rapidly and the major dilation is happened. Accordingly, the large amount of plastic deformation is the main dilation that may encounter squeezing.
Based on the distribution of plastic flow as shown in Figure 10, a plastic potential surface can be accordingly sketched. As shown Figure 13, a set of elliptical plastic potential surface is thus determined. Surprisingly, this behavior of weak rock is similar to the behavior of soil. Consequently, the constitutive relation for weak sandstone may be developed from plasticity models of soils.
Conclusion
Weak sandstone sampled from Mushan Formation, which is a typical stratum where squeezing is encountered, is tested in this research. Pure shear tests are performed to understand deformation induced from volumetric and shear stress. Several characteristics from experimental results are summarized below:
(a) Under volumetric stress condition, the elastic deformation dominates the total volumetric deformation. Moreover, the elastic bulk modulus increases when the volumetric stress increases.
(b) Under pure shear stress condition, dilation occurs during both elastic and plastic deformation, and the plastic component serves as a major contribution to the shear dilation.
(c) Based on the plastic flow observed in experiments, a set of elliptical plastic potential surface is proposed.
References
[1]. Jeng, F. S., G. T. Ju and T. H. Huang (1994). Properties of Some Soft Rock in Taiwan. Proc. of '94
Taiwan Rock Engineering Symposium. Taipei, Taiwan, 259-267.
[2]. Jeng, F.S., I.T. Lee, T.H. Huang (1996a). Deterioration of soft rock induced by wetting process. Proc.
[3]. Jeng, F.S., M.L. Lin and T.H. Huang (1996b). Study of the Geological Barriers of the Tunnels in
Northern Taiwan, Research Report MOTC-STAO-RD1501, Ministry of Transportation, Taipei.
[4]. International Society of Rock Mechanics (1981). Rock Characterization Testing & Monitoring –
ISRM Suggested Methods, Brown, E.T., Ed., Pergamon, New York.
[5]. Tsai, L. C. (2000). An Improved Technique of Triaxial Test of Coarse Sandstone – The Point of
Mushan Formation, Mater thesis, Dept. of Civil Eng., National Taiwan University, Taipei, Taiwan.
Figure 1 Illustration of stress paths for CTC
and pure shear tests
Figure 2 Failure envelope of sandstone tested (Drucker-Prager failure criteria)
Figure 3 Volumetric deformation induced by
hydrostatic compression
Figure 4 Elastic and plastic components of
volumetric deformation induced by hydrostatic compression
Figure 5 Variation of trajectory of plastic
strain under different volumetric
Figure 6 Volumetric deformation induced by
Figure 7 Shear deformation induced by pure
shear
Figure 8 Elastic and plastic components of
volumetric deformation induced by pure shear
Figure 9 Elastic and plastic components of
shear deformation induced by pure shear
Figure 10 distribution of plastic flow along
stress path AB
Figure 11 Variation of degree of plastic flow
β under different stress ratio
Figure 12 Variation of trajectory of plastic
strain under different stress ratio