www.elsevier.com / locate / chromb
Determination of mephenoxalone in human plasma sample by
high-performance liquid chromatography–fluorescence detection
a,c a b c ,
*
Yow-Shieng Uang
, I.-Kei Chen , Li-Hsuan Wang , Kuang-Yang Hsu
a
Protech Pharmaservices Corporation, 6Fl., No. 380, Sung Chiang Road, Taipei 104, Taiwan b
Department of Pharmacy Service, Taipei Medical University Hospital, No. 252, Wu-Hsing Street, Taipei 110, Taiwan c
School of Pharmacy, Taipei Medical University, 250 Wu-Hsing Street, Taipei 110, Taiwan Received 28 November 2000; received in revised form 20 March 2001; accepted 4 April 2001
Abstract
A simple and sensitive high-performance liquid chromatographic method involving fluorescence detection was developed for the determination of mephenoxalone in human plasma. A Cosmosil 5C18-MS column (250 mm34.6 mm I.D., 5 mm) was used as stationary phase and the mobile phase consisted of water–acetic acid–acetonitrile (200:1:300) at a flow-rate of 1.0 ml / min. The fluorescence absorbance was monitored at 280 nm for excitation wavelength and 310 nm for emission wavelength. Temperature control was kept at 408C for the column. The limit of quantitation achieved was 10 ng / ml, and the standard curve was found to be linear in the concentration range of 10–10 000 ng / ml. Under these analytical conditions, a sufficient mephenoxalone plasma concentration profile could be obtained for pharmacokinetic study. 2001 Elsevier Science B.V. All rights reserved.
Keywords: Mephenoxalone
1. Introduction metric or fluorimetric analysis, measurement of
mephenoxalone substance by differential scanning
Mephenoxalone, as Fig. 1 shows, is a tranquilizer calorimetry, and measurement of the hydrolytic
pro-of the propanediol type. It has neuropharmacologic duct of mephenoxalone by a potentiometric method
activity in laboratory animals. Clinical studies indi-cate that mephenoxalone has a therapeutic effect on anxiety disorders and serves as a muscle relaxant in the treatment of muscle spasm in human subjects [1]. There are several assay methods for the determi-nation of mephenoxalone concentration in tablets. These methods involve direct measurement of mephenoxalone in solution by UV
spectrophoto-*Corresponding author. Tel.: 1886-2-2736-1661 ext. 684; fax: Fig. 1. Structures of mephenoxalone and internal standard
(es-1886-2-2737-4214. tradiol).
0378-4347 / 01 / $ – see front matter 2001 Elsevier Science B.V. All rights reserved. P I I : S 0 3 7 8 - 4 3 4 7 ( 0 1 ) 0 0 2 1 6 - X
[2–4]. None of these methods contain a separation filtered and degassed before use. The column
tem-procedure. Only the method described by Jancik et perature was set at 408C.
al. was applied to the determination of
mephenox-alone in biological samples [3]. For pharmacokinetic 2.3. Solution preparation
research, it is important to have both sufficient assay
specificity and sensitivity for mephenoxalone in A stock solution (1 mg / ml) of mephenoxalone
biological samples. However, these reported methods was prepared by dissolving 10 mg of mephenoxalone
are considered to have insufficient specificity and in 10 ml of acetonitrile–water (1:1, v / v) solution and
sensitivity for the determination of mephenoxalone stored at 2808C. Working solutions were also
pre-concentration in biological samples due to an inher- pared in the acetonitrile–water (1:1, v / v) solution at
ent interference by endogenous substances or metab- concentrations of 0.1, 1, 10 and 100 mg / ml and
olites. stored at 48C.
Therefore, the purpose of this study is to report a
simple, sensitive and reproducible high-performance 2.4. Sample preparation
liquid chromatography (HPLC) method for the
de-termination of mephenoxalone concentration in The sample preparation consisted of a single
human plasma. liquid–liquid extraction procedure. A 40-ml volume
of estradiol solution [2 ng / ml in acetonitrile–water (3:1, v / v) solution] as an internal standard was
2. Experimental added to 0.2 ml of plasma sample. A 3-ml volume of
hexane–dichloromethane mixing solution (7:3, v / v)
2.1. Chemicals and reagents as extraction solvent was added to the sample and
vortex-mixed for 30 s. After centrifugation for 10
Mephenoxalone and estradiol were obtained from min at 1945 g, the supernatant was transferred to a
Chemagis (Ramat-Hovav, Israel) and Sigma (St. clean tube and evaporated to dryness under a stream
Louis, MO, USA), respectively. HPLC-grade aceto- of nitrogen at ambient temperature. Then, 200 ml of
nitrile and analytical-grade acetic acid were pur- mobile phase was added and vortex-mixed for 30 s.
chased from BDH (Poole, UK) and E. Merck Finally, 20 ml was injected onto the HPLC system.
(Darmstadt, Germany), respectively. Hexane and
dichloromethane were GR grade and purchased from 2.5. Freeze and thaw stability
E. Merck. All other chemicals were analytically
graded and used without further purification. Freeze and thaw stability for mephenoxalone in
plasma samples was studied in three cycles with two
2.2. Apparatus and chromatographic conditions concentrations (40 and 8000 ng / ml) in six batch
plasmas. Samples were frozen at 2808C for at least
The HPLC system consisted of a Hitachi Model 2 h and then thawed to room temperature for another
L-7100 pump, a Model L-7200 autosampler, a Model at least 2 h.
L-7480 fluorescence detector, and a Model L-7000
HPLC system manager as data processor (Hitachi, 2.6. Standard curve
Japan), and a Model Super CO-150 column oven
(Enshine Scientific, Taiwan). Separation was A standard curve was prepared by adding 20 ml of
achieved on a Cosmosil 5C18-MS column (250 0.1 mg / ml, and 4, 10 and 20 ml of 1, 10 and 100
mm34.6 mm I.D., 5 mm; Nacalai Tesque, Japan). mg / ml of mephenoxalone working solution,
respec-The column eluent was monitored with a fluores- tively, to 0.2 ml of blank plasma and prepared
cence detector (280 nm for excitation wavelength according to the aforementioned sample preparation
and 310 nm for emission wavelength). The procedure. The concentrations used were 10, 20, 50,
mobile phase was water–acetic acid–acetonitrile 100, 200, 500, 1000, 2000, 5000 and 10 000 ng / ml.
was plotted against the concentration of mephenox- during the study. No strenuous activity was allowed.
alone added. Linearity was determined by weighted Water was limited from 1 h pre-dose and until 2 h
2
linear regression analysis (1 /x ). The concentration post-dose of each study phase. The subjects were
of mephenoxalone in the test samples was calculated required to fast for 12 h prior to each study session
using the regression parameters obtained from the until 4 h post-dose.
standard curve. After oral ingestion of one 200 mg of Dorsiflex
tablet (Syntex Pharm, Allschwil / Basel, Switzerland),
2.7. Accuracy and precision blood samples (10 ml each) were collected with
coded vacutainers (green top, containing heparin as
Four different concentrations of mephenoxalone anticoagulant) at the following times: 0 (pre-drug),
(10, 40, 600 and 8000 ng / ml) were added to drug- 0.33, 0.67, 1, 1.33, 1.67, 2, 2.5, 3, 4, 6, 9, 12, 14 and
free plasma and the concentrations were determined 23 h. The blood samples were centrifuged for 10 min
using the corresponding standard curves. The accuracy at 1945 g, immediately. The plasma for each sample
of the method was shown as relative error and was separated and aliquotted into polypropylene
calculated based on the difference between the mean tubes stored at 2808C in a freezer until analysis.
calculated and added concentrations, while precision was evaluated by calculating the within- and
be-tween-run relative standard deviations (RSDs). 3. Results and discussion
2.8. Recovery Mephenoxalone contains a 2-methoxyphenoxy
functional group in its molecule as shown in Fig. 1.
Triplicate human plasma samples at five con- This functional group makes it
fluorescence-absorb-centrations (10, 40, 600, 8000 and 10 000 ng / ml) ing. For analysis of biological samples, applying
were prepared. The internal standard solution was fluorescence detection would be a good choice for its
added to reconstitute the residues of plasma samples specificity. In the development of our analytical
after sample preparation. Solutions of mephenox- method, HPLC involving fluorescence detection was
alone were spiked into the internal standard solution, used. The monitoring wavelengths were set at 280
representing 100% recovery, at the same volume as nm for excitation and 310 nm for emission. Typical
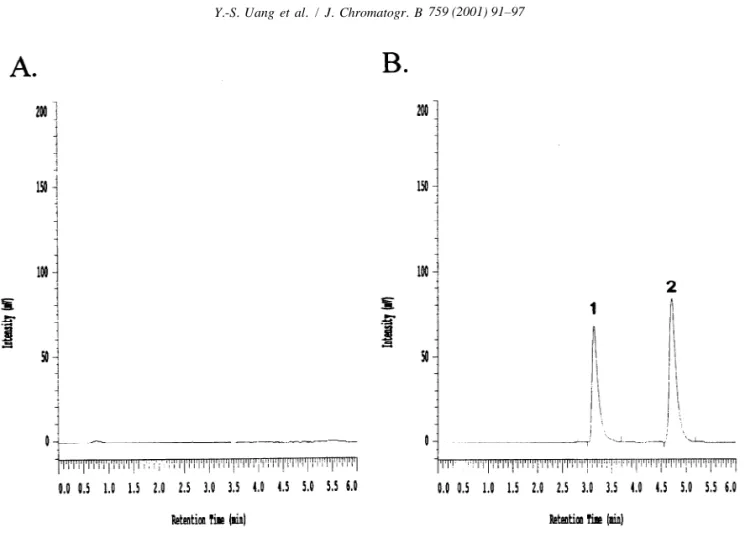
those spiked into plasma samples and prepared in chromatograms are shown in Fig. 2. No significant
triplicate. After analyzing by HPLC, the absolute endogenous peak co-eluted with the mephenoxalone
recovery for mephenoxalone in human plasma after as shown in the corresponding chromatogram of
preparation procedure was determined by comparing drug-free plasma. In addition, the baseline is very
the mean peak height ratio of mephenoxalone in smooth and no interference peak is shown in the
human plasma (called plasma sample) to that of chromatogram except for the front peak. The
re-mephenoxalone in internal standard solution (called tention times for mephenoxalone and internal
stan-solvent sample). dard are 3.1 and 4.7 min, respectively. The analytical
time was only 8 min for a sample analysis.
2.9. Pharmacokinetic study The standard curve for mephenoxalone was made
using 10 spiking plasma samples over a
concen-Four healthy volunteers were selected to enroll in tration range of 10–10 000 ng / ml. In order to cover
the study. Complete physical examinations, blood the concentration range and to increase the sensitivity
chemistry, urinalysis and hematological evaluations, without sacrificing precision and accuracy, it was
and medical history were obtained from the subjects necessary and advisable to use weighted linear
prior to and after to the study, together with chest regression analysis. A linear relationship was
ob-X-rays and EKGs. Written informed consent were tained in the concentration range. Corresponding
2
also obtained from each prospective subject prior to correlation coefficients (r ) were over 0.99 from
the study. No smoking, alcohol and caffeine con- each of six different standard curves in one run
Fig. 2. Typical chromatograms of (A) drug-free plasma, and (B) a plasma sample taken 2 h after oral administration of mephenoxalone to a healthy volunteer. Peaks: 15mephenoxalone; 25internal standard.
separate runs (between-run). The regression parame- in plasma over a relatively wide range of
con-ters (n56) were y50.00100x20.00024 for within- centrations.
run and y50.00097x20.00060 ( y: peak height ratio; The criteria for the determination of the limit of
x: spiking concentration). The relative standard de- quantitation in plasma is based on signal-to-noise,
viations of the slope for six different standard curves the reproducibility of the response and the variability
were 0.9% for within-run and 4.4% for between-run. of the back-calculated concentration. Spiked plasma
The within-run precision and accuracy of standard samples with a final concentration of 10 ng / ml were
curve were evaluated with each of standard curve prepared and analyzed and were found to have a
concentration point after back-calculation. As Table signal-to-noise ratio of $5 for both within-run and
1 shows, RSDs ranged from 2.8 to 6.6% and relative between-run validation (n56). The mean peak height
error from 23.1 to 6.0%. The between-run precision ratio and standard deviation were 0.009453 and
and accuracy of standard curve were also evaluated 0.000771 for within-run validation, and 0.009045
with each standard curve concentration point after and 0.000581 for between-run validation,
respective-back-calculation. As Table 2 shows, RSDs ranged ly. The mean peak height ratio was greater than three
from 1.6 to 5.9% and relative error from 21.4 to standard deviations and the relative standard
devia-2.5%. These results indicate that the standard curve tions of the peak height ratio were only 8.2 and 6.4%
had a good linearity after weighted linear regression for within-run and between-run validations,
respec-analysis and was reproducible. It also shows that the tively. The relative standard deviation and relative
Table 1
Reproducibility of the standard curve (n56)
Spiking plasma Within-run Between-run
concentration
a a b
(ng / ml) Concentration RSD Relative Concentration RSD Relative error b
calculated (%) error calculated (%) (%)
(mean6SD) (%) (mean6SD) (ng / ml) (ng / ml) 10 9.6960.45 4.6 23.1 9.9560.31 3.1 20.5 20 21.261.4 6.6 6 20.561.2 5.9 2.5 50 50.461.8 3.6 0.8 49.861.3 2.6 20.4 100 97.763.8 3.9 22.3 99.062.5 2.5 21 200 199612 6 20.5 20366 3 1.5 500 498621 4.2 20.4 49368 1.6 21.4 1000 1004628 2.8 0.4 1006621 2.1 0.6 2000 2005674 3.7 0.3 2030656 2.8 1.5 5000 49646192 3.9 20.7 49546139 2.8 20.9 10 000 98826304 3.1 21.2 10 0396245 2.4 0.4 a RSD5100%3(SD/ mean). b
Relative error5100%3(concentration calculated2spiking plasma concentration) / spiking plasma concentration.
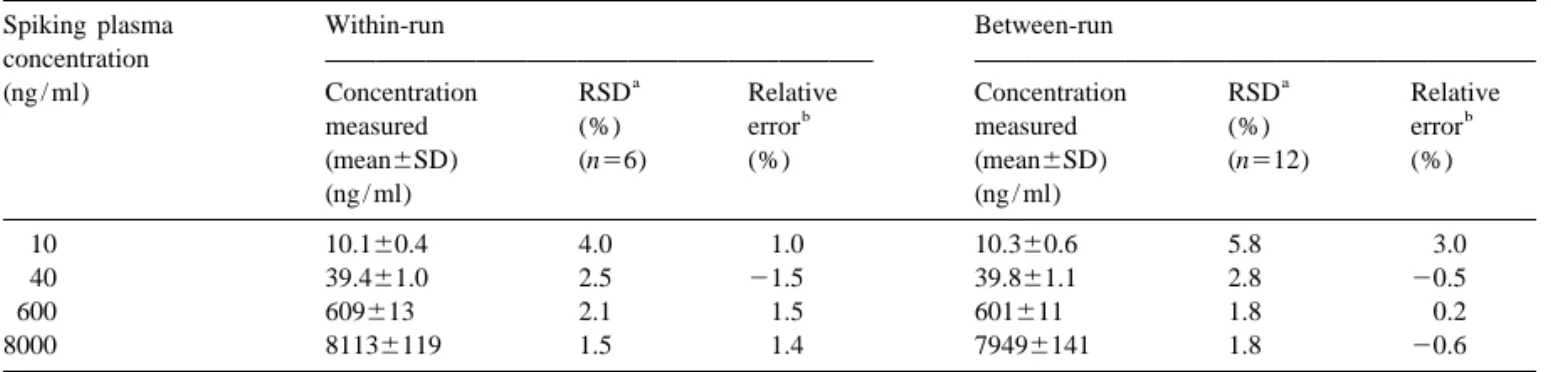
and 23.1% for within-run validation, and 3.1 and between 1.8 and 5.8%. The accuracy for within-run
20.5% for between-run validation, respectively, as and between-run was from 21.5 to 1.5% and from
Table 1 shows. These results indicate that the limit 20.6 to 3.0%, respectively, over the concentrations
of quantitation is 10 ng / ml and that the variability is examined. These results show that the method has
less than 20%, which shows that the limit of both good reproducibility and accuracy.
quantitation has acceptable accuracy, precision and To obtain good extraction efficiency and remove
reproducibility. interfering peak, a hexane–dichloromethane (7:3, v /
Within- and between-run accuracy and precision v) mixture was used as extraction solvent. The result
were examined by performing replicate analyses of indicated that no significant endogenous peak was
plasma samples (n56) to which four different known coeluted with the mephenoxalone as shown in the
concentrations of mephenoxalone had been added. corresponding chromatogram of drug-free plasma
As Table 2 shows, the within-run precision was (Fig. 2A). The absolute recovery for mephenoxalone
between 1.5 and 4.0% over the concentrations ex- in plasma after the extraction procedure was found to
amined. In addition, between-run precision was be 68.6%, as shown in Table 3. It indicates that the
Table 2
Precision and accuracy (analysis with spiking plasma samples at four different concentrations)
Spiking plasma Within-run Between-run
concentration
a a
(ng / ml) Concentration RSD Relative Concentration RSD Relative
b b
measured (%) error measured (%) error
(mean6SD) (n56) (%) (mean6SD) (n512) (%) (ng / ml) (ng / ml) 10 10.160.4 4.0 1.0 10.360.6 5.8 3.0 40 39.461.0 2.5 21.5 39.861.1 2.8 20.5 600 609613 2.1 1.5 601611 1.8 0.2 8000 81136119 1.5 1.4 79496141 1.8 20.6
Table 3 Recovery
a
Spiking plasma Peak height ratio (mean6SD) Recovery
concentration (%)
(ng / ml) Water sample Plasma sample
(n53) (n53) 10 0.0041260.00019 0.0027560.00002 66.9 40 0.0160560.00030 0.0111460.00021 69.4 600 0.2596260.00216 0.1801860.00119 69.4 8000 3.5167060.01455 2.4101860.01360 68.5 10 000 4.4797760.00735 3.0839060.03153 68.8 a
Recovery5100%3(peak height ratio of plasma sample / peak height ratio of water sample).
hexane–dichloromethane (7:3, v / v) mixture is a stability in plasma sample after three freeze and thaw
good medium for extraction of mephenoxalone from cycles.
plasma sample. The procedure was applied to a pharmacokinetic
The freeze and thaw stability study proposes a study in which mephenoxalone was orally
adminis-short-term stability of compound in plasma sample in tered to four healthy volunteers. Typical plasma
the thaw procedure. Furthermore, some plasma pro- concentration–time profiles are shown in Fig. 3. The
tein could coagulate after freezing and precipitating plasma concentrations of mephenoxalone were in the
after thaw. Owing to the fact that this compound standard curve range and remained above the 10
could bind to plasma protein, the phenomenon of ng / ml quantitation limit for the entire sampling
plasma protein coagulation in frozen condition and period. The pharmacokinetic parameters obtained
precipitation at room temperature after thaw would were described as follows. The value of area under
result in concentration loss of the compound. As the plasma concentration–time curve from time 0 to
Table 4 shows, the differences of mephenoxalone the last sampling time (AUC0 – t) was 15 94267096
concentrations between initial and each cycle were (ng / ml3h), and area under the plasma
concentra-less than 10% for both concentrations (40 and 8000 tion–time curve from time 0 to time infinite
ng / ml). In addition, there are no statistical signifi- (AUC0 – `) was 16 27467340 (ng / ml3h). The
ob-cant differences between cycles by two-way analysis served maximum plasma concentration (Cmax) was
of variance (ANOVA) analysis for both concentra- 28496535 (ng / ml), time to observed maximum
tions. It indicates that mephenoxalone has a good plasma concentration (Tmax) was 2.1760.58 h, and
elimination half-life was 2.7761.21 h. In addition, the plasma concentration–time profile of
mephenox-Table 4 alone for the entire sampling period can depict about
Freeze and thaw stability 90% of absorption according to the ratio of AUC 0 – t Cycle Concentration (ng / ml) divided by AUC0 – `.
These results demonstrate that this method is
40 8000
simple, sensitive, reproducible and accurate and
Initial 35.562.1 78826119
meets the requirement of the report of the conference
1 37.462.2 80846163 on Analytical Methods Validation: Bioavailability, a
(5.4%) (2.6%)
Bioequivalence and Pharmacokinetic studies [5]. As
2 38.062.2 80816115 shown by the data obtained during a pharmacokinetic (7.0%) (2.5%) study in which this particular method was applied, it 3 38.162.5 80146251 is concluded that the method described here offers
(7.3%) (1.7%) the opportunity to derive pharmacokinetic parameters a
Fig. 3. Plasma concentration–time profile of mephenoxalone after oral administration of Dorsiflex tablet to four healthy volunteers. Data are shown as mean6SD.
[4] J. Dohnal, Z. Volkova, K. Vytras, J. Pharm. Biomed. Anal. 7
References
(1989) 755.
[5] V.P. Shan, K.K. Midha, S. Dighe, I.J. McGilveray, J.P. [1] J.A. Morrison, Arch. Int. Pharmacodyn. Ther. 157 (1965) Skelly, A. Yacobi, T. Layloff, C.T. Viswanathan, C.E. Cook,
385. R.D. McDowall, K.A. Pittman, S. Spector, Pharm. Res. 9
[2] N. Erk, J. Pharm. Biomed. Anal. 21 (1999) 429. (1992) 588. [3] F. Jancik, J. Dohnal, B. Kakac, Z. Kollnerova, J. Pospisilova,