國 立 交 通 大 學
企業管理碩士學位學程
碩 士 論 文
播客業交換結果滿意度與客戶忠誠度研究
Exchange Outcome Satisfaction and
Customer Loyalty in Podcasting
研 究 生: 宋子豪 Austin Thompson
指導教授: 姜真秀 Prof. Jin-Su Kang
播客業交換結果滿意度與客戶忠誠度研究
Exchange Outcome Satisfaction and
Customer Loyalty in Podcasting
研究生: 宋子豪 Student: Austin Thompson
指導教授: 姜真秀 Advisor: Prof. Jin-Su Kang
國 立 交 通 大 學
管理學院
企業管理碩士學位學程
碩 士 論 文
A Thesis Submitted to Master Degree Program of Global Business Administration
College of Management
National Chiao Tung University
In Partial Fulfillment of the Requirements for the Degree of Master in Business Administration
June 2014
Hsinchu, Taiwan, Republic of China
Abstract
The present study seeks to test the relationship between customer satisfaction and customer loyalty in the podcasting industry. Among customer satisfaction models, the exchange outcome satisfaction model (information satisfaction, social exchange satisfaction and recreation satisfaction) modified for podcasts is used, and configural methods (fsQCA software) is used to test the proposition of whether exchange outcome satisfaction results in attitudinal loyalty and behavioral loyalty.
The empirical data the student uses 1341 responses collected from the listenership of The
Adam Carolla Show, one of the most popular podcasts in the United States. Overall,
exchange outcome satisfaction (a combination of information satisfaction, social exchange satisfaction, and recreation satisfaction) was not more necessary or sufficient to result in either attitudinal loyalty or behavioral loyalty than was the combination of recreation satisfaction and information satisfaction together It was found that exchange outcome satisfaction is not any more necessary or sufficient to result in the presence of attitudinal loyalty or behavioral loyalty than the presence of either recreation satisfaction or information satisfaction alone. It was also found that the antecedents for behavioral loyalty and attitudinal loyalty are very similar, and thus the research proposition is not supported.
Furthermore, demographic analyses show that, males with one dimension of exchange outcome satisfaction are highly likely to have both attitudinal and behavioral loyalty. Conversely, education level and age do not have a significant effect on loyalty.
Keywords: customer satisfaction, customer loyalty, exchange outcome satisfaction,
Acknowledgments
I would like to sincerely thank Mike August and all the staff at the Adam Carolla show for all the support and help in conducting this research. Mr. August and the staff there took time out of their outrageously hectic schedules to assist me, receiving nothing in return, and for this I am very grateful.
I would also like to thank Charles Ragin and all the developers of the fsQCA software for making the fruits of their hard work available free online to students like me.
I would also like to thank my advisor Prof. Jin-Su Kang for her unending patience, tireless effort and helpful suggestions in assisting me with this research
Table of Contents
Abstract ... i
Acknowledgments ... iii
Table of Contents ... iv
List of Tables ... vi
List of Figures ... vii
List of Symbols ... viii
List of Appendices ... ix
I. Background and Problem Statement ... 1
1.1 Background ... 1
1.2 Goals and Objectives of the Research ... 2
II. Podcasting ... 4
2.1 Podcasting Definition ... 4
2.2 History ... 5
2.3 Commercial Implications ... 7
III. Literature review ... 9
3.1 Customer Satisfaction ... 9
3.2 Customer Loyalty ... 11
3.3 Research Gap and Contribution ... 15
IV. Methodology ... 17 4.1 Research Approach... 17 4.2 Data ... 17 4.3 QCA as an approach ... 18 4.4 QCA in application ... 18 4.5 Assumptions of QCA ... 21
4.6 Understanding fsQCA results ... 22
4.7 Advantages of fsQCA ... 24
5.1 Descriptive Statistics ... 27
5.2 Necessary Conditions ... 29
5.3 Sufficient Conditions ... 31
5.4 Results by gender, age and education ... 33
5.5 Analysis by SEM ... 42
VI. Summary and conclusions ... 45
6.1 Summary ... 45
6.2 Discussion ... 46
6.3 Limitations and opportunities for further research... 48
VII. References ... 50
List of Tables
Table 1 Calibration values ...19
Table 2 Correlations between items (before calibration) ...29
Table 3 Necessary conditions for attitudinal loyalty ...30
Table 4 Necessary conditions for behavioral loyalty ...31
Table 5 Intermediate solution for causal configuration of attitudinal loyalty ...32
Table 6 Intermediate solution for causal configuration of behavioral loyalty ...32
Table 7 Necessary conditions for attitudinal loyalty by gender ...34
Table 8 Necessary Conditions for behavioral loyalty by gender ...35
Table 9 Intermediate solution for causal configuration of attitudinal loyalty by gender ...36
Table 10 Intermediate solution for causal configuration of behavioral loyalty by gender ...36
Table 11 Necessary conditions for attitudinal loyalty by age ...37
Table 12 Necessary conditions for behavioral loyalty by age ...38
Table 13 Intermediate solution for causal configuration of attitudinal loyalty by age ...39
Table 14 Intermediate solution for causal configuration of behavioral loyalty by age ...39
Table 15 Necessary conditions for attitudinal loyalty by education level ...40
Table 16 Necessary conditions for behavioral loyalty by education level ...41
Table 17 Intermediate solution for causal configuration of attitudinal loyalty by education level ...42
Table 18 Intermediate solution for causal configuration of behavioral loyalty by education level ...42
List of Figures
Figure 1 Awareness of Podcasting ... 7
Figure 2 Cognitive Model of Customer Satisfaction ... 9
Figure 3 Affect Model of Customer Satisfaction ...10
Figure 4 The two types of customer loyalty...11
Figure 5 The relationship between satisfaction, loyalty and profitability ...12
Figure 6 The exchange outcome satisfaction model of customer satisfaction and loyalty ...13
Figure 7 Listenership by gender ...27
Figure 8 Listenership by age ...28
Figure 9 Listenership by education level ...28
List of Symbols
+ : (Boolean algebra) and * : (Boolean algebra) or ~ : (Boolean algebra) not Information : information satisfaction Social : social exchange satisfaction Recreation : recreation satisfaction A. Loyalty : attitudinal loyalty B. Loyalty : behavioral loyalty
Gender : male
~Gender : female
Age : membership in set “age” (high age) ~Age : non-membership in set “age” (low age)
Edu : membership in set “education” (high education level) ~Edu : non-membership in set “education” (low education level)
List of Appendices
Appendix 1 The Adam Carolla Show logo ...53 Appendix 2 Survey questions ...54
I. Background and Problem Statement
1.1 BackgroundMedia is increasingly moving from “old media” to “new media,” a term that has, in large part, come to mean digital media (Steele, 2012).Not long ago, the media landscape was dominated by television, radio and newspapers alone, traditional means of information delivery owned by a small number of large companies. With the proliferation of the internet and later smart phones, the media landscape has changed dramatically. Traditional media companies now have to contend with blogs, online content aggregation sites, and a variety of other new media threats. This change in the media landscape also necessitates a new strategy that can allow companies to compete effectively.
One of the most prevalent forms of new media is podcasting. A combination of the name of Apple’s mp3 player “iPod” and “broadcasting,” podcasting is the term used to describe audio recordings that users download or listen to via the internet (Mitchell, Olmstead, & Santhanam, 2013). Podcasting is increasingly popular, and as of 2010, there were about 90,000 podcasts available (Olmstead, Mitchell and Rosenstiel, 2012).
Problem Statement
Podcasts rely on a variety of business models, most prevalent among them is advertising. A huge number of podcasts compete for a relatively small number of advertisers willing to take a risk in advertising on a relatively new medium. There is fierce competition to attract those that do, and listenership and listener loyalty is a deciding factor when advertisers choose podcasts.
listeners of this podcast to exhibit attitudinal loyalty (i.e. having positive feelings about the
podcast) and behavioral loyalty (i.e. exhibiting loyalty or “repeat purchase” behavior). In
this context, loyalty behaviors include listening to the podcast to the end (thus being exposed to all the advertising contained therein) as well as supporting advertisers on the podcast, both critical for podcasts to stay competitive.
1.2 Goals and Objectives of the Research
The research focuses on the link between customer satisfaction and customer loyalty. Long thought to be important only for tangible consumer goods, customer loyalty is now a concern for all types of firms (Basu and Dick, 1994). Customer loyalty has been linked to higher profitability (Anderson and Fornell, 1994) as firms with high customer loyalty need to spend less on acquiring new customers and can rely on their existing customer base to make repeat purchases.
This leads to the question of how a firm can cultivate customer loyalty, or, in other words, what causes customers to be loyal. Customer satisfaction has long been thought to be one of the key factors leading to customer loyalty. However, what precisely constitutes customer satisfaction and the nature of its effect on customer loyalty have been a subject of debate in academia for decades (Basu and Dick, 1994). It is clear that customer satisfaction and customer loyalty are linked, but the nature of this link is in contention and appears to vary based on industry and type of industry.
Research Question
As it is clear that the link between customer satisfaction and customer loyalty is one that must be explored further and, as new media and electronic media are important but not well-researched industries, the focus of the present research is on the link between customer
satisfaction and customer loyalty in podcasting. Specifically, the research uses a modified version of the exchange outcome satisfaction model of customer satisfaction to ask the question:
Does exchange outcome satisfaction (information satisfaction, social exchange satisfaction, and recreation satisfaction) lead to high customer loyalty in listeners of
podcasts?
Research Propositions
The present report sets forth three main propositions to be tested. They are:
A podcast listener’s exchange outcome satisfaction has a positive influence on attitudinal loyalty, more than any of the individual dimensions of satisfaction alone.
A podcast listener’s exchange outcome satisfaction has a positive influence on behavioral loyalty, more than any of the individual dimensions of satisfaction alone.
A podcast listener’s gender, age, or education level will not affect his or her loyalty, either attitudinal or behavioral.
II. Podcasting
2.1 Podcasting DefinitionThe term “podcast” is a combination of the words “iPod” and “broadcast.” According to Duraes et al. (2007),
“Podcasts are media files that can be distributed via the Internet and played on computers and handheld devices, including iPods or other digital audio players. The essence of podcasting is the creation of audio and/or video content for an audience that wants to listen to what they want, when they want, where they want, and how they want.”
The word podcast contains a reference to Apple’s Mp3 player, the iPod, but podcasting is not limited by platform or device. In general, users download podcasts through portals such as Apple’s mobile podcast application or the Windows 8 podcast application, but many podcasts are also available directly through the podcast provider’s website or a proprietary app offered by the podcast provider. Podcasts can also be “streamed,” in which the listener uses a mobile application or computer program to listen to the podcast directly from the source without downloading.
Although the term “podcast” can refer to audio, visual, or text, the vast majority of podcasts currently available are audio podcasts; due to the proliferation of listening devices such as Mp3 players and mobile phones during the 2000s, audio podcasting became the dominant form of podcasting, and thus in general (and in the present report) the term “podcast” refers audio podcasting exclusively.
Podcast format varies greatly from provider to provider. Spoken word podcasts with formats similar to shows on terrestrial radio tend to be the dominant style; music-oriented podcasts also exist, but are rarer due to legal and copyright issues.
2.2 History
The term “blog,” (a shortened version of “web log”) has been in common usage for quite some time, and audio blogging, which refers to posting an audio recording as a blog post, has long been a common practice. However, the history of podcasting, which can be thought of as an audio blog post synched to another device, begins in the early 2000s.
In the early 2000s, a software developer named Dave Wiener developed “really simple synchronization,” or RSS. RSS allowed bloggers to synch information automatically, and was compatible with many different devices and formats. In 2003, Wiener used his RSS to synch audio content on his blog, marking one of the first times that what we now know as a “podcast” was produced. Also in 2003, another software developer Steven Curry used RSS to synch audio content to iTunes, a technology critical to the development of the medium.
In 2005, journalist Ben Hammersley wrote an article in The Guardian on the state of internet radio. In this article, he noted the lack of appropriate terminology to describe internet radio as a distinct phenomenon and, among others, proposed the term “podcast,” a combination of the words iPod and broadcast, as a solution. The name became widespread as the year progressed, and in June of that year, Apple added a podcast feature to its iTunes software and iTunes store.
Podcasting continued to grow in popularity over the next few years. British comedian Ricky Gervais began offering a podcast through Guardian Unlimited from late 2005 through early 2006. It was consistently the highest ranked podcast available, and in the 2007 edition of The
Guinness Book of World Records, it was certified as the most downloaded podcast in the
million total downloads within two months of its release (Guinness World Records Limited, 2006).
The next two years saw the medium of podcasting mature as content providers looked for ways to more effectively monetize. In 2006, podcaster Lance Anderson became the first podcaster to hold a live show, in which he taped an episode of his podcast in front of a live, paying audience. This is now common practice and widely used by many popular podcasts. The next year, podcasters Jack and Stench began offering a podcast with a monthly subscription fee, marking one of the first successful implementation of this business model.
As awareness of podcasting grew, so did its scope. In 2009, comedian and radio personality Adam Carolla began offering a daily podcast. According to The Guinness Book of World
Records, between 2009 and 2011, the Adam Carolla Podcast (later the Adam Carolla Show),
was downloaded a total of 59.6 million times, making it the most downloaded podcast in the world to date (Guinness World Records Limited, 2011).
2.3 Commercial Implications
Podcast Market and Listenership
Since podcasts are available through such a variety of channels, it is difficult to arrive at the exact number of podcasts available. However, as a point of reference, Pew Research estimated the number of English language podcasts available in 2010 to be 90,000 (Olmstead, Mitchell and Rosenstiel, 2012), and Apple’s iTunes offers podcasts in 155 countries worldwide.
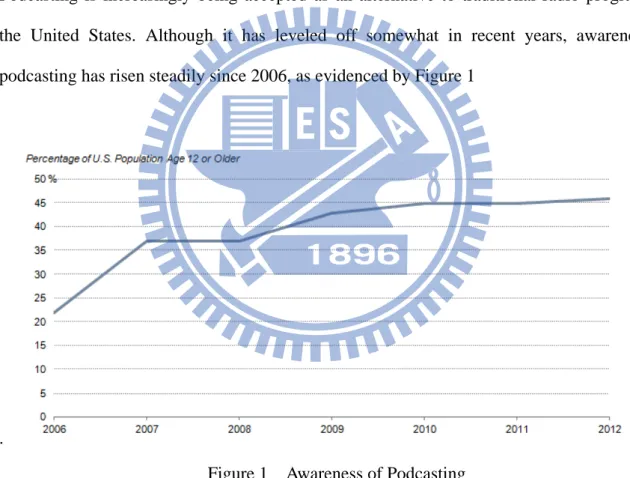
Podcasting is increasingly being accepted as an alternative to traditional radio programs in the United States. Although it has leveled off somewhat in recent years, awareness of podcasting has risen steadily since 2006, as evidenced by Figure 1
.
Figure 1 Awareness of Podcasting Source: Mitchell et al, 2013
Additionally, the number of Americans who had listened to an audio podcast rose 18% in the period between 2006 and 2012, and the number that had watched a video podcast rose 16% in that same period (Webster, 2012).
Podcasting as a business
As the idea of podcasting as a business is relatively new, it has not been extensively studied. The majority of literature regarding podcasting specifically only addresses podcasting as an auxiliary medium to achieve other goals, not as a means by which to make money; examples include podcasting’s role in education (Evans, 2008; Hew, 2007).
Crofts et al. (2005) indentify several business models used by podcasts.
Sponsorships. Corporations sponsor proprietary podcasts. In other words, one company provides all the advertising for an entire podcast. Example: Volvo’s podcast at autoblog.com.
Advertising. Podcasters or parent companies solicit advertising from a variety of sources that plays at various points during the show, often times at the beginning and end. Examples: The Adam Carolla Show, Freakonomics, etc.
Listener donations. Podcast hosts or parent companies solicit donations directly from listeners, either via direct appeals during the podcast, email solicitations, or other means.
Cooption. Existing broadcasters use the podcast medium to distribute existing content, either from TV or radio. A prominent example of a company using this business model is the US company PRI, which produces shows for American public radio and also distributes many of them as podcasts.
Paid subscription models. Companies charge a fee in order to access podcast content. With the proliferation of smart phones and the popularity of platforms such as Apple’s iTunes, this business model appears to have fallen somewhat out of favor with podcasters; however, some podcasters still require a fee for customers to access archived or special content.
III. Literature review
3.1 Customer SatisfactionLiterature regarding customer satisfaction abounds, but a precise definition or model to explain customer satisfaction is somewhat difficult to come by. What can be thought of as a tacit definition of customer satisfaction was articulated by Oliver (1980) as a customer’s post-purchase response to the product, which could fall into one of two categories, either “complaint” or “intention to repurchase.” While somewhat unspecific, this model of customer satisfaction is the most prevalent in research regarding this topic.
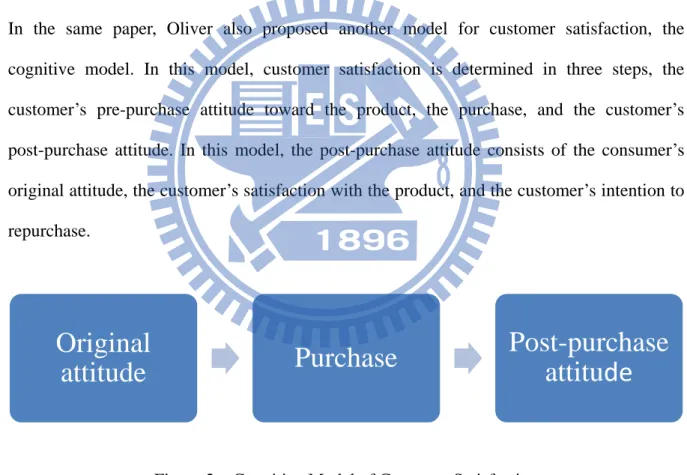
In the same paper, Oliver also proposed another model for customer satisfaction, the cognitive model. In this model, customer satisfaction is determined in three steps, the customer’s pre-purchase attitude toward the product, the purchase, and the customer’s post-purchase attitude. In this model, the post-purchase attitude consists of the consumer’s original attitude, the customer’s satisfaction with the product, and the customer’s intention to repurchase.
Figure 2 Cognitive Model of Customer Satisfaction Source: Oliver (1993)
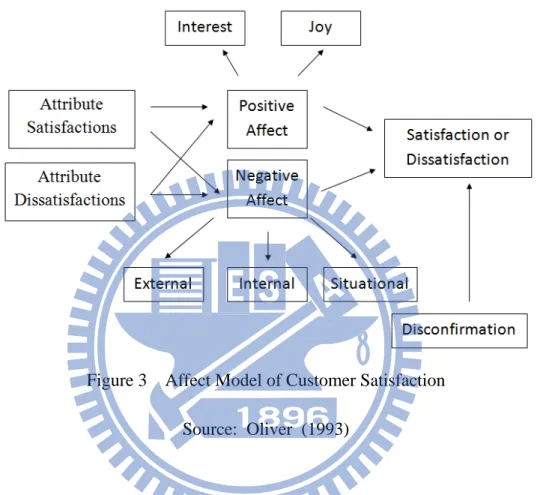
In 1993, Oliver proposed another model for customer satisfaction that built on his previous one. The affect model of satisfaction examines customer satisfaction from the perspective of affect, or the customer’s feelings. Oliver (1993) summarizes this perspective:
Original
attitude
Purchase
Post-purchase
attitude
The consumers subjective satisfaction judgment resulting from observations of attribute performance and can be considered to be the psychological fulfillment response customers make when assessing performance.
Figure 3 Affect Model of Customer Satisfaction Source: Oliver (1993)
Oliver’s paper presents four key findings, namely that attribute satisfaction leads to positive affect, attribute satisfaction and dissatisfaction will have direct effects on overall product or service satisfaction judgments, positive and negative affect will directly influence overall product or service satisfaction judgments, and that disconfirmation will be significantly related to satisfaction.
This paper is widely cited by other researchers and these findings are crucial to understand customer behavior; in short, customer satisfaction is not dictated by a customer’s satisfaction with the product attributes alone, but rather by a combination of attribute satisfaction, the
customer’s pre-purchase attitude, and affect.
3.2 Customer Loyalty
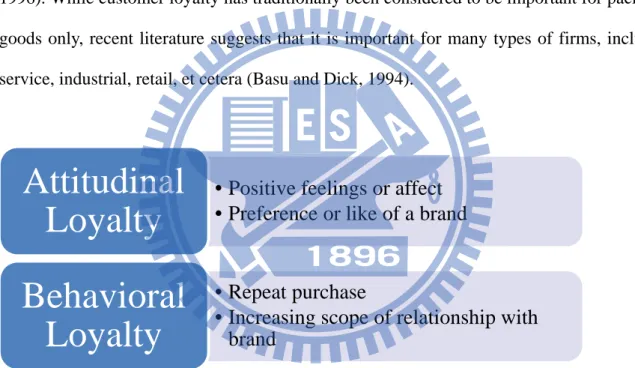
According to the marketing literature, customer loyalty can be defined in two distinct ways: attitudinal and behavioral (Jacoby and Kyner, 1973). Attitudinal loyalty refers to the attachment that a consumer feels toward a particular brand, while behavioral loyalty refers to loyalty behaviors such as repeated purchase from the same supplier, increasing the scale or scope of a relationship with a supplier, or recommending a supplier to others (Hallowell, 1996). While customer loyalty has traditionally been considered to be important for packaged goods only, recent literature suggests that it is important for many types of firms, including service, industrial, retail, et cetera (Basu and Dick, 1994).
Figure 4 The two types of customer loyalty Source: Hallowell, 1996
There is also extensive research into the factors that result in customer loyalty; this research, in general, is highly specific to an individual industry or subset of industries. For example, research on the hotel industry has shown that the most important factors for cultivating customer loyalty include customer satisfaction with housekeeping and hotel image (Kandampully & Suhartanto, 2000), while another study of the hospital industry found that
• Positive feelings or affect
• Preference or like of a brand
Attitudinal
Loyalty
• Repeat purchase
• Increasing scope of relationship with
brand
Behavioral
Loyalty
customer satisfaction in some areas (ex: billing process) had an impact on profitability, but satisfaction in other areas (ex: nursing and daily care) did not (Nelson et al, 1992). Thus, there is little consensus between industries and disciplines on the antecedents of customer loyalty.
Links between Customer Satisfaction, Customer Loyalty and Profitability
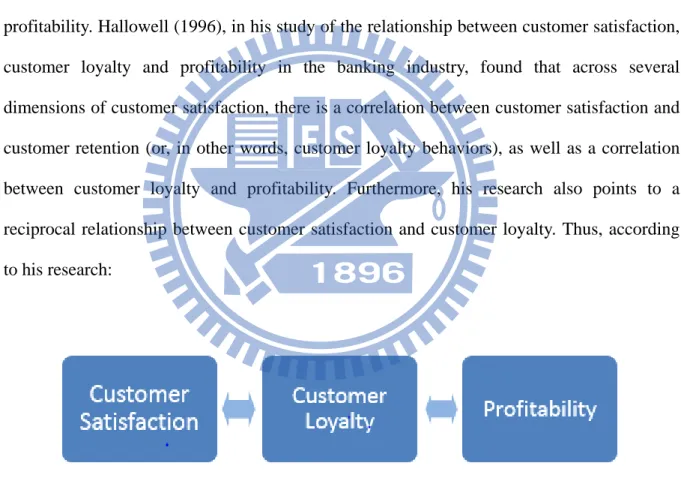
In order to understand the importance of customer loyalty to a firm, it is important to understand customer loyalty’s impact on and relationship with customer satisfaction and profitability. Hallowell (1996), in his study of the relationship between customer satisfaction, customer loyalty and profitability in the banking industry, found that across several dimensions of customer satisfaction, there is a correlation between customer satisfaction and customer retention (or, in other words, customer loyalty behaviors), as well as a correlation between customer loyalty and profitability. Furthermore, his research also points to a reciprocal relationship between customer satisfaction and customer loyalty. Thus, according to his research:
Figure 5 The relationship between satisfaction, loyalty and profitability Source: Hallowell, 1996
The findings of Srinivasan et al. (2002) and Rangaswamy et al. (2003) echo those of Hallowell. However, the degree of the correlation, as well as any inference of any casual relationships, require further research.
Customer Loyalty in Internet-Based Industries
Literature regarding customer loyalty in internet-based industries exists, but is limited. Thus far, research indicates that antecedents leading to customer loyalty in internet based industries differ from those in traditional industries.
For example, Srinivasan et al (2002) identified eight factors, customization, contact interactivity, care, community, convenience, cultivation, choice, and character that affect loyalty in e-commerce industries (e-loyalty), and found all of them except convenience to have an effect.
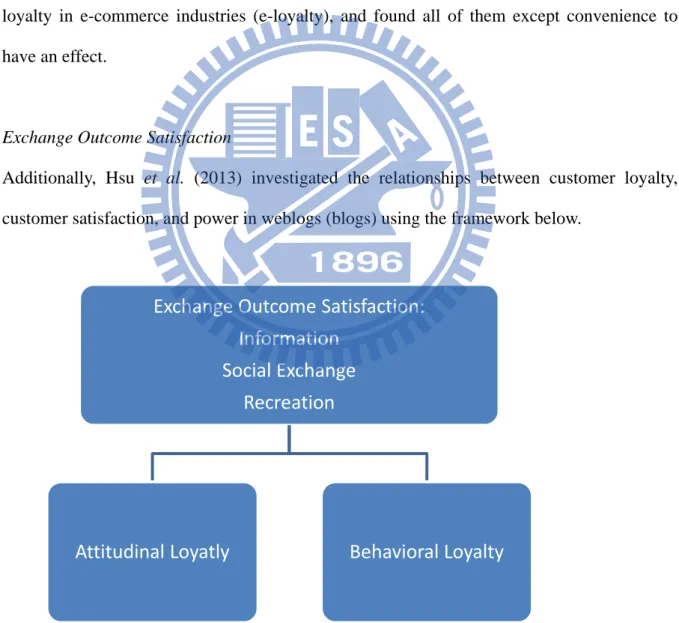
Exchange Outcome Satisfaction
Additionally, Hsu et al. (2013) investigated the relationships between customer loyalty, customer satisfaction, and power in weblogs (blogs) using the framework below.
Figure 6 The exchange outcome satisfaction model of customer satisfaction and loyalty Source: Hsu et al., 2013
Exchange Outcome Satisfaction:
Information
Social Exchange
Recreation
Using the three dimensions of exchange outcome satisfaction as outlined above, as well as the previously described concepts of attitudinal loyalty and behavioral loyalty, the researchers proposed the hypotheses:
1. A blog reader’s exchange outcome satisfaction has a positive influence on attitudinal loyalty.
2. A blog reader’s exchange outcome satisfaction has a positive influence on behavioral loyalty.
The researchers found that exchange outcome satisfaction (or readers’ satisfaction with the blog’s content) did not have a significant effect on behavioral loyalty (and thus H2 is not supported), it did have a significant positive effect on attitudinal loyalty (H1 was supported).
This model is consistent with Oliver’s assertion that affect is crucial to understanding the satisfaction response, as well as with the current understanding of the two types of loyalty. Also, essentially all of the reasons why one might be satisfied or dissatisfied with a podcast fall are covered by this model, and is thus is an effective way to explain this small subset of e-loyalty. As blogs are similar to podcasts in structure, content, et cetera, a modified version is presented here to be used in the present research.
Information satisfaction
This refers to the listener’s satisfaction with the content of the podcast, as well as the relevance of the information contained therein. When a reader is convinced that a particular podcast serves his or her informational needs better than other podcasts, it is likely to become his or her favorite. Information satisfaction includes satisfaction with the variety of information presented, the relevance of information presented, et cetera.
The social benefits that one derives from maintaining social connectivity and thus gaining acceptance and approval from others are important in motivating a consumer to take part in an online community (Dholakia et al., 2004). Thus, the second dimension exchange outcome satisfaction is social exchange satisfaction.This refers to the listener’s satisfaction with the degree to which he or she can interact with the podcast itself as well as other listeners of the podcast. Podacsting is an internet-based medium characterized by small, tight-knit communities of content providers and fans; it thus follows that evaluating the listener base’s social exchange satisfaction would be critical.
Social exchange satisfaction can refer to satisfaction with how much comments on the blog affect the content of the blog, how much comments on the blog are discussed by other readers, as well as the degree of satisfaction with interaction with other listeners at offline events, etc.
Recreation satisfaction
According to Chitturi et al. (2008), recreation satisfaction is the extent to which a reader experiences fun and pleasure when participating in a podcast. Although podcasting is used in education, the medical field, and other similar contexts, it is primarily a recreational medium and thus it follows that recreational satisfaction is the third dimension of exchange outcome satisfaction. Recreation satisfaction includes
3.3 Research Gap and Contribution
The antecedents of and precise nature of the connection between customer satisfaction and customer loyalty are in debate and have been for quite some time. This link must be explored further, as it is apparent that higher levels of loyalty lead to higher profitability for firms. Furthermore it appears, especially in the case of customer satisfaction, that the antecedents vary from industry to industry, as well as between service industries and other
industries.
The importance of e-loyalty will only grow in the future, but the literature regarding it remains somewhat vague and unspecific. Further research is warranted, and in order to ensure that it provides the greatest degree of practical understanding, this research must target specific facets of e-loyalty
It is the intent of the research to use a version of the exchange outcome satisfaction model modified for podcasting to explore the connection between satisfaction and loyalty in this industry. The present report also seeks to expand upon the findings of the previous research by ascertaining which combinations of the three dimensions of exchange outcome satisfaction (information satisfaction, social exchange satisfaction, and recreation satisfaction) lead to the highest levels of attitudinal loyalty and behavioral loyalty.
This research will contribute to the literature in the following ways. First, podcasting, while an innovative part of the new media phenomenon that is growing in popularity, has not been researched and is not well understood. This research will explain the motivations of podcast listeners and be a starting point for further research. In this way, it will also have practical commercial applications. Understanding the motivations of podcast listeners will help podcast content providers grow and monetize their podcasts.
Also, this research will further the research regarding e-loyalty and its antecedents. It will test the applicability and appropriateness of the exchange outcome satisfaction model to explain customer satisfaction and loyalty in podcasts. This model could then be used to understand the causes of e-loyalty in a much broader context.
IV. Methodology
4.1 Research ApproachThe research approach used was qualitative comparative analysis (QCA), using the fuzzy set calibration approach (fsQCA), which tells researchers combinations of antecedents that lead to a certain, predetermined outcome. fsQCA is described in more detail in the following sections
This research approach was deemed appropriate due to the nature of the antecedents being tested as well as the nature of the outcome that is being researched. Statistical analysis tests each individual variable’s effect on the outcome, and tries to isolate the effect of each independent variable on the dependent variable. The three main antecedents being tested, information satisfaction, social exchange satisfaction and recreation satisfaction are all dimensions of exchange outcome satisfaction and it cannot be assumed that they are independent of each other.
Furthermore, the research focuses on the question of what combinations lead to high levels of loyalty, and is thus not necessarily concerned with the effect of each individual independent variable, but rather on net outcome of all three together. For these reasons, qualitative analysis using fsQCA is most appropriate method to conduct this research.
4.2 Data
Data was collected via a survey that tested levels of exchange outcome satisfaction and behavioral and attitudinal loyalty in podcast listeners. Questions regarding demographic information, as well the listeners’ device usage habits were added as well. The full text of the survey is available in appendix 2.
The survey was given to the management team at The Adam Carolla Show, one of the most popular podcasts in the world, and made available to listeners via the show’s Facebook page. Results were collected over a two-day period, and in all, 1341 usable responses were collected. Data was analyzed to find the necessary and sufficient conditions of both attitudinal and behavioral loyalty.
4.3 QCA as an approach
Qualitative comparative analysis, (QCA) is an approach that mixes both quantitative and qualitative techniques, used for investigating complex configurations of antecedents (Ordanini, Parasuraman, and Rubera, 2013). According to Ragin (2000), it is “a set-membership analytical technique appropriate for complex configuration analyses.” QCA performs cross case analysis, that shows relationships among and between variables based on set membership, then uses Boolean Algebra to determine which combinations of antecedents (if any) are necessary and or sufficient to produce an outcome.
Due to the underlying assumptions of QCA, unlike statistical analysis, QCA only shows the combinations of antecedents that can or do result in an outcome, and does not tell researchers the relative importance of the antecedents.
4.4 QCA in application
The use of QCA includes four steps which are detailed below.
Definition of the property space
First, the property space must be defined. Property space refers to of all the possible combinations presence or absence of the independent variables (antecedents). For example, in the present research, the property space is defined as every combination of the presence or
absence of information satisfaction, social exchange satisfaction and recreation satisfaction.
Calibration
Since QCA is defined by set membership, the next step is to define the degree of set membership for each case, or, in other words, to calibrate the data. Since membership in the sets information satisfaction, social exchange satisfaction, recreation satisfaction, age and education level are not binary, i.e. there is a spectrum on which cases may fall between “present” and “absent,” the fuzzy set calibration method was used (fsQCA). In this calibration method, each case is assigned a score between 0 and 1 that indicates the degree of membership in the set.
Any case with membership higher or lower than the 50th percentile has membership or non-membership in the set respectively, any case with membership equal to or higher than the 95th percentile has full membership in the set, and any case with membership lower than the 5th percentile has no membership in the set (Ragin, 2006). The set membership of other cases
is then calibrated based on these values. The calibration values for the present research are shown below.
Table 1
Calibration values
Information Social Recreation A. Loyalty B. Loyalty Age Edu Full membership 5 5 5 5 5 5 5 Crossover Point 4.667 1.4 4 4.9 4.4 3 4 No membership 2.667 0.5 2.25 1.667 2 2 2
After this, fsQCA software is used to assign membership scores for combinations of antecedents, with each one being present or absent, in the outcome set. In the present research, combinations of the antecedents information satisfaction, social exchange satisfaction, recreation satisfaction, gender, age and education level are assigned scores for membership in the sets “attitudinal loyalty” and “behavioral loyalty.”
Evaluating consistency
After this is done, each combination must be evaluated for consistency. Consistency is the score that measures the percentage of instances in which the combination of antecedents (also called “causal recipes”) leads to the desired result. Not all occurrences of a causal recipe are required to belong to the outcome set; rather, consistency scores should exceed a certain threshold, so that some inconsistent cases are allowed due to random error (Fiss, 2007). Ragin (2000), recommends using a cutoff point of at least 0.75, and that consistency be higher than coverage. In the present research, in order to account for the nature of the data, a cutoff point of 0.9 was used; any causal recipe that did not result in the desired outcome at least 90% of the time was deemed be insignificant.
Logical Reduction
The last step is for the researcher must remove redundant elements from results. For example, if it is found that information satisfaction and recreation satisfaction lead to attitudinal loyalty, but it is also found that information satisfaction and NOT recreation satisfaction lead to attitudinal loyalty, recreation satisfaction is redundant and has no effect on the presence or absence of attitudinal loyalty and is thus removed. This function is performed by the fsQCA software and results in two solutions. They are the parsimonious solution, in which the strictest criteria are applied to result in a solution, and the intermediate solution, in which
criteria are applied less strictly. It is the general consensus that the intermediate solution is the best way to understand the results.
4.5 Assumptions of QCA
According to Greckhamer et al. (2008), casual factors rarely act alone, and a given factor may have a completely different effect based on the combination in which it is placed. Thus, the basic, underlying assumption of QCA is that a given outcome depends on the combination of the antecedents that cause it, and not necessarily whether they are present in high or low levels. When using QCA, researchers cannot tell the relative importance of any one variable, but rather only the combination of those variables that leads to high or low levels of the dependent variable.
For example, if a researcher was researching the causes of firm profitability, and using, using the QCA approach might tell the researcher that when low employee absenteeism, high employee job satisfaction, and high overtime per employee are all present, high profitability will result. QCA can only show the researcher that this is one sufficient condition to lead to profitability, does not imply that this is the only combination of these variables that will result in the desired result, but merely that it is one of (possibly) several that do.
Furthermore, QCA is based on the assumption that human behavior is asymmetrical, i.e. if a combination of factors is found to produce an outcome, higher levels of any one of those factors cannot be assumed to produce a higher level of the outcome, and vice versa (Ragin, 1987). Thus, when using QCA, researchers cannot assume that more or less of an independent variable will result in more or less of the dependent variable.
4.6 Understanding fsQCA results
Necessary and sufficient conditions
fsQCA is software that is available free online and performs QCA analysis. It provides two types of results, necessary conditions and sufficient conditions. Necessary conditions are conditions that are necessary to result in the desired outcome, but may not be sufficient to result in the outcome alone. Sufficient conditions are the opposite; the presence of a sufficient condition will result in the outcome, but since it is not necessary, other combinations may also result in the same outcome.
Boolean Algebra
fsQCA uses Boolean algebra, specifically Boolean addition and Boolean multiplication. In Boolean algebra, a “+” denotes OR and a “*”denotes “and.” For example, the Boolean equation
Employee absenteeism + job satisfaction + overtime = profitability
Means that high employee absenteeism OR high job satisfaction among employees OR a high number of overtime hours taken by employees all result in high profitability for the firm, while conversely the equation
Employee absenteeism * job satisfaction * overtime = profitability
Indicates that high employee absenteeism AND job high job satisfaction AND a high number of overtime hours taken per employee taken together become a causal recipe for high profitability. Additionally, the symbol “~” indicates “not,” or low participation. Thus, the equation
~Employee absenteeism * job satisfaction * ~overtime = profitability
Means that NOT high levels of absenteeism AND high job satisfaction AND NOT high levels of overtime results in high profitability for the firm.
Consistency and coverage.
In addition to causal recipes, fsQCA software also provides values to quantify their consistency and coverage. Ragin (2006) explains them in the following way:
Consistency measures the degree to which solution terms and the solution as a whole are subsets of the outcome. Coverage measures how much of the outcome is covered (or explained) by each solution term and by the solution as a whole. These measures are computed by examining the original fuzzy data set in light of the solution (composed of one or more solution terms). The degree to which cases in the original dataset have membership in each solution term and in the outcome form the basis of consistency and coverage measures.
The full list of metrics that fsQCA provides is as follows
Consistency measures the degree to which membership in each solution term is a subset of the outcome.
Solution Consistency measures the degree to which membership in the solution (the set of solution terms) is a subset of membership in the outcome.
Solution coverage measures the proportion of memberships in the outcome that is explained by the complete solution.
Raw coverage measures the proportion of memberships in the outcome explained by each term of the solution.
Unique coverage measures the proportion of memberships in the outcome explained solely by each individual solution term (memberships that are not covered by other solution terms).
4.7 Advantages of fsQCA
fsQCA offers several advantages over the other dominant research methods, fixed point surveys and case study research by empirical positivists, and they are as follows.
Fixed point surveys
As applied to the marketing research, fixed point surveys operate on the assumption that the choices people make in what to purchase, etc., are made based on explicit thinking processes. However, in reality, this is not the case. Most thinking is done implicitly, and survey respondents have a difficult time converting implicit memories into explicit ones (Wegner, 2002). Thus, instead of choosing answers that reflect reality most closely, respondents tend to answer in the way that best nurtures his or her self-ego (Coopey, Keegan & Emler, 1997).
Additionally, survey respondents do not use “fixed-point scales” to evaluate abstract concepts such as trust, perceived quality etc. (Woodside and Wilson, 2000). Instead, they tend to think using methods that “usually include a few different combinations of causal conditions that lead to a given outcome event (e.g. purchase) or alternative outcome (e.g. non-purchase)” (Woodside, 2009).
Also, correlation analysis, multiple regression an structural equation modeling assume that independent and dependent variables have a symmetrical relationship; that is to say high
values of the independent variable lead to correspondingly high values of the dependent variable and low values of the independent variable in turn lead to low values of the dependent variable. However, in real life, relationships do not tend to be symmetrical, but rather a specific event results in sufficiency (but not necessity per se) of a casual outcome, making no prediction about the absence of the casual condition in question (Ragin, 2000).
By using calibrated variables as opposed to fixed-point scales, expressing results in “causal recipes” that are sufficient to produce a given result (but not necessary), and not assuming any symmetrical relationship between variables, fsQCA provides a reasonable alternative to fixed-point surveys.
Case study research by empirical positivists
Case study research also presents several problems. First, case study researchers generally do not take steps to create and test theory, opting instead to gather data first then build theory after data collection is finished. This, however, is an inherent flaw as, without prior theory that can be used to structure data collection, the researcher will certainly carry his or her own personal biases and judgments into the field, and it is inevitable that these biases will affect his or her research.
Second, “thick descriptions” used by researchers to increase the accuracy of findings inherently limit the research’s potential to be generalized. Thus, the value of case study research as the basis for further research is called into question. Furthermore, the variability in interpretations of data in thick descriptions is another weakness of case-study research. Despite the use of “member checks,” there is still the risk that the researchers will fail to achieve objectivity in interpretations of textual data, and this is crucial to formulating a thick description (Woodside, 2009).
Last, due to the specific nature of case studies, their relevance to other context and prescriptive implications is severely limited, in that case study research lacks deductive theory and data is collected in one or a very few context. Thus, its practical relevance is very questionable.
fsQCA requires researchers to create and test theory, and results have an appropriate degree of generality so as to be applied to other contexts. It also is not subject to the biases and assumptions of the researcher to the same degree as case study research, making it an effective alternative. Thus, it is for these reasons that fsQCA was chosen to analyze these data over other, more traditional methods such as statistical equation modeling (SEM).
V. Findings and implications
5.1 Descriptive StatisticsDemographic Information
In addition to questions regarding their satisfaction and loyalty, survey respondents also answered questions regarding their demographic makeup. Those results are presented here.
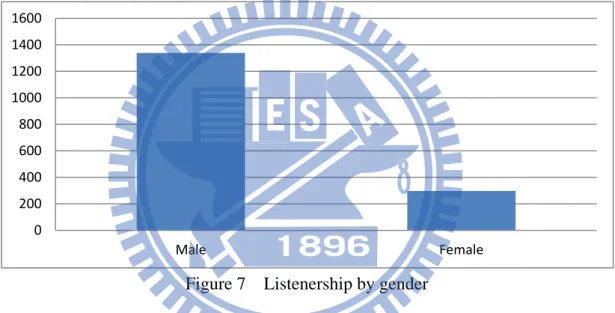
Survey respondents are overwhelmingly male, outnumbering females almost 4 to 1.
Figure 7 Listenership by gender
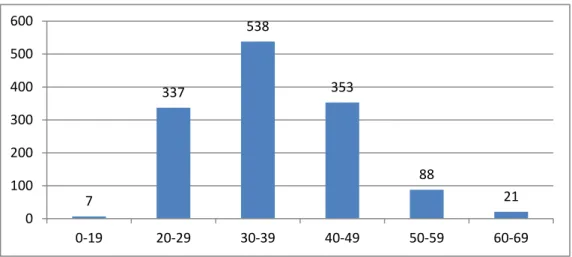
The overwhelming majority of the listenership is aged 20-49, with fewer than ten respondents indicating they were younger than 20, and none indicating they were over 70.
0 200 400 600 800 1000 1200 1400 1600 Male Female
Figure 8 Listenership by age
The education level of the listenership is surprisingly varied. Respondents’ educational backgrounds roughly resembl that of the population at large. Also, it is apparent from figure 7 that these results are not skewed by students or young people taking the survey, but accurately reflect the listenership.
Figure 9 Listenership by education level
7 337 538 353 88 21 0 100 200 300 400 500 600 0‐19 20‐29 30‐39 40‐49 50‐59 60‐69 0 100 200 300 400 500 600 Did not finish high school High school Community college or vocational school (2 year) Bachelor's degree Master's degree Doctoral Degree
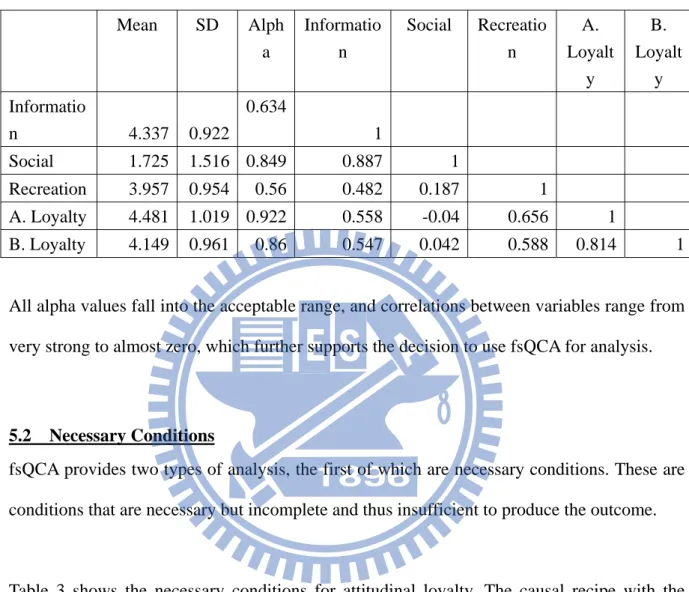
Other descriptive statistics
Table 2
Correlations between items before calibration (n=1360)
Mean SD Alph a Informatio n Social Recreatio n A. Loyalt y B. Loyalt y Informatio n 4.337 0.922 0.634 1 Social 1.725 1.516 0.849 0.887 1 Recreation 3.957 0.954 0.56 0.482 0.187 1 A. Loyalty 4.481 1.019 0.922 0.558 -0.04 0.656 1 B. Loyalty 4.149 0.961 0.86 0.547 0.042 0.588 0.814 1
All alpha values fall into the acceptable range, and correlations between variables range from very strong to almost zero, which further supports the decision to use fsQCA for analysis.
5.2 Necessary Conditions
fsQCA provides two types of analysis, the first of which are necessary conditions. These are conditions that are necessary but incomplete and thus insufficient to produce the outcome.
Table 3 shows the necessary conditions for attitudinal loyalty. The causal recipe with the highest consistency is information satisfaction + social exchange satisfaction +recreation satisfaction, which is consistent with what would be expected if the research propositions were true. However, the consistency for information satisfaction + recreation satisfaction is nearly the same, and if the hypothesis were true, we would not expect to see a single combination of two dimensions of satisfaction being more necessary than any other combination of two dimensions.
of 0.9 and thus cannot be a necessary condition for attitudinal loyalty alone. In order to result in attitudinal loyalty, there must be at least information satisfaction or recreation satisfaction present. In fact, adding social exchange satisfaction to the causal recipe only increases the consistency by less than 2%. Thus, social exchange satisfaction is not as important when cultivating attitudinal loyalty as the other two dimensions. This is in contrast to conventional wisdom which says that a heavy social media presence and listener involvement in content is crucial for attracting and keeping listeners.
Table 3
Necessary conditions for attitudinal loyalty
Conditions Tested Consistency Coverage
Information 0.774 0.9 Social 0.508 0.781 Recreation 0.717 0.886 Information + Social 0.843 0.812 Information + Recreation 0.899 0.865 Social + Recreation 0.781 0.803
Information + Social +Recreation 0.915 0.804
Table 4 shows the necessary conditions for behavioral loyalty. The only two causal recipes that meet the 0.9 cutoff point for consistency are again information satisfaction + recreation satisfaction and information satisfaction + social exchange satisfaction +recreation satisfaction. These recipes are the same as those for attitudinal loyalty, and further reinforce the importance of information satisfaction and recreation satisfaction.
The fact that the necessary conditions for attitudinal loyalty and behavioral loyalty are the same is in itself a significant finding. These data indicate that the antecedents are the same and that when one is present, the other one will be also.
Table 4
Necessary conditions for behavioral loyalty
Conditions Tested Consistency Coverage
Information 0.804 0.772 Social 0.571 0.725 Recreation 0.768 0.785 Information + Social 0.877 0.698 Information + Recreation 0.92 0.731 Social + Recreation 0.834 0.709
Information + Social +Recreation 0.937 0.681
5.3 Sufficient Conditions
Sufficient conditions are conditions that, when present, will always result in high levels of the dependent variable, but are not necessary and thus there may or may not be other causal recipes that lead to the same outcome. fsQCA provides two solutions when talking about sufficient conditions. The difference between the two has to do with the logical reduction stage of fsQCA, and they are: the parsimonious solution (which can be thought of as the more strict or conservative solution) and the intermediate solution (which uses somewhat less strict for logical reduction. It is generally accepted that the intermediate solution is best to understand the results (Ragin, 2000) and thus only the intermediate solutions are presented below.
Table 5 below shows the sufficient conditions for attitudinal loyalty. The data presented here indicate that information satisfaction and recreation satisfaction are not only necessary conditions, they are sufficient conditions as well.
Although the second causal recipe includes a second antecedent (~social exchange satisfaction), it is incongruous with previous findings that a listener would have to have low
levels of social exchange satisfaction in order to exhibit attitudinal loyalty. This leads to the significant conclusion that podcasting is different from other media (especially ostensibly similar forms of media such as blogs) in that social exchange satisfaction is not important for loyalty and even may be an active hindrance.
Table 5
Intermediate solution for causal configuration of attitudinal loyalty
Raw Coverage Unique Coverage Consistency Information 0.774 0.394 0.9 Recreation*~Social 0.455 0.075 0.919 solution coverage 0.849 solution consistency 0.887
Table 6 below shows the sufficient conditions for behavioral loyalty. The causal recipe shown includes all three dimensions of satisfaction, which indicates that although social exchange satisfaction is not a necessary condition, adding social exchange satisfaction has at least some, albeit effect on producing behavioral loyalty.
Although the necessary conditions for both attitudinal and behavioral loyalty were the same, the sufficient conditions are slightly different.
Table 6
Intermediate solution for causal configuration of behavioral loyalty
Raw Coverage Unique Coverage Consistency
Recreation*Social*Information 0.449 0.449 0.911
solution coverage 0.449
5.4 Results by gender, age and education
It has been shown that people use and consume media differently according to their gender and age (Dugan, 2013). Thus, the data were segmented and tested according to the gender and age of the listener.
Gender
Tables 7 and 8 shows the results of adding gender as an antecedent, in which “gender” refers to male listeners and “~gender” refers to female listeners. The necessary conditions differ from those of the entire listenership in one notable way. While with the entire listenership, there were only two causal recipes that meet the cutoff point of 0.9, when gender was added as an antecedent, there were six. It is expected that the final two (exchange outcomes satisfaction + gender and exchange outcome satisfaction + ~gender) would make the cutoff point, as all three dimensions together are already a necessary condition, and adding another antecedent can only make the consistency go up.
What is unexpected, however, is that information, social exchange, and recreation satisfaction paired with gender (male) become necessary conditions. However, upon further consideration, this makes sense. The vast majority of survey respondents are male, and the vast majority indicated they had high levels of both kinds of loyalty, thus it makes sense that being male and having at least one dimension of satisfaction leads to loyalty.
Table 7
Necessary conditions for attitudinal loyalty by gender
Condition Tested Consistency Coverage
Information 0.774 0.9 Social 0.57 0.773 Recreation 0.717 0.886 Gender 0.778 0.692 ~Gender 0.222 0.699 Information + Social 0.863 0.805 Information + Recreation 0.899 0.865 Social + Recreation 0.813 0.798 Information + gender 0.956 0.722 Information + ~gender 0.818 0.837 Social + gender 0.979 0.707 Social + ~gender 0.592 0.744 Recreation + gender 0.937 0.718 Recreation + ~gender 0.78 0.824
Information + Social + Recreation 0.924 0.799 Information + Social + Recreation + gender 0.993 0.708 Information + Social + Recreation +
Table 8
Necessary Conditions for behavioral loyalty by gender
Condition Tested Consistency Coverage
Information 0.804 0.772 Social 0.625 0.701 Recreation 0.768 0.785 Gender 0.774 0.569 ~Gender 0.226 0.588 Information + Social 0.898 0.692 Information + Recreation 0.92 0.731 Social + Recreation 0.862 0.7 Information + gender 0.96 0.599 Information + ~gender 0.844 0.714 Social + gender 0.988 0.59 Social + ~gender 0.637 0.662 Recreation + gender 0.947 0.6 Recreation + ~gender 0.821 0.717
Information + Social + Recreation 0.947 0.677 Information + Social + Recreation + gender 0.997 0.588 Information + Social + Recreation +
~gender 0.95 0.657
The sufficient conditions as shown in tables 9 and 10 for both kinds of loyalty also changed when gender was added as a possible antecedent. For behavioral loyalty, being either male or female and having recreation satisfaction is enough to produce loyalty, contrary to the solution for the entire listenership which indicated that all three dimensions must be present. Those for attitudinal loyalty also shifted, and while “gender” is not present in all cases, it is evident that information satisfaction and gender together are both necessary and sufficient to produce loyalty.
Furthermore, it is evident from the bottom to causal recipes that gender has a bigger positive effect on loyalty than does ~gender. While adding gender causes the consistency to go up by
5%, adding ~gender only causes the loyalty to go up by around 1%
Table 9
Intermediate solution for causal configuration of attitudinal loyalty by gender
Raw Coverage Unique Coverage Consistency Gender*Information 0.595 0.267 0.903 Recreation*~Social*~Information 0.222 0.057 0.927 Recreation*Social*Information 0.41 0.104 0.949 solution coverage 0.785 solution consistency 0.899 Table 10
Intermediate solution for causal configuration of behavioral loyalty by gender
Raw Coverage Unique Coverage Consistency
Gender*Recreation*Information 0.502 0.502 0.858
~Gender*Recreation*~Social*~Information 0.041 0.041 0.964
solution coverage 0.543
solution consistency 0.865
Age
The results for age, for the most part, are the same as those for the entire listenership. As can be seen in tables 11 and 12, adding age does not produce any new necessary conditions for attitudinal loyalty, and the only conditions necessary to produce loyalty remained information satisfaction + recreation satisfaction and all three together. For behavioral loyalty, adding age or ~age to information satisfaction causes the consistency to rise slightly above the level of information satisfaction alone. Otherwise, all causal combinations are the same. In general, adding age to a causal condition did not cause the consistency to increase more or less than adding ~age.
Table 11
Necessary conditions for attitudinal loyalty by age
Condition Tested Consistency Coverage
Information 0.774 0.9 Social 0.466 0.771 Recreation 0.717 0.886 Age 0.612 0.79 ~Age 0.545 0.817 Information + Social 0.84 0.814 Information + Recreation 0.899 0.865 Social + Recreation 0.778 0.805 Information + age 0.88 0.806 Information + ~age 0.87 0.833 Social + age 0.756 0.771 Social + ~age 0.691 0.784 Recreation + age 0.847 0.795 Recreation + ~age 0.791 0.823
Information + Social + Recreation 0.914 0.806 Information + Social + Recreation +
age 0.909
0.778 Information + Social + Recreation +
~age 0.933
0.791
Table 12
Necessary conditions for behavioral loyalty by age
Condition Tested Consistency Coverage
Information 0.804 0.772 Social 0.52 0.712 Recreation 0.768 0.785 Age 0.684 0.73 ~Age 0.607 0.752 Information + Social 0.874 0.7 Information + Recreation 0.92 0.731 Social + Recreation 0.831 0.71 Information + age 0.919 0.695 Information + ~age 0.901 0.713 Social + age 0.828 0.698 Social + ~age 0.757 0.711 Recreation + age 0.897 0.697 Recreation + ~age 0.843 0.725
Information + Social + Recreation 0.936 0.683 Information + Social + Recreation +
age 0.969 0.655
Information + Social + Recreation +
~age 0.955 0.67
Sufficient conditions, as seen in tables 13 and 14, were not affected a great deal by adding age. The intermediate solution for attitudinal loyalty is the same as that for the listenership as a whole, save one new causal recipe, recreation satisfaction*age. This is most likely due to the fact that most listeners indicated they were satisfied and loyal, and the majority is 30 or older. Since the cutoff point calibration value used was 3, this makes logical sense.
For behavioral loyalty, the most significant finding is that ~age* information satisfaction is a necessary and sufficient combination, meaning that for young people, information satisfaction is very important for producing loyalty.
Table 13
Intermediate solution for causal configuration of attitudinal loyalty by age
Raw Coverage Unique Coverage Consistency Information 0.774 0.289 0.9 ~Social*Recreation 0.461 0.029 0.916 Recreation*age 0.483 0.014 0.929 solution coverage 0.866 solution consistency 0.877 Table 14
Intermediate solution for causal configuration of behavioral loyalty by age
Raw Coverage Unique Coverage Consistency ~age*Information 0.51 0.031 0.873 Recreation*Information 0.652 0.094 0.855 Social*Information 0.45 0.029 0.861 solution coverage 0.729 solution consistency 0.823 Education level
Tables 15 and 16 show the necessary conditions when education is added as an antecedent. The impact of education level on necessary conditions is very insignificant. Adding education level as an antecedent did not produce any new causal recipes for attitudinal loyalty. For behavioral loyalty, the only new causal recipe that meets the cutoff point of consistency of 0.9 was information satisfaction +~education.
approximately the same amount, indicating that neither one has a greater effect than the other.
Table 15
Necessary conditions for attitudinal loyalty by education level
Condition Tested Consistency Coverage
Information 0.774 0.9 Social 0.464 0.771 Recreation 0.717 0.886 Education 0.508 0.795 ~Education 0.632 0.788 Information + Social 0.839 0.815 Information + Recreation 0.899 0.865 Social + Recreation 0.778 0.806 Information + Education 0.867 0.823 Information + ~Education 0.888 0.806 Social + Education 0.704 0.766 Social + ~Education 0.75 0.775 Recreation + Education 0.812 0.811 Recreation + ~Education 0.845 0.797
Information+ Social + Recreation 0.914 0.807 Information+ Social + Recreation
+ Education 0.94 0.779
Information+ Social + Recreation
+ ~Education 0.948 0.778
Table 16
Necessary conditions for behavioral loyalty by education level
Condition Tested Consistency Coverage
Information 0.803 0.772 Social 0.519 0.712 Recreation 0.768 0.784 Education 0.556 0.719 ~Education 0.692 0.713 Information + Social 0.873 0.7 Information + Recreation 0.92 0.731 Social + Recreation 0.83 0.711 Information + Education 0.893 0.701 Information + ~Education 0.921 0.691 Social + Education 0.762 0.686 Social + ~Education 0.813 0.694 Recreation + Education 0.854 0.705 Recreation + ~Education 0.895 0.697
Information+ Social + Recreation 0.936 0.683 Information+ Social + Recreation
+ Education 0.958 0.656
Information+ Social + Recreation
+ ~Education 0.969 0.657
Sufficient conditions, as seen in tables 17 and 18, are largely the same as those for other groupings. Education only appears once, in the causal recipe for attitudinal loyalty that is education*recreation satisfaction. Overall, education does not appear to have a large effect on either kind of loyalty.
Table 17
Intermediate solution for causal configuration of attitudinal loyalty by education level
Raw Coverage Unique Coverage Consistency Information 0.774 0.311 0.9 Recreation*~Social 0.461 0.032 0.916 Education*Recreation 0.413 0.013 0.923 solution coverage 0.864 solution consistency 0.879 Table 18
Intermediate solution for causal configuration of behavioral loyalty by education level
Raw Coverage Unique Coverage Consistency Information 0.803 0.803 0.772 solution coverage 0.803 solution consistency 0.772 5.5 Analysis by SEM
In order to better understand these data as well as to confirm the results obtained via fsQCA, analysis was also performed using statistical equation modeling (SEM), specifically the smart partial least squares method (smart PLS).
The results obtained via SEM show something vastly different than those obtained via fSQCA. While fsQCA showed that both information satisfaction and recreation satisfaction had a large impact on loyalty and were both necessary and sufficient to result in loyalty, SEM showed that only recreation satisfaction had a signification relationship with loyalty. This is
most likely due to the nature of each method; SEM endeavors to separate variables and reduce relationships between them while fsQCA assumes that there are always relationships between variables, and thus what is most important to researchers is not the net effect of each variable but rather the configuration.
Specifically, the figure below shows that the recreation satisfaction and attitudinal loyalty have a strong corollary relationship. Recreation satisfaction is also correlated to behavioral loyalty, while other dimensions of satisfaction and loyalty do not have any relationship.
Figure 10 Analysis by SEM
These results support the usage of fsQCA to analyze these data, as well as the usage of configural methods in management research in general. Without using fsQCA, a critical component of the configuration for both attitudinal loyalty and behavioral loyalty (information satisfaction) would have been missed.
VI. Summary and conclusions
6.1 SummaryOverall, of the research propositions:
A podcast listener’s exchange outcome satisfaction has a positive influence on attitudinal loyalty, more than any of the individual dimensions of satisfaction alone.
A podcast listener’s exchange outcome satisfaction has a positive influence on behavioral loyalty, more than any of the individual dimensions of satisfaction alone.
A podcast listener’s gender, age, or education level will not affect his or her loyalty, either attitudinal or behavioral.
none are supported. Exchange outcome satisfaction (a combination of information, social exchange, and recreation satisfaction) does not lead to attitudinal or behavioral loyalty with higher consistency than any of its components do alone in or in groups of two. Furthermore, while age and education level did not have a significant impact on loyalty levels, gender did, with males much more likely to be loyal than females.
Information satisfaction and recreation satisfaction were shown to be both necessary and sufficient for producing attitudinal and behavioral loyalty while social exchange satisfaction was shown to have a small but noticeable impact. In light of these findings, the exchange outcome model of satisfaction presented by Hsu et al. (2013) is not a good explanation of the relationship between satisfaction and loyalty in podcasting.
were the same or very similar. This is in contrast to the findings of Hsu et al., who found that exchange outcome satisfaction results in attitudinal but not behavioral loyalty.
When survey respondents were segmented by gender, being male was an antecedent that consistently appeared in both necessary and sufficient causal recipes, while being female did not. When respondents were segmented by age and education level, high or low levels of these antecedents did not appear to have a significant effect on loyalty and only caused consistency values to rise negligible amounts.
6.2 Discussion
The results of the present research have four meaningful implications for podcast content providers.
First has to do with the impact of social exchange satisfaction. Currently, podcasters spend huge amounts of time, energy and money (in the form of full time, dedicated staff) on their social media presence; in fact, for many podcasts, it is their primary form of advertising and promotion. The results, however, imply that this is perhaps not the most effective use of resources; listeners do not appear to care about interaction with other listeners, nor do they appear to care about how their feedback affects the content of the podcast to any meaningful degree. Thus, devoting some resources allocated to social media presence to other, more pressing issues may be prudent.
Second, the presence of either information satisfaction or recreation satisfaction is necessary
and sufficient to result in attitudinal loyalty 90% of the time, as well as for behavioral loyalty
with lower consistency. Podcast listeners may only listen for one reason, either to get information or be entertained, and thus podcasters looking to tailor content to listeners can