行政院國家科學委員會專題研究計畫 成果報告
應用智慧型演算法於地表地下最佳聯合營運模式之建立
研究成果報告(精簡版)
計 畫 類 別 : 個別型 計 畫 編 號 : NSC 97-2221-E-009-084- 執 行 期 間 : 97 年 08 月 01 日至 98 年 07 月 31 日 執 行 單 位 : 國立交通大學土木工程學系(所) 計 畫 主 持 人 : 張良正 報 告 附 件 : 出席國際會議研究心得報告及發表論文 處 理 方 式 : 本計畫可公開查詢中 華 民 國 98 年 10 月 28 日
行政院國家科學委員會補助專題研究計畫
■ 成 果 報 告
□期中進度報告
應用智慧型演算法於地表地下最佳聯合營運模式之建立
計畫類別:■ 個別型計畫 □ 整合型計畫
計畫編號:NSC 97-2221-E-009-084-
執行期間:2008 年 8 月 01 日至 2009 年 7 月 31 日
計畫主持人:張良正
共同主持人:
計畫參與人員:
成果報告類型(依經費核定清單規定繳交):■精簡報告 □完整報告
本成果報告包括以下應繳交之附件:
□赴國外出差或研習心得報告一份
□赴大陸地區出差或研習心得報告一份
■出席國際學術會議心得報告及發表之論文各一份
□國際合作研究計畫國外研究報告書一份
處理方式:除產學合作研究計畫、提升產業技術及人才培育研究計畫、
列管計畫及下列情形者外,得立即公開查詢
□涉及專利或其他智慧財產權,□一年□二年後可公開查詢
執行單位:國立交通大學土木工程學系
中 華 民 國 98 年 10 月 31 日
中文摘要 近年來由於全球氣候變遷造成旱澇等極端氣候發生的頻率升高,且水資源需求又日益 增加,若僅依靠地表水源將增加穩定供水的風險,而相較於地表水源,地下水的供水穩定, 若能將地下水與地表水進行聯合營運,則將可大為提高水源供應的穩定度。雖然,台灣部 分地區已過度抽用地下水,然而地表地下聯合營運的目的並非在增加地下水之使用量,它 的真正精神是利用地下水層龐大的儲存空間,進行地表水的調蓄操作,因此在適當的營運 下,不但可推持地下水的進出平衡,甚至可進一步達到補注涵養地下水的功能。 本研究目的在於建立一個可正確描述非穩態線性與非線性地下水系統之地表地下聯合 營運管理模式,傳統上常見地下水之實體結構物有兩大類,分別為「水井群」與「人工湖」, 實際應用上可能是獨自運用,或是混合運用於地表地下營運中。因此本研究首先將應用類 神經網路與遺傳演算法,分別針對不同型式之實體結構物建立聯合營運模式,最後再綜合 前兩年度之結果,結合模糊控制理論建置一個混合型式之聯合營運模式,藉此本研究所發 展的模式將可建議出包含水井與人工湖設施的最佳地表地下聯合營運規劃策略,在永續經 營的前提下,有效提升實際水資源營運效率,降低缺水風險。 Abstract
Due to the fast increasing of water demand and the raising hydrological variation caused by the global climate change, using only the surface water will increase the risk of water shortage in Taiwan. Comparing to the surface water, the groundwater resource is much more stable than the surface water. Therefore, the conjunctive-use of surface and sub-surface water can greatly reduce the water shortage risk. Although there are places that the groundwater was over pumped in Taiwan, the situation does not prohibit the implementation of conjunctive-use since the merit of the conjunctive-use is not to use more groundwater resource but to utilize the aquifer as a new storage system of the surface water to increase the capacity and efficiency of surface water allocation in time. The conjunctive operation is not only to preserve the balance of groundwater recharge and pumping. Beside, depending on the operation objective, the conjunctive operation can even recharge the aquifer to conserve the groundwater resource.
This study is to develop a optimal planning model for the conjunctive-use of surface and subsurface water. The proposed model is capable of considering both linear surface water systems and nonlinear groundwater systems simultaneously. Conventionally, wells system and artificial lake are two hydraulic structures generally used in the groundwater management, and both structures can be applied simultaneously or independently in the conjunctive-use system. Therefore, the research consists of three steps (years). The first and second years are to develop the conjunctive-use models that apply either the well system or the artificial lake for groundwater supply. The final year is to integrate the two years results and develop a general conjunctive-use model that considers both the well system and artificial lake. For the beginning two years, the Genetic Algorithm (GA), Artificial Neural Network (ANN) and Linear Programming (LP) are adopted to develop the planning model. This study further applies the fuzzy control theorem to allocate the water demand between the surface and sub-surface system in the third year. The proposed model can analyze different planning strategies for the conjunctive-use of surface and sub-surface water and obtain a strategy which can fulfill the requirement of sustainable management, increase the system operating efficiency and reduce the water shortage risk.
一、前言 水井形式之抽水方式為最傳統之地下水營運方式,亦有許多相關研究針對水井形式營 運建立地下水管理模式,例如:張良正等人(2002;2005;2007)結合遺傳演算法(GA)與限 制型動態規劃(CDDP)建立水井形式之地下水管理模式,藉由管理模式可以依據需水量曲 線,決定最佳之佈井方案與各井之最佳抽水量,該地下水管理模式可以在不對地下水層產 生衝擊下,求取最低總成本之最佳方案。然而,該管理模式之管理間距為季調配(三個月), 相較於地表水源調配常見之旬調配或日調配,時間間距差異太大,若強制縮短地下水管理 模式之時間間距,其計算量將急遽增加。因此本研究將以類神經網路取代傳統之地下水控 制方程式,藉此降低模擬計算量。研究流程如圖1 所示,其順序詳列如下: ? ? MODFLOW? ? ? ? ? ? ? ? ? ? ? ? ? ? ? ? ? ? ? ? ? ? ? ? ? ? ? ? ? ? ? ? ? ? ? ? ? ? ? ? ? ? ? ? ? ? ? ? ? ? ? ? ? ? ? ? ? ? ? ? ? ? ? ? ? ? ? ? ? ? ? ? 圖1 研究流程圖 (1) 應用 MODFLOW 模式產生一定數量之模擬案例:應用美國地質調查局(U.S.G.S.)開發之 地下水數值模式 MODFLOW,藉由不同之抽水組合對固定邊界條件及水文地質參數之 非拘限含水層抽水模擬,以產生一定數量之模擬案例。 (2) 建立類神經網路與驗證:以前述所產生之數據來訓練類神經網路,並在驗證其可準確預 測水位後,作為聯合營運之地下水反應方程式。 (3) 應用指標平衡概念與遺傳演算法串接「地表水」與「地下水」兩系統:應用已完成訓練 的類神經網路來作為地下水反應方程式,可反應非線性的非拘限含水層地下水位變化情 形。另外,在此定義地下水操作規線,並配合指標平衡概念與遺傳演算法,使得地表水 系統與地下水系統之蓄水指標彼此平衡。 二、應用倒傳遞類神經網路建立地下水模擬模式
本計畫應用倒傳遞類神經網路作為模組中非拘限含水層地下水方程式,分為兩大部 分,包含:「資料產生與處理」以及「訓練類神經網路」,其建立流程圖如圖 2 所示。資料 產生與處理是透過地下水數值模式產生兩組數據集合,分別做為訓練案例與驗證案例之 用,訓練類神經網路的部分是根據訓練案例資料以訓練類神經網路做為地下水反應方程 式。本計劃之類神經網路架構,如圖3 示,其中輸入為控制變數(t 時刻的抽水量)及狀態變數 (t 時刻的水位)之組合,輸出分別為下一個時刻之狀態變數(t+1 時刻的水位)。在類神經網路 受到良好的訓練之後,以驗證案例對網路進行連續預測驗證,連續預測之類神經網路架構 如圖 4 所示,僅在第一個時刻將初始狀態輸入,後續各時刻則以前一個時刻之狀態變數網 路模擬值代入,利用倒傳遞類神經網路可以成功地完成時序數列之連續預測。 2.1 地下水數值模式建置 本模組應用U.S.G.S.所開發的地下水數值模式 MODFLOW,模擬一個均質、等向的二 維非拘限含水層,模擬固定抽水井位下之水位變化。初步模式網格建置如圖 5 所示,模擬 範圍係 17000(m)×17000(m)大小的矩形,切割分成 170×170 個網格,每個網格大小為 100(m)×100(m)。其水文地質參數設定其中水力傳導係數為 0.001(m/sec),有效孔隙率為 0.2, 儲水係數為0.2,含水層的厚度為 110(m)。邊界設定為上下兩邊為無流量邊界條件,左右兩 邊的邊界條件為定水頭邊界條件,分別為 100(m)及 80(m),所以邊界條件供應的水流方向 為由左向右流。井群佈置如圖3.5 所示,編號#1 到#5 為觀測井,編號#A 到#E 為抽水井群, 每一井群包含100 個網格;每一井群之抽水量上下限則設定為 0 到 0.5 cms 之間,以隨機函 數決定抽水量後,再平均分配給100 個網格。 2.2 倒傳遞訓練類神經網路訓練
本研究運用MATLAB 之 Neural Network Toolbox 函式庫建立一個單一隱藏層之倒傳遞
類神經網路,其中輸入層共有10 個節點,分別為 5 個決策變數(5 個抽水井群於 t 時刻的抽 水量)及 5 個狀態變數(5 個觀測井於 t 時刻的水位),輸出層的 5 個節點則分別為下一個時刻 之狀態變數(5 個觀測井於 t+1 時刻的水位),隱藏層為 20 個節點。其中輸入層至隱藏層的 轉換函數為雙彎曲線函數 x x x x e e e e x f − − + − = ) ( ,隱藏層至輸出層則採用線性轉換函數。類神經網 路之訓練演算法採用BFGS 演算法,其網路架構如圖 3 所示,訓練之收斂條件設定為整體 誤差收斂値小於10−7。 2.3 地下水連續預測模擬驗證 當類神經網路建立完成後,接下來需要驗證類神經網路是否具備強健性與適用性,必 須以另一組案例透過連續預測的方式進行檢驗(其網路架構如圖 3.4 所示),本研究另外建立 不同型態之案例資料,在此分別以隨機函數及階梯函數建立兩種不同型態決策變數之驗證 案例,來進行連續預測之驗證,在此為第一階段之驗證,後續在地表地下聯合營運時,仍 需將地下水操作方式輸入MODFLOW 模式,比對類神經網路與 MODFLOW 模式兩者模擬 之水位變化。 綜合案例A 與案例 B 之驗證,若可同時通過兩者之驗證,即可證實本類神經網路可以 模擬不同抽水型態下之水位變化,因此可以用以作為地表地下聯合營運之地下水控制方程 式。
資料處理 MODFLOW 選定研究區域 資料正規化 MODFLOW求解 訓練類神經網路 各井抽水資 料 各井水位 資料 類神經網路 建立完成 資料整理 模式水文地質參數設 定 決定訓練案例抽水率 範圍 圖2 類神經訓練流程圖
圖3 類神經網路架構圖(訓練階段)
圖 5 地下水系統抽水井與觀測井配置圖 三、水井形式地表地下聯合營運模式發展 本研究以「指標平衡」概念作為串接地表地下系統間之調配原則,並結合遺傳演算法 與線性規劃方法建構地表地下聯合營運模式。 3.1 指標平衡 當地表水系統中水庫不只一座時,我們如何決定各水庫之供水順序呢?目前水庫與水 庫間放水策略常用之ㄧ的方法乃以「指標平衡」作為供水順序之原則,此方法最早為美國 陸軍兵工團工程師所提出,其基本精神為保持各蓄水單元蓄水量之平衡。運用指標平衡方 法可平衡水庫與水庫間入流量相對於庫容之豐枯狀態,以獲得水資源調配時之最大效益。 指標平衡方法對水庫操作規線之分層賦予整數之基本指標I ,系統中之任一水庫在 ti 時刻,若其放水後之蓄水量位在水庫之第i 分層,則其指標可表示如下:
(
i)
t i i i i t i t V V V V V V V I I ≥ > − − + = + + 1 1 , ...[1] 其中, t I :第t 時刻時指標值; I :第 i 層基本指標; i t V :第t 時刻放水後之蓄水量; V :第 i 層底對應之蓄水量; iVi+1:第i+1 層層底(即第 i 層頂)所對應之蓄水量; 由上述可知,「指標」為水庫在t 時刻存放於對應分層(規線)之蓄水體積相對該分層之 整體體積的比值,當不同水庫規模有所差異時,應用水庫庫容與其蓄水量之比值,可以更 客觀地評估蓄水狀態。指標平衡基本運算式則如下式[2]所示。 t n s t m s t mn
I
I
G
=
,−
, , m,n∈NF ...[2] 其中, t mn G :第t 時刻第 m 與第 n 水庫之指標差値; t m s I , :第t 時刻第 m 水庫放水後之指標,其計算如式[3.1.3.1]所示; t n s I , : 第 t 時刻第 n 水庫放水後之指標,其計算如式[3.1.3.1]所示; NF:參與指標平衡操作之水庫群集; 本研究中將引入此構想,將地下水含水層作分層設計,並且與地表水系統進行指標平 衡之操作,以保持地表水系統與地下水系統間蓄水指標之平衡為原則,建立地表地下聯合 營運模式。 3.2 水井形式地表地下聯合營運模式定義 本研究以指標平衡操作來維持各時刻地表水系統與地下水系統之蓄水平衡。各時刻目 標函數如下式所示:(
)
⎪⎭ ⎪ ⎬ ⎫ ⎪⎩ ⎪ ⎨ ⎧ + + ⎟⎟ ⎠ ⎞ ⎜⎜ ⎝ ⎛ + + =∑
∑ ∑
∈ ∈ ∈ t SL t SL SL N m t mn N n t sys G N i t i i SH P X t Y Z W G G W SHR W Z F F D t t, , minr r ...[3] n t=1~ 本研究之目標函數為求解最小化(Minimize)的決策問題,目標函數中的 t i SHR 項次是為 使該時刻系統缺水量最小; t sys G 項次則是為了地表水系統與地下水系統指標差値最小,以 維持地表水系統與地下水系統蓄水之平衡; t mn G 項次為地表水系統中各水庫之指標差値最 小,以維持地表水各水庫間供水之平衡; t SL Z 項次為地表水系統之空庫容積與庫容比最小, 以達成地表水蓄水減少量最小之目的; t SL Y 項次同上達成地下水蓄水減少量最小之目的,以 避免浪費水資源。 目標函數中之WSH,i >WG >WSL,為各目標欲滿足之先後順序,以缺水量最小為最優先 考量;指標平衡為次以維持供水平衡之供水原則;最後為空庫容積與庫容比,以使水盡量 留在蓄水節點內,避免因進行指標平衡時平衡於較低之指標,造成水資源不必要之浪費。 3.3 問題拆解與重定義 本問題之最佳化數學表示式已詳列如上所示,由於問題中包含了非線性方程式(地下水 流方程式),因此傳統水資源調配模式常見之線性規劃法,並不適用。若以遺傳演算法求解 本問題,則在計算效率上遠低於傳統之線性規劃法。因此本研究以混合式演算法(架構如圖6 所示)進行求解,可兼顧線性規劃法之高計算效率與遺傳演算法在非線性規劃上之便利。 因此目標函數式[3]所定義之原問題,可分解為下列之主次問題,詳列如下: 主問題:
( )
{
t}
SL SL t sys G t P tY
W
G
W
P
J
Z
t+
+
=
min
r *v
...[4] 次問題:( )
(
)
⎪⎭ ⎪ ⎬ ⎫ ⎪⎩ ⎪ ⎨ ⎧ + ⎟⎟ ⎠ ⎞ ⎜⎜ ⎝ ⎛ + ⎟⎟ ⎠ ⎞ ⎜⎜ ⎝ ⎛ =∑
∑ ∑
∈ ∈ ∈ t SL SL N m t mn N n G N i t i i SH X t Z W G W SHR W P J F F D t , * min r v ...[5] 在[4]式所定義的主問題中,決策變數為地下水系統各抽水井群於該時刻之抽水量做為 染色體,以遺傳演算法進行求解,搭配類神經網路,主要求解非線性部分;在次問題中, 以主問題給定一組地下水抽水量決策變數條件下,其決策變數為各水庫於本時刻之放水 量,目標函數與各限制式均屬於線性方程式,因此可選用線性規劃法求解。 圖6 地表地下聯合營運模式架構圖 四、聯合營運案例展示 本章將設計不同案例來顯示,本地表地下聯合營運相較於單純地表水獨立營運或是傳 統地表先供地下補不足之聯合營運,可大幅降低缺水情形。此外,本章亦比較兩種不同地 下水資源供應條件之操作情形,由於本研究透過分層設計可有彈性地提供地下水資源供水 策略,相較於傳統聯合營運方式,在較少量之地下水供應時,更能顯示本模式有效率調配 之重要性。 4.1 模擬案例介紹本研究以不同營運方式分別建立三個營運案例。以下將詳細說明: (1) 地表水獨立營運 地表水獨立營運係以地表水庫儲存豐水期之河川水量,並在枯水期時使用這些水量, 因此缺水與否與降雨不確定性有極大之關係,在本章所有案例之地表水庫入流量歷線圖5.4 所示。本形式之營運系統如圖7 所示,在此為兩個不同容量之並聯水庫,圖 8 為兩個並聯 水庫的水庫入流量。 (2) 地表地下非偶合聯合營運 地表地下非偶和聯合營運即傳統之地表水先供應需求,當地表水系統已無法滿足需求 時,再由地下水系統供給。演算上,由於已經訂出供水順序,因此可以先由地表水獨立營 運模式計算後,再將缺水量帶入地下水營運模式,因此稱為非偶和形式之聯合營運。本形 式之營運系統如圖9 所示,除了兩個不同容量之並聯水庫,還額外加入一地下水系統(其系 統如圖5 所示)。 在本聯合營運模式中,各時刻之地表水供應量必與前述之獨立營運模式之結果一致, 而在缺水情形方面,則因為地下水系統之加入,可以降低缺水情形,而降低幅度則視地下 水系統之最大抽水量而定。 (3) 地表地下偶合聯合營運 即為本研究所發展之聯合營運模式,在演算上本模式為同時考量地表水與地下水兩系 統之儲水量,而同時決定最佳之調配方式,因此可稱為偶和形式之聯合營運。本形式之營 運系統如圖9 所示,除了兩個不同容量之並聯水庫,還額外加入一地下水系統(其系統如圖 5 所示),圖 10 為本案例之地下水系統操作規線。 圖7 地表水獨立營運系統圖
0 2,000,000 4,000,000 6,000,000 8,000,000 10,000,000 12,000,000 14,000,000 16,000,000 18,000,000 20,000,000 1 61 121 181 241 301
Time step No.
Inflow(m 3 /10 days ) Reservoir A Reservoir B 圖8 水庫入流量分佈圖 圖9 地表地下聯合營運系統圖
90.37 (m) 90.00 (m) 87.50 (m) 85.00 (m) 70.00 (m) 5.0 4.0 3.0 2.0 1.0
Average groundwater level Index
圖10 地下水系統操作規線圖 4.2 模擬案例成果展示 (1) 地表水獨立營運案例 本案例模擬結果如下所示,旬缺水指數為 2.93,年缺水指數為 1.20,缺水旬數為 135 旬,A、B 兩水庫合計旬平均供水量為 1355.24 萬噸,為缺水情形嚴重之案例。 (2) 地表地下非偶合聯合營運案例 本案例模擬結果如下所示,旬缺水指數為 1.54,年缺水指數為 0.55,缺水旬數為 125 旬,地表水系統旬平均供水量為 1355.24 萬立方公尺,地下水系統在發生缺旱時啟動,旬 平均供水量為47.93 萬立方公尺,相較地表水獨立營運案例(案例#1)雖然降低了缺水指數, 但由於地下水系統供水受到井管大小與馬達馬力之限制,因此有其瞬時最大供水極限,當 缺旱時之需求量往往遠高於該其供應能力,因此缺水發生的情形仍十分頻繁,且缺水情形 之改善有限。 (3) 地表地下偶合聯合營運案例 本案例模擬結果如下所示,旬缺水指數為 1.13,年缺水指數為 0.39,缺水旬數為 111 旬,地表水系統旬平均供水量為1347.56 萬立方公尺,地下水系統旬平均供水量為 67.93 萬 立方公尺。以此分層設計下,雖然地下水系統仍有相同之最大可供水限制,地下水系統提 供之平均供水量較案例#2 多,使得缺水指數(SI)與旬數亦有更佳之表現。系統指標平衡操 作如圖11 所示,地下水指標反應較地表水指標和緩,這是因為地表水系統與地下水系統之 反應敏感與否有關。從圖面看來,當地表水指標由下往上貫穿地下水指標時,地下水指標 亦同時止跌回升,這顯示當地表水指標較低時,當時系統抽用地下水,而地表水指標較高 時,則系統以地表水滿足需求;反之,亦有同樣特性。
1 2 3 4 5 0 50 100 150 200 250 300 350 400
Time step No.
In de x va lu e SW GW 圖11 案例#3 地下水系統與地表水系統指標變化圖 五、結論與建議 5.1 結論 (1) 本研究所發展逐時刻優選之地表地下聯合營運模式乃以遺傳演算法串連地表水與地下 水兩系統,地下水系統採用類神經網路,地表水系統採用線性規劃求解,如此本模式可 兼具線性規劃之高計算效率與遺傳演算法可以涵蓋線性與非線性之彈性。 (2) 本模式以類神經網路來做為非線性之非侷限地下水系統水位變化之模擬,大幅降低了地 下水模式與最佳化模式結合時之計算量,可使地下水系統之考量不再只能考量小範圍之 區域或線性之拘限含水層。 (3) 本模式乃將水庫操作規線之概念運用至地下水含水層上,透過不同的地下水含水層分層 能彈性地提供不同的地下水供水策略,並運用指標平衡之方法求解地下水最佳抽水量與 各水庫之最佳放水量,故本模式具有「規線操作」之實用性。 (4) 本研究發現在經由良好的訓練下(整體誤差值到達 10-7),類神經網路能在已知各時刻抽 水量情況下,可成功地連續預測之地下水位。 (5) 透過地下水最大可供給量與系統需求比分別為 8.64%、14.40%之地表地下聯合營運案例 發現缺水指數在8.64%案例中下降的幅度較 14.40%大,由此顯示,當系統可利用資源少 時,營運效率好壞將會大幅影響系統表現;反之,當系統可利用資源多時,營運效率對 系統表現影響較小。因此在擁有較少之地下水資源時,透過本模式可更有效率管理、調 度水資源。 5.2 建議
想案例,未來可朝向學習以現地水文資料檢定後之實際MODFLOW 案例,以便未來實 際運用在真實案例之水資源規劃中。 (2) 本研究中類神經網路僅學習旬操作之案例,未來可學習不同時距之案例,並且分析類神 經網路在不同時距下的精確度。 (3) 本研究所發展之模式是將地表水庫溢流量先提供給需求節點,但在豐水期時仍有可能有 大於河川之生態基流量之放水,若能在本模式中多考量將多餘的水資源以人工補注之方 式注入到地下水含水層中,在水資源調配上將可獲得更大效益。 (4) 本研究中僅以運用分層(規線)概念決定系統之供水順序,但未討論如何決定需求打折 數,本研究各案例亦為全額供給,未來可對此進行探討,以更接近實際之操作。 (5) 本研究中僅對地下水系統做兩種分層設計,未來可進一步進行最佳操作規線之探討。 (6) 本模式未來可對實際案例進行地表地下聯合營運之規劃且分析其成果。 六、參考文獻
(1) Emery Coppola Jr. , Frenc Szidaroszky, Mary Poulton, and Emmanuel Charles,“ Artificial Neural Network Approach for Predicting Transient Water Levels in a Multilayered Groundwater System under Variable State , Pumping and Climate Conditions”, J. of Hydrologic Engineering Vol.8, No.6, pp.348-360,2003.
(2) Gorelick, S. M., “A Review of Distributed Parameter Groundwater Management Modeling Methods”, Water Resources, Vol. 19, No. 2, pp. 305-319, 1983.
(3) Gavin J. Bowden, Graeme C. Dandy and Holger R. Maier , ““Data Transformation for Neural Network Models in Water Resources Application”, J. of Hydroinformatics, Vol. 125, No. 3, pp.143-153, 2003.
(4) David W.Watkins Jr & Daene C.McKinney ,” Decomposition Methods for Water Resources Optimization Models with Fixed Costs”, Water Resources, Vol. 28, No. 6 pp.283-295, 1998. (5) Hakan,Basagaoglu., and Miguel A.Marino., “Joint Management of Surface and Ground
Water Supplies”GROUND WATER, Vol.37,No.2, pp.214-222,1999.
(6) 謝明富,「應用倒傳遞神經網路模擬非線性遲滯動力行為」,國立交通大學土木工程研 究所碩士論文,1999。 (7) 陳宇文,「類神經網路於入滲池最佳設計之應用」,國立交通大學土木工程研究所碩士 論文,2000。 (8) 李志鵬,「新型態多水庫聯合營運最佳規線之探討」,國立交通大學土木工程研究所碩 士論文,2004。 (9) 胡明晢,「水庫標的線性規劃模式的解法」,國立台灣大學農業工程學研究所碩士論 文,2000。 (10) 許少瑜,「水庫操作規線問題的模式與解法」,國立台灣大學農業工程學研究所碩士論 文,2001。 (11) 徐年盛「區域性地表水與地下水最佳聯合營運模式之研究」,國科會專題研究報 告,(1995)。
計畫編號 NSC 96-2221-E-009-084-
計畫名稱 應用智慧型演算法於地表地下最佳聯合營運模式之建立
出國人員姓名服
務機關及職稱 張良正,交通大學土木系教授
會議時間地點 2008/12/15~12/19, Sanfrancisco, USA
會議名稱 2008 AGU Fall Meeting
發表論文題目 Experimental Study on Displacement Mechanisms of Two-Phase Fluid
Using Micro model
一、參加會議經過
美國地球物理學會 (American Geophysics Union, AGU)每年皆於舊金山 舉辦地球物理秋季研討會,與會人數歷年皆超過萬人參加,為一全球規模之研 討會。本人於12/15飛抵舊金山國際機場後,即前往會場報到,並開始前往海報 會場觀看其他學者之海報,於本人有興趣之海報之前與該學者進行討論,之後 除了本人發表海報當日(星期四)外,其餘幾天皆於海報會場閱覽海報並與學者 討論,觀察目前世界各地學界與業界之主要研究潮流。另外在發表海報那天, 本人在會議上提出之論文名稱為「Experimental Study on Displacement
Mechanisms of Two-Phase Fluid Using Micro model」,大約十名學者對本人的研 究深感興趣,並與本人討論,切磋,其中更有一名普渡大學之博士候選人希望 本人能將研究資料供其參考,並給他聯絡方法,但基於目前此篇研究正於深入 研究中,本人只能待此篇研討會論文相關之期刊論文發表後再行考慮是否將資 料供他參考。 二、與會心得 本人所參加之研討會為一國際頂尖大型研討會,與會人數超過一萬五千 人,而在海報會場每天約有2200篇的海報展出,與會學者每人皆與海報作者熱 烈討論;在與海報作者討論時,海報作者會先為你說明海報內容,接著再對你 的問題細部講解與討論。因為如此,對於一篇不熟悉的海報論文亦能在短時間 抓到此篇海報研究的重點與精神,也因此對於自己的研究方向更能有不同的觸
發。 相較於口頭報告,雖然上台報告時,參與報告之學者能與你討論,但時 間畢竟有限,只有短短十分鐘不到的討論時間,而海報報告是全天的討論(上 午八點到下此五點),因此需要多次的報告與說明本人發表之海報論文,而對 於本人海報論文感興趣之學者們皆能提出不同的觀點與具體之建議,對於本人 之研究有相當助益。另外,本研討會之主題涵蓋地球物理相關領域,其海報數 量高達一萬兩千篇以上,大部分的學者皆會前來張貼並說明海報內容,其海報 內容皆有一定的完成度與相當之水平,因此參與此研討會除了有助於本身地下 水領域相關之研究外,尚可觀察目前世界各地的地球科學相關領域的研究脈 動,也易於從其他領域之研究獲得不同的啟發,並轉為自身研究之動力。 三、建議 1. 本次研討會我國政府公家單位參加甚少,應多加鼓勵其參與此類活動。 2. 相關研討會資訊應能容易取得,互相整合,最好有一機構彙整,定期公佈, 以利擴大參與。 3. 能參加國際會議並與與會學者先進交流及互動,相信對一個(碩)博士生是非 常有幫助的,希望教育部及各學校單位對於出國參加研討會之補助經費能提 供更充分的支援,以鼓勵學生多參與國際之學術活動。 四、攜回資料名稱與內容
1. American Geophysical union 2008 Fall Meeting 會議議程一本:為此次AGU 2008
Fall Meeting年會之議場之所有資訊包含議程、場次及場地之相關資訊
2. 本會議所有文章之摘要皆可由AGU 2008 Fall Meeting之官網下載ISO檔燒錄成
光碟,網址如下:
http://www.agu.org/meetings/fm08/index.php/Program/index.php/Program/CD
Experimental Study on Displacement Mechanisms of Two-Phase
Fluid Using Micro model
Liang -Cheng Chang 1 Jui -Pin. Tsai2 Hsin-Yu Shan3 Hung-Hung Chen4
1
Professor ofDepartment of the Civil Engineering of the National Chiao Tung University, E-mail address: [email protected]
2
Ph. D. candidate of the Civil Engineering of the Department of National Chiao Tung University, Corresponding author, E-mail address: [email protected]
3
Associate Professor of Department of the Civil Engineering of the Department of National Chiao Tung University, E-mail address:[email protected]
4
Key Words:Displacement Mechanisms、Micro model、porous media Abstract
The displacement mechanisms of water-air in the porous media are the important fundamental concepts for unsaturated flow in subsurface. Lenormand and Zarcone (1983, 1984b) have proposed displacement formula of two phases fluid displacements in porous media and been widely applied to different situations. This study applies transparent micro model and digital image analysis to perform the experiments and examine the displacement formulas.
The experiments were performed following the Lenamands assumptions as closely as possible. Various displacement mechanisms were observed and their images were recorded. The displacement mechanism is mainly piston type during the drainage process, while that are snap off and In type in the imbibition. Preference paths of non-wetting phase fluid were clearly observed during the drainage. The experimental fluid displacement images and associated capillary pressure were then used to verify the conventional displacement formulas (the Lenormand and Zarcone, 1983, 1984b). The experimental study shown that the experimental results were closed to the critical capillary pressures predicted by the formulas except for the snap off mechanism in imbibition. The critical capillary pressure for snap off to occur in a throat tends to larger than that predicted by the formulas. The phenomenon became significant when pores or throats that filled with wetting fluid surrounded a throat. For the throats, our study suggests that to increase the prediction accuracy of the Lenormand and Zarcones formulas, the critical capillary pressure for snap off to occur should consider more about the wetting conditions of the neighboring pores and throats. To summarize, this study provided experimental supports and suggestions for the Lenormands displacement formulas and were valuable references for studying displacement mechanism in porous media.
Introduction
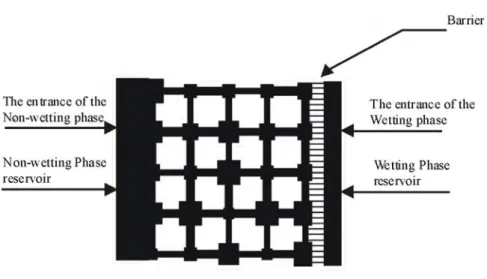
Displacement mechanisms for two immiscible fluids in porous media are very important for groundwater hydrology and remediation as well as reservoir engineering. Lenormand et al. (1983, 1984b) used displacement mechanisms to describe the relationship between capillary pressure and the interface curvature of two immiscible fluids. They proposed displacement formulas including ‘In’ type imbibitions that have been widely adapted to other analytical and simulation studies. Their displacement formula derivation assumes that the pore shape is square and the pore size is the same as its connecting throats. They also performed experiments to verify the formulas using a micro model with a pore-throat connected structure that had seven different throat sizes. The shape of pores in their micro model is irregular, and not fully consistent with the assumption of the displacement formula derivation. Therefore, this study performs 2-D pore-throat micro model experiments with square pores to investigate the applicability of the displacement formulas.
1. The head control sub-system includes connecting tubes and glass containers (reservoirs) which elevations can be freely adjusted to control the heads.
2. The two sides of the micro model are connected to inflow and outflow
reservoirs respectively.
3. Images of the fluids distribution in the micro model were recorded by the CCD camera (640*480 pixels, RGB format) during the experiment.
4. The fluids are static at the end of each stage of the experiment and the degree of saturation for each phase varied according to the capillary pressure.
Fig.1 Schematic diagram of the experimental setup for P-S curves
Micro model
Micro model is the most important component of the experimental system.
1. Figure 2 shows the schematic diagram of micro model for P-S experiments. The micro model is consisted of 25 pores and 40 throats.
a. Barriers were required to confine the non-wetting fluid in the micro model during experiment.
Fig.2 Schematic diagram of micro model for displacement mechanisms Experimental fluids
Air and water were chosen to represent the non-wetting phase and wetting phase, respectively.
a. Water was dyed blue and the air was white naturally without dyeing.
b. Since the concentration of the dye in the liquid was less than 0.05%, the dye had a minimal impact on the results of Pc-S experiments.
c. Table 1 lists the properties of the liquids.
Table 1 Physical property of the related fluids
Results and Discussion Results
Examining the recorded images clearly shows the details of the fluid displacement, and its associated experimental capillary pressure was then compared with the estimated critical capillary pressure to verify the accuracy of Lenormand’s formulas.
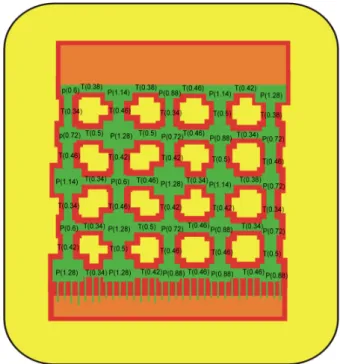
Fig. 3 shows the dimensions of the pores and throats in the transparent micro
Experimental fluids Chemical
formula Density (g/cm3) (24°C) Surface tension (Dynes/cm) Water H2O 0.997 71.5
model. “T” indicates a throat, “P” indicates a pore, and the Arabic numerals give their associated dimensions.
Table 2 summarizes the critical capillary pressure as estimated by Lenormand’s and Hughes’s formulas, assuming the wettability is perfect (θ = 0°) and the half-corner angle α equals 45 (the corner angle of the rectangular cross-section of pores and ° throats was 90 ). °
Table 2. The estimated critical capillary pressure of various fluid displacement for the micro model’s pores and throats in imbibition
width(cm) Snap-off1 (Hughes) (cmH2O) Snap-off2 (Lenorman d) (cmH2O) I1 imbibition (Lenormand) (cmH2O) I2 imbibition (Lenormand) (cmH2O) 0.034 3.06 4.30 * * 0.038 2.84 3.85 * * 0.042 2.65 3.48 * * 0.046 2.50 3.18 * * Throat 0.050 2.38 2.92 * * Pore 0.060 * * 3.53 2.19
Figure 3 The widths of pores and throats in the transparent micro model.
0.072 * * 3.24 2.13
0.088 * * 2.98 2.08
0.114 * * 2.72 2.02
0.128 * * 2.62 2.00
‘*’ indicates that the displacement mechanisms will not occur. Drainage Process
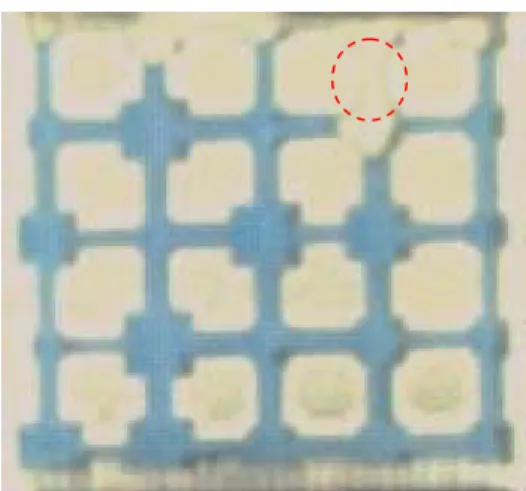
Since the fluid displacement in the drainage process was simple, this section focuses on sixth stage in drainage process.
Figure 4 shows the selected images in the sixth stage of the drainage process a. Pce equals 4.3 cmH2O.
b. The circled areas in the image demonstrate the piston-type motion at
selected throat.
c. The widths of the selected throat is 0.5mm, the computed Ppiston is
4.51cmH2O and the Pce is 4.3cmH2O. d. The Ppiston is 0.21 cmH2O greater than Pce.
Imbibition process
Imbibition Process
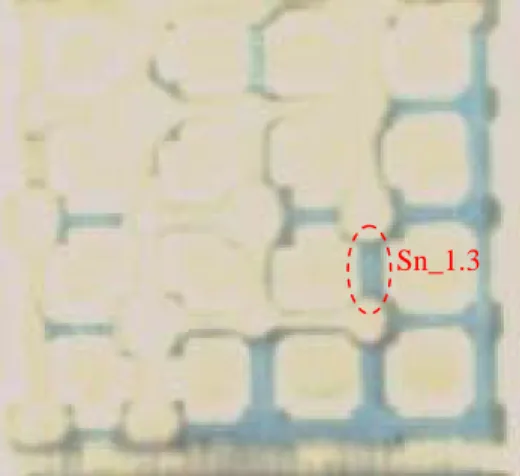
Twelfth stage: Figure 5a~ Figure 5d shows the selected images in the twelfth stage of the imbibition process
Figure 4. The end of the sixth stage of drainage process.
a. Pce equals 3.4cmH2O.
b. The circled areas in the images demonstrate the detailed snap-off process at selected throats labeled with ‘Sn_i.j’, where i is the throat label and j is the selected snap-off evolution step.
c. Figure 5a is the starting image of the snap-off process, and the widths of the selected throats ‘Sn_1.0’ and ‘Sn_2.0’ are 0.42mm and 0.46mm, respectively.
d. Their computed Psnap-off1 are 2.53cmH2O and 2.39cmH2O, and Psnap-off2 are 3.48cmH2O and 3.18cmH2O.
e. The Psnap-off1 for ‘Sn_1.j’ and ‘Sn_2.j’ are 0.87 cmH2O and 0.97 cmH2O lower than Pce respectively. The Psnap-off2 is 0.08 cmH2O greater than Pce for ‘Sn_1.j’ and 0.22 cmH2O lower than Pce for ‘Sn_2.j’.
Figure 5b. The twelfth stage of imbibition process.
Figure 5a. The beginning of twelfth stage of imbibition process.
Figure 5c. The twelfth stage of imbibition process.
Figure 5d. The end of twelfth stage of imbibition process. Sn_1.0 Sn_2.0 Sn_1.1 Sn_2.1 Sn_1.2 Snap-off Sn_2.2 Snap-off Sn_1.3
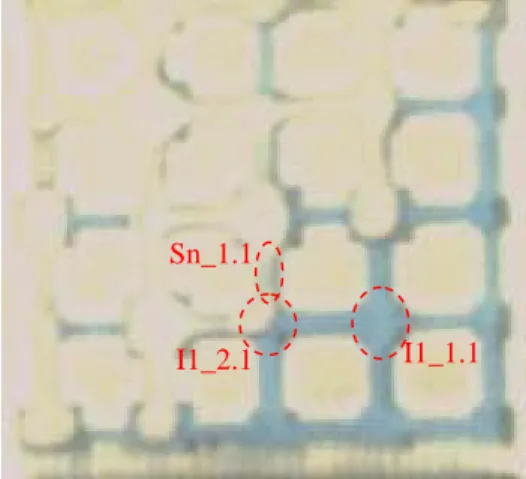
Fourteenth stage: Figure 6a~ Figure 6c shows the selected images in the fourteenth stage
a. Pce equals to 2.8cmH2O.
b. Figure 6a is the starting image of the In imbibtion and snap-off for the
selected pores and throat.
c. The sizes of ‘I1_1.0’, ‘I1_2.0’ and ‘Sn_1.0’ are 0.88mm, 0.72mm and
0.42mm, respectively.
d. The computed PI1 for ‘I1_1.j’ and ‘I1_2.j’ are 2.97 cmH2O and 3.28 cmH2O, respectively. For the ‘Sn_1.j’, Psnap-off1 is 2.65cmH2O, while Psnap-off2 is 3.48cmH2O.
e. Psnap-off1 is 0.15 cmH2O lower than Pce, while Psnap-off2 is 0.68 cmH2O greater than Pce.
Figure 6a. The fourteenth stage of imbibition process.
Figure 6b. The fourteenth stage of imbibition process.
Figure 6c. The end of fourteenth stage of imbibition process.
I1_2.2 Sn_1.2 I1_1.1 I1_2.1 Sn_1.1 I1_1.0 Sn_1.0 I1_2.0
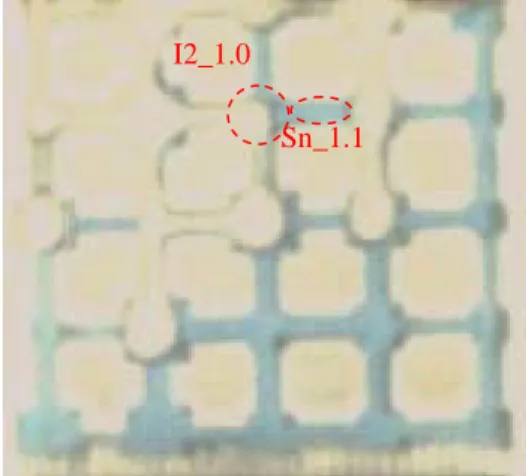
Sixteenth stage: Figure 7a to 7b shows selected images of the sixteenth stage
a. The experimental Pce was 2.2cmH2O.
b. The size of ‘I2_1.0’ is 0.72mm, and its estimated critical capillary pressure for producing the I2 type imbibition (PI2 ) is 2.13 cmH2O.
Discussion
1. In type imbibition is the major displacement mechanism for wetting porous media, while snap-off can affect the occurrence of In type imbibitions. The experimental Pc-Sw curve (Fig. 8) shows the significant change for the saturation of wetting phase fluid (Sw ) when the In type imbibition occurrs at Pce = 2.8, 2.2 and 2.0 cmH2O. 2. Therefore, snap-off is an important displacement mechanism in facilitating the
increase of the wetting phase fluid saturation in the imbibition process. Figure 9 summarizes the occurrence of displacement mechanisms and demonstrates that snap-off occurs before In type imbibitions.
Figure 7b. The sixteenth stage of imbibition process.
Figure 7c. The sixteenth stage of imbibition process.
I2_1.0
Sn_1.1
I2_1.1
0.2 0.4 0.6 0.8 1
S
w 0 2 4 6P
ce Drainage Imbibition Pce-Sw CurveFigure 8. Capillary pressure-Saturation curve in the pore-throat network of the transparent micro modelmicro model.
6 5 4 3 2 1 Pce 0 1 2 3 4 5 Frequency Snap off I1 imbibition I2 imbibition
Occurring frequencies of the snap-off and In imbibition
Conclusion
This experimental study demonstrates that a transparent micro model can be a valuable tool to investigate the multi-phase flow displacement at pore scale. The results of this experimental study show several important points.
1. Experimental images show that snap-off of a throat may occur without direct connection to other continuous wetted areas, and this implies the existence of corner flow.
2. Analysis of the saturation variation during the imbibition process shows that In type imbibition is the major displacement mechanism for wetting porous media in the imbibition process. However, before the In type imbibition of a pore can occur, there must be enough connecting throats were saturated
3. For the pore-throat distribution applied in this study, the snap-off can facilitate the occurrence of In type imbibition and its associated piston-type motion. Therefore, snap-off is also an important displacement mechanism in facilitating the increase of the wetting phase fluid saturation in the imbibition process.
Nomenclature θ contact angle α half-corner angle P pressure, cmH2O S saturation, fraction Pc capillary pressure, cmH2O
Pce experimentalcapillary pressure, cmH2O
P piston the critical capillary pressure of piston-type motion calculated by Lenormand’s formula.
Psnap-off1 the critical capillary pressure of snap-off calculated by Hughes’s formula. Psnap-off2 the critical capillary pressure of snap-off calculated by Lenormand’s formula. PIn the critical capillary pressure of In imbibtion calculated by Lenormand’s formula. Sw the saturation of wetting phase fluid, fraction
Sn_i.j Sn indicated ‘Snap-off’, i is the throat label and j is selected evolution step of snap-off.
In_i.j In indicated ‘In imbibition’, i is the throat label and j is selected evolution step of In imbibition.
REFERENCES
Blunt M, King MJ and Scher H (1992) Simulation and theory of two-phase flow in porous media. Phy. Rev. A 46(12): 7680–7699.
Hughes RG. and Blunt MJ (2000) Pore scale modeling of rate effects in imbibition. Transport Porous Med. 40: 295–322.
Hughes RG. and Blunt MJ (2001) Network Modeling of Multiphase Flow in Fractures. Advances in Water Resources 24: 408-421.
Ioannidis MA, Chatzis I, and Payatakes AC (1991) A mercury porosimeter for investigating capillary phenomena and microdisplacement mechanisms in capillary networks. J. Colloid Interface Sci. 143(1).
Lenormand R, Zarcone C and Sarr (1983) A Mechanisms of the displacement of one fluid by another in a network of capillary ducts. J. Fluid Mech. 135: 337–353.
Lenormand R and Zarcone C (1984b) Role of roughness and edges during imbibition in square capillaries, Paper SPE 13264, Proc. Paper presented at the 59th SPE Annual Technical Conference and Exhibition, Houston, TX, Sept., 16-19, 1984.
Li Y and Wardlaw NC (1986a) The influence of wettability and critical pore-throat size ration on snap-off. J. Colloid Interf. Sci. 109(2): 461–472.
Mahmud WM and Nguyen VH (2006) Effects of Snap-Off in Imbibition in Porous Media with Different Spatial Correlations. Transport in Porous Media 64: 279–300.
Chang LC, Chen HH, Shan HY, Tsai JP (2008) Effect of connectivity and wettability on the relative permeability of NAPLs, Environmental Geology DOI 10.1007/s00254-008-1238-8.