國 立 交 通 大 學
電子物理研究所
碩士論文
氧硒化鋅等電性半導體
之光激螢光時間解析研究
Time-resolved photoluminescence of
isoelectronic ZnSe
1-x
O
x
semiconductors
研究生:鍾蕙璘
指導教授:周武清 教授
氧硒化鋅等電性半導體之光激螢光時間解析研究
Time-resolved photoluminescence
of isoelectronic ZnSe
1-xO
xsemiconductors
研 究 生:鍾蕙璘 Student:Hui-Lin Chung
指導教授:周武清 教授 Advisor:Prof. Wu-Ching Chou
國 立 交 通 大 學
電子物理研究所
碩 士 論 文
A Thesis
Submitted to Institute of Electrophysics College of Science
National Chiao Tung University in partial Fulfillment of the Requirements
for the Degree of Master in
Electrophysics May 2010
Hsinchu, Taiwan, Republic of China
氧硒化鋅等電性半導體
之光激螢光時間解析研究
研究生:鍾蕙璘 指導教授:周武清 教授
國立交通大學電子物理研究所
中文摘要
在摻雜氧的硒化鋅中,氧會形成等電性中心並抓住載子,這將使載子的復合路徑變 得複雜。在本研究中,我們使用光激螢光光譜與時間解析光譜來探討氧對載子復合機制 的影響 (氧硒化鋅的氧含量最高為5.3莫耳百分比) 。我們發現氧除了會造成很大的能帶 彎曲外,也會對氧硒化鋅的生命期造成很大的影響。這個複雜的生命期衰減曲線可用柯 爾洛希 (Kohlrausch) 的延伸性指數定律來描述,並可用電子的跳躍遷移模型做很好的解 釋。除此之外,我們還發現隨著溫度升高,延伸參數 (β) 會出現先下降後上升的情形。 這個結果反應了載子會因溫度上升而改變載子復合的機制。Time-resolved photoluminescence of
isoelectronic ZnSe
1-x
O
x
semiconductors
Student : Hui-Lin Chung Advisor : Prof. Wu-Ching Chou
Institute of Electrophysics
National Chiao Tung University
Abstract
Oxygen in ZnSe1-xOx acts as an isoelectronic trap that captures excitons and complicates
the carrier relaxation paths. This study explores the influence of O on the carrier dynamics in ZnSe1-xOx (O content up to 5.3 %) by using temperature-dependent photoluminescence (PL)
and time-resolved PL spectroscopy. Incorporating oxygen not only causes large band-gap bowing but also strongly affects the emission lifetime of ZnSe1-xOx. Kohlrausch’s stretched
exponential law and hopping-transport model correlate well with the complex decay traces. Moreover, as the temperature increases, the stretching exponent β initially decreases and then monotonically increases. The results reflect a thermally activated transfer mechanism of carrier recombination.
Acknowledgement
兩年的研究所生活在不知不覺中就要走到了尾聲,這兩年在交大的日子,讓我認識 了很多新朋友,也從研究室中學到了很多寶貴的經驗和知識,讓我獲益良多。 這兩年研究所的生涯,首先我要由衷的感謝我的指導老師周武清教授,提供了我在 實驗上的很多資源,並且耐心的教導我,給予了我很多有用的建議。尤其在待人處事上, 周老師也給了我很多良好的示範,我想這些都會讓我在未來受用無窮。另外,非常感謝 徐子民老師、綦振瀛老師、陳衛國老師以及張文豪老師在研究上給予我寶貴的意見。其 中,特別感謝綦振瀛老師提供了這套實驗的樣品,讓這份研究得以完成。同時,我也要 特別感謝這兩年來帶領我的彥丞學長,因為學長對研究的精神與經驗,我的研究才能順 利的完成,尤其在每次的討論過程中都讓我學習到很多,真的很感謝學長這兩年來耐心 的教導與帶領。 接下來還要感謝實驗室的學長姐們,感謝文忠學長、瑞泰學長、崑峯學長、李寧學 長瑞雯學姊和威智學長,感謝你們能夠分享許多自己的研究經驗以及給我的指導與鼓勵。 感謝偉仕學弟和大陸同胞高昆,因為有你們的陪伴和幫忙,讓我的實驗室生活變得更多 采多姿。感謝崑峯學長帶著我一起去當普物實驗助教,因為你我才能很快的適應實驗室 和交大的生活,在這邊預祝學長資格考順利過關。還有要感謝現在正在台積電的瑞雯學 姊,在實驗室裡陪我談天說地,並且會在節日時給我有趣的小禮物及點心,讓我既驚喜 又感動,祝福學姐在台積電能順順利利賺大錢。 最後,我要感謝我的家人,爸爸、媽媽、妹妹,感謝你們的支持和陪伴,謝謝你們 總是為我著想,並用寬容的心體貼我、包容我,讓我能在交大順利的完成學業。我還要 謝謝我的好朋友們,種子、資雲、柚子以及雷丘,謝謝你們在我忙碌的生活中為我打氣, 也謝謝你們願意聽我抱怨,陪我玩樂。並且特別感謝柚子和雷丘,因為有你們的幫忙, 我才能不用到處來回奔波,專心的完成這份論文,所以在此也將這份完成論文的喜悅與 你們分享。Contents
Abstract (Chinese version)... i
Abstract (English version) ... ii
Acknowledgement ... iii
Contents ... iv
List of Figures ... v
List of Tables ... vii
Chapter 1 Introduction ... 1
Chapter 2 Experimental Setup ... 5
2.1 Photoluminescence (PL) System ... 5
2.2 Time-Resolved Photoluminescence (TRPL) System ... 6
Chapter 3 Results and Discussion ... 9
3.1 Photoluminescence Study of ZnSe1-xOx ... 9
3.2 Time-resolved Photoluminescence Study of ZnSe1-xOx ... 13
Chapter 4 Conclusions ... 30
List of Figures
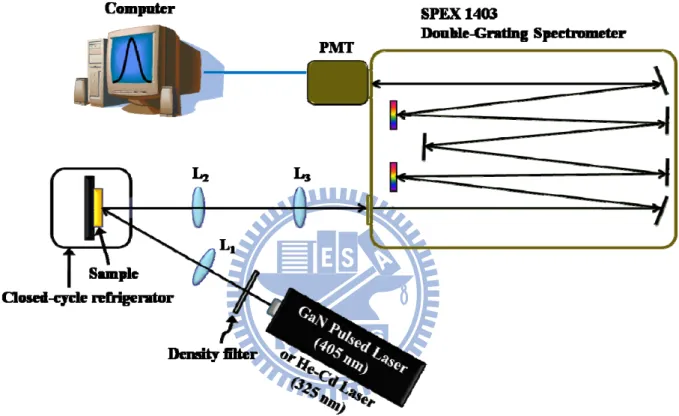
Fig. 2.1. Experimental setup of PL system. ………..………7
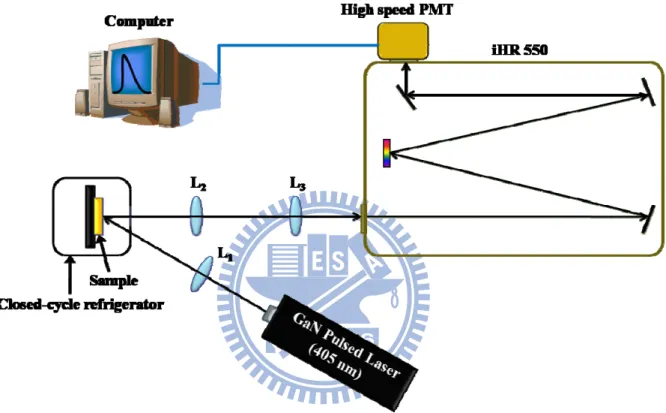
Fig. 2.2. Experimental setup of TRPL system. ……….8
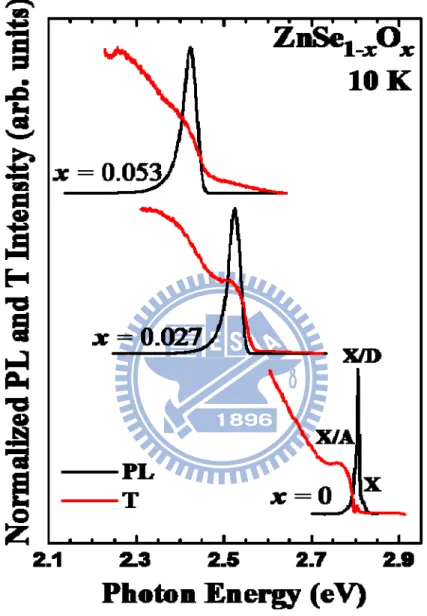
Fig. 3.1. Normalized PL and transmission spectra of ZnSe1-xOx at 10 K. ………...18
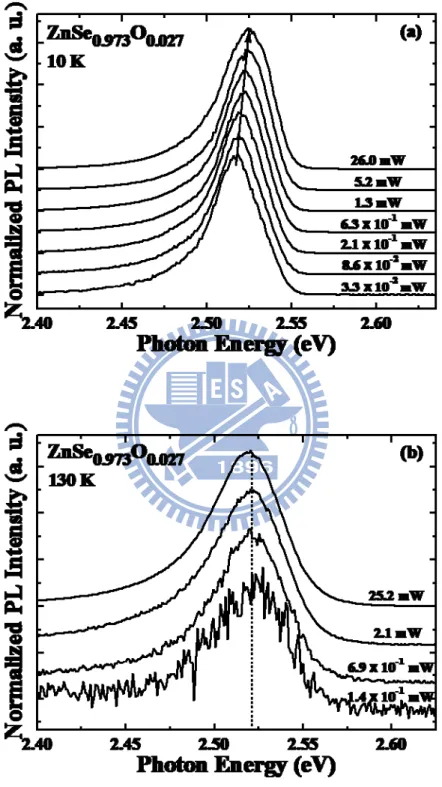
Fig. 3.2. Excitation power-dependent PL spectra for ZnSe0.973O0.027 at (a) 10 K and (b) 130
K. ………..19
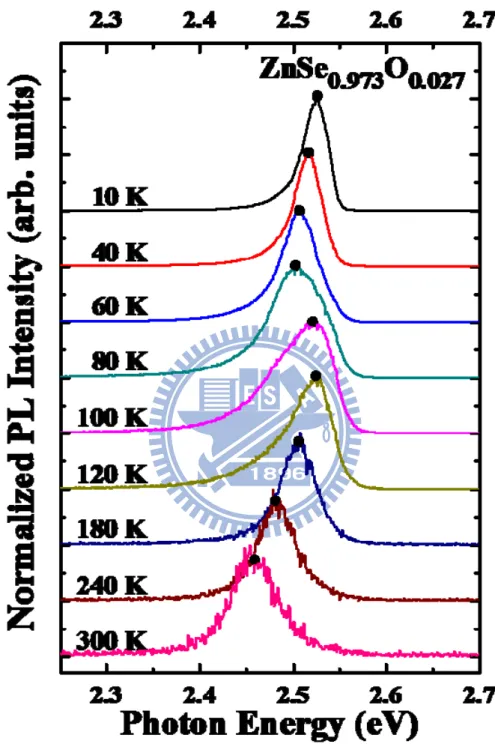
Fig. 3.3. Temperature-dependent PL spectra of ZnSe0.973O0.027. ……….20
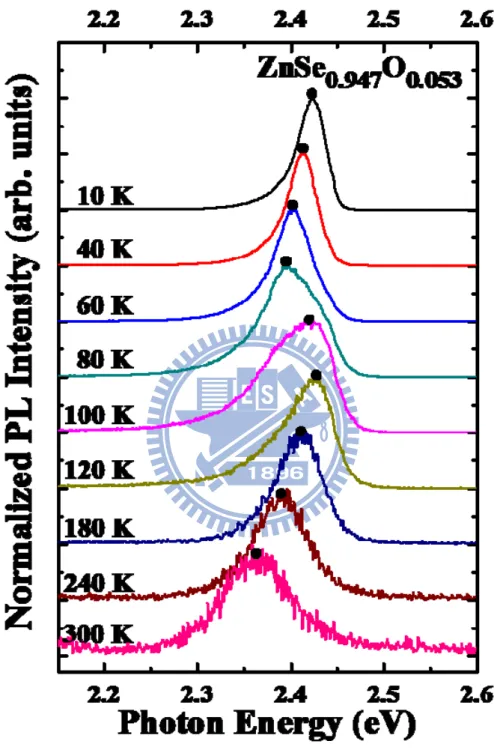
Fig. 3.4. Temperature-dependent PL spectra of ZnSe0.947O0.053. ………...21
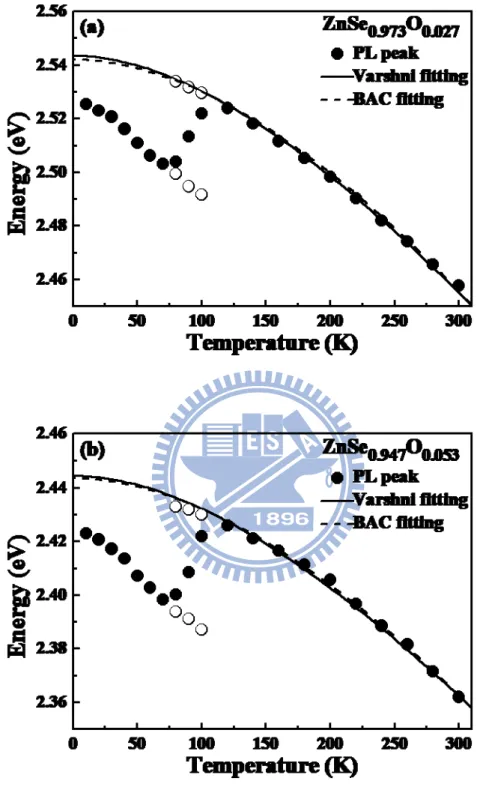
Fig. 3.5. Temperature-dependent PL peak energies for (a) ZnSe0.973O0.027 and (b)
ZnSe0.947O0.053. The solid and dashed curves present the fits from the Varshni
equation and the BAC model, respectively. The open circles denote the PL peak energy fitted by two Gaussian functions. ……….22
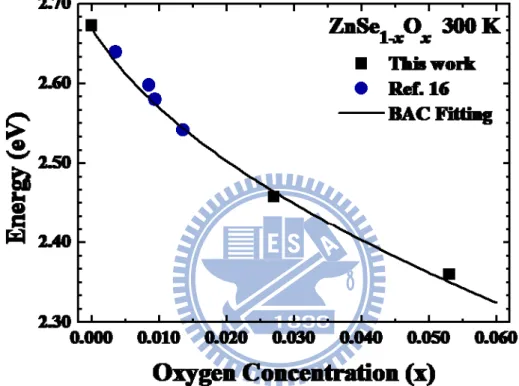
Fig. 3.6. Band gap energy of ZnSe1-xOx as a function of O concentration at 300 K. The
model. ...23
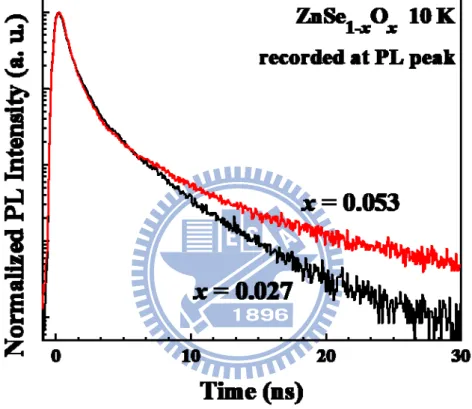
Fig. 3.7. TRPL spectra at 10 K of ZnSe1-xOx (x = 0.027 and 0.053). ………..24
Fig. 3.8. TRPL spectra at 10 K as a function of monitored energies for (a) x = 0.027 and (b) 0.053. ………25
Fig. 3.9. TRPL image of ZnSe0.973O0.027 at 10 K. ………...26
Fig. 3.10. Temperature-dependent TRPL spectra of ZnSe0.973O0.027 and the corresponding
stretching exponent β (inset). ………...27
Fig. 3.11. Temperature-dependent TRPL spectra of ZnSe0.947O0.053 and the corresponding
stretching exponent β (inset). ………...28
Fig. 3.12. (a) Schematic diagram used in the discussion, indicating complex relaxation channels. For simplicity only two trap states are considered. (b) TRPL image of
ZnSe0.947O0.053 at 80 K. ……….29
List of Tables
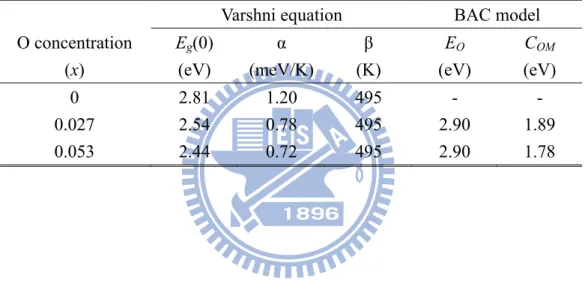
Table 3.1 Fitting parameters from the Varshni equation and the BAC model. …………...17
Chapter 1 Introduction
In recent years, highly mismatched alloys (HMAs) have been studied extensively both experimentally and theoretically due to their unique and interesting optical properties [1-10]. HMAs are a class of material in which the constituent anion element is partially replaced by an isovalent element with very dissimilar properties, such as size and electronegativity. The most extensively studies HMAs to date are III-V-N systems, such as N in GaAs and GaP, where N plays an isoelectronic impurity. In the case of GaAsN, for example, the electronegativity (size) of N is much larger (smaller) than that of As. The highly mismatched electronegativity and size lead to a profound effect on optical and electronic properties. These properties include, for example, giant and asymmetric band-gap bowing, significant increase of the electron effective mass, the appearance of a new optical transition (E+), nonlinear
pressure dependence of the band gap, and a reduced temperature dependence of the band gap [1-10].
In II-VI Oxygen alloys, incorporating Oxygen into ZnSe reveals a similar highly mismatched effect in ZnSe1-xOx [11]. Comparing O and Se, the electronegativity (size) of O is
much larger (smaller) than that of Se. The electronegativity (size) is 3.5 (0.66 Å) and 2.4 (1.17 Å) for O and Se element, respectively. Therefore, the dramatic changes of the optical properties in ZnSe1-xOx can be expected. These changes in electronic band structure deviate
greatly from the predictions of the virtual crystal approximation (VCA). Previously, the large band-gap bowing behavior of ZnSe1-xOx was described using a bowing parameter.Nabetani et
al. found that the band-gap bowing parameter of ZnSe1-xOx is about 8 eV in the Se-rich region
[12]. However, Iwata et al. found that the bowing parameter is about 12 eV in O-rich region [13]. These results imply an asymmetric band-gap bowing, reflecting that single bowing parameter cannot describe the band-gap bowing of ZnSe1-xOx throughout the entire O
concentration.
Recently, the band anticrossing (BAC) model was proposed to explain the change of electronic band structure of HMAs [5]. In the case of II-VI-O system, the BAC model can be considered as an interaction of two energy states: defect state of O and the extended conduction band state of the host matrix. The interaction of the two types of states can be treated as a perturbation which leads to the following eigenvalue problem:
0,
where EM is the band gap of the host matrix, EO is the O defect state relative to the valence
band, and VOM is the parameter describing the strength of the interaction between them. By
solving the eigenvalue problem, the two solutions can be written as, 4 .
It has been shown previously that the square of the matrix is proportional to the concentration of Oxygen atoms. Consequently, the strength of the coupling VOM can be described as
/ ,
where COM is a constant dependent on the semiconductor matrix, and x is the concentration of
Oxygen [14-15]. Shan et al. found that the BAC model explains well in the composition and pressure dependence of the band gap in ZnSe1-xOx with COM = 1.8 ± 0.3 eV [16]. However,
Polimeni et al. found no effect of oxygen on the temperature dependence of band gap in ZnSe1-xOx (x = 0.23 - 0.90 %), which deviates from the prediction of the BAC model [17].
Accordingly, we will investigate the temperature dependence of photoluminescence (PL) on isoelectronic ZnSe1-xOx semiconductors and compare the results with previous works.
Although much research efforts have been focused on isoelectronic ZnSe1-xOx
semiconductors, the influence of O on the decay dynamics in this material remains unexplored. Recently, we have studied the decay dynamics of isoelectronic ZnSe1-xTex
semiconductors [18]. We demonstrated that the PL decay traces are correlated well with the Kohlrausch’s stretched exponential law [19],
· / ,
where τ is the PL lifetime and β is the stretching exponent varied from 0 to 1. The Kohlrausch law has been extensively used to describe numerous complex relaxation processes [20-26]. The stretched exponential decay behavior has also been observed in single colloidal semiconductor nanocrystals because of the presence of multinonradiative decay channels that surround the single nanocrystal [27]. In the study of ZnSe1-xTex, the stretched exponential
decay is attributed to the presence of Te localized states, which provide multidecay paths in ZnSe1-xTex. These results can be understood using energy transfer and the geometric random
site hopping-transport model [18]. According to this model, the transport sites (N0) and the
trapping sites (NT) distribute randomly in 3D space of a system, in which an electron can
move among the transport sites in many different ways and be captured by a trap state. Based on the numerical simulations, Sturman et al. obtained that the value of the stretching exponent
β decreases with the decreasing of N0/NT [28]. Accordingly, the applicability of the
Kohlrausch law and exploring the effect of O on the carrier dynamics in ZnSe1-xOx is
important and of great interest. In this thesis, we study the carrier dynamics of isoelectronic ZnSe1-xOx semiconductors with O composition up to 5.3 % by using PL and time-resolved PL
(TRPL) spectroscopy.
This thesis is organized as follows. This chapter introduces the unusual physical properties of isoelectronic semiconductors. Chapter 2 introduces the PL and TRPL systems used in this thesis. Chapter 3 discusses the influence of O on the decay dynamics in ZnSe1-xOx
Chapter 2 Experimental Setup
In this chapter, the experimental systems used in this thesis are described. The experimental systems include photoluminescence (PL) system and time-resolved photoluminescence (TRPL) system.
2.1 Photoluminescence (PL) System
The experimental setup of the PL system is shown in Figure 2.1. The samples were loaded on the cold finger of a closed cycle cryostat and the temperature was controlled between 10 and 300 K. The GaN pulsed laser (405 nm) was used as an excitation source with the excitation power of about 1 mW. The incident laser beam was focused on the sample by a convex lens (L1). The PL signal from the sample was collected by a set of convex lenses (L2
and L3) and guided to spectrometer. The signal was dispersed by a SPEX 1404 0.85 m
double-grating spectrometer and detected using photomultiplier tube (PMT). The spectrometer was controlled by a computer, which was used to store and plot the collected data. An He-Cd (325 nm) laser was used to carry out the excitation power-dependent PL measurements, and a density filter was added in front of the laser to adjust the laser power.
2.2 Time-Resolved Photoluminescence (TRPL) System
TRPL system was used to study the decay dynamics of excitons. The experimental setup of TRPL system is similar to the PL system and shown in Figure 2.2. The GaN pulsed laser (405 nm) with a pulse width of 200 ps and repetition rate of 10 MHz was used as an excitation source. The laser beam was focused on the sample by a convex lens (L1). The
combination lenses (L2 and L3) guide the PL signal to the iHR550 spectrometer, which was
equipped with a high speed PMT to detect the signal. The signal was further analyzed by a computer with a time-correlated single photon counting method. The overall temporal resolution of the TRPL measurement is about 200 ps.
Chapter 3 Results and Discussion
In this chapter, we study the carrier dynamics of ZnSe1-xOx with O composition up to
5.3% using PL and TRPL measurements. In section 3.1, we will discuss the results of temperature-dependent PL measurements. In section 3.2, the dependence of both temperature and monitored energy on the decay dynamics of ZnSe1-xOx will be investigated.
3.1 Photoluminescence Study of ZnSe
1-xO
xZnSe1-xOx (x = 0, 0.027, and 0.053) films were grown by RF-plasma assisted molecular
beam epitaxy on (001) GaAs substrates after the deposition of a 100 nm-thick ZnSe buffer layer. The thicknesses of all films were fixed at around 0.5 μm and the O concentration was determined by x-ray diffraction. [29]. Figure 3.1 shows the normalized PL and transmission (T) spectra of ZnSe1-xOx (x = 0, 0.027, and 0.053) at 10 K. Clearly, a sharp near-band-edge
emission of ZnSe peaked at about 2.80 eV is observed. When O is substituted into ZnSe, the PL emissions shift toward lower energies, 2.52 and 2.42 eV for x = 0.027 and 0.053, respectively. As the O concentration is increased, the emissions become broader and asymmetric. This result can be attributed to the alloy fluctuations or O clustering. Figure 3.2(a) presents the excitation power-dependent PL spectra for ZnSe0.973O0.027. Increasing the laser
is also found in ZnSe0.947O0.053 in the same excitation power range, indicating that the broad
emissions of ZnSe1-xOx are attributable to localized excitons (LE).
To clarify further the dependence of temperature on the carrier dynamics in ZnSe1-xOx,
temperature-dependent PL measurements are performed. Figure 3.3 and Figure 3.4 show the temperature-dependent PL spectra of ZnSe1-xOx for x = 0.027 and 0.053, respectively. The PL
peaks exhibit an S-shaped energy shift with increasing temperature, which is a typical feature of carrier localization effect. At 10 K, a LE emissiom which is determined from the power-dependent PL measurements can be observed. With increasing temperature, the emission from LE shifts toward lower energy and becomes broader. When the temperature is increased further, the LE peak quickly thermally quenches and another peak appears at high energy shoulder between 80 and 100 K. As the temperature is increased above 100 K, the high-energy peak becomes dominant and shift to lower energy. This emission shows a normal Gaussian shape, while that from LE exhibits an asymmetric shape with a low-energy tail and a sharp high-energy cutoff. Moreover, the emission yields no obvious energy shift over a range of excitation power by three orders of magnitude as shown in Figure 3.2(b). Based on these observations, the emission at the high energy shoulder is attributed to free excitons (FE) thermally detrapping from the isoelectronic O trap states.
Figure 3.5(a) and 3.5(b) depict the corresponding temperature-dependent PL peak energies for x = 0.027and 0.053, respectively. As shown in the figures, the FE peak energies
agree well with the empirical Varshni fitting (solid curve),
2
( ) (0) / ( )
g g
E T E T T , (1) where Eg(0) is the band gap at 0 K, and α and β are the Varshni fitting parameters, listed in
Table 3.1. Increasing the O concentration, α decreases from 1.20 to 0.72 meV/K for x = 0 and 0.053, respectively. The experimental result indicates a decreased dependence of the ZnSe1-xOx band gap on temperature. The temperature-dependent band gap energy of
ZnSe1-xOx can also be fitted using the BAC model [5],
1 2 2 21
( )
( )
( )
4
2
g O M O M OME T
E
E T
E
E T
C x
, (2)where EO and EM(T) are the energies of the O level and the ZnSe conduction band (CB) edge
relative to the top of the valence band (VB), respectively. EM(T) can be obtained by Eq. (1)
for ZnSe. COM is a parameter describing the strength of the interaction between the O level
and the ZnSe CB states. The result of theoretical calculation is represented in Figure 3.5 by dashed curve. The fitting parameters are listed in Table 3.1. As shown in Figure 3.5(a) and 3.5(b), the FE energies are in good agreement with BAC model. The fitted band gap energy using Varshni equation and BAC model at 10 K approaches the value measured from transmission measurement (Figure 3.1). The above observations provide additional evidences to the FE emissions. Figure 3.6 plots the band gap energy of ZnSe1-xOx as a function of O
model with EO = 2.90 eV and COM = 1.82 eV. The values are within the error of previous
study, which found EO = 2.9 ± 0.02 eV and COM = 1.8 ± 0.3eV [16].
Based on the above observations, we can conclude that the unique optical properties of ZnSe1-xOx can be well explained using BAC model. This result is different from the previous
study of Polimeni et al., who found that the temperature dependence of the band gap in ZnSe1-xOx is independent from O concentration[17]. The reason why their experimental
results are inconsistent with the prediction of the BAC model might be the poor sample quality or the relative low O concentration (O content less than 1.0 %).
3.2 Time-resolved Photoluminescence Study of ZnSe
1-xO
xIn order to explore the effect of O on the decay dynamics in ZnSe1-xOx, the TRPL
measurements are performed. Figure 3.7 displays the TRPL spectra of ZnSe1-xOx (x = 0.027
and 0.053) monitored at the PL peaks and 10 K. Obviously, several interesting findings can be drawn. (i) The PL decay profiles exhibit non-single-exponential decay and can be decomposed into a fast (initial) and a slow (tail) component. Moreover, the fast component is mono-exponential decay, while the slow component is stretched-exponential behavior. (ii) The PL decay rate is an order of magnitude slower than that of ZnSe (~ 5.0 ns-1). (iii) The PL lifetime of slow component significantly increases with the O concentration. These unique optical properties are signatures of ZnSe-based isoelectronic semiconductors [18], implying complicated carrier dynamics. Quantitatively, the decay curves are fitted by using the following equation, 1 2 / ( / ) 1 2 ( ) t t I t A e A e , (3) where τ1 and τ2 is the exciton lifetime of fast and slow component respectively, and β is the
stretching exponent ranging from 0 to 1. This stretching exponent is a measure of the relaxation rates involved in the PL decay process where a smaller β means a broader rate distribution. The fitted τ1 is about 850 ps for both samples; τ2 (β) is about 2.8 ns (0.96) and 4.1
increasing number of isoelectronic O traps provides multidecay paths for the excitons [18]. The suggestion is consistent with the hopping-transport model, in which the concentrations of transport and trapping sites determine the stretching exponent [28].
To verify the suggestions, Figure 3.8(a) and 3.8(b) show the TRPL spectra at 10 K and various monitored energies for x = 0.027 and 0.053, respectively. Decreasing the monitored energy, the decay time from the slow component significantly increases, while the decay time from the fast component is insensitive to energy. For x = 0.027, τ2 (β) is around 2.4 ns (0.97)
and 4.7 ns (0.76) at 2.55 and 2.43 eV, respectively. For x = 0.053, τ2 (β) is around 2.8 ns (0.97)
and 7.4 ns (0.70) at 2.44 and 2.32 eV, respectively. In accordance with the asymmetric linewidth broadening, the above results can be ascribed to exciton energy transfer among isoelectronic O traps. The TRPL image in Fig 3.9 reveals the dynamics of energy transfer in ZnSe0.973O0.027. Within the initial few nanoseconds after excitation, the emission is peaked at
2.52 eV. As time passes, an energy redshift is clearly observed, revealing that some of the LE transfer to deeper traps. Moreover, the decay profile at high energy exhibits mono-exponential decay, whereas that at low energy is a stretched-exponential function, implying that the effect of LE can be neglected at high energy region. This phenomenon becomes even more pronounced upon recording of the higher energy emissions. Therefore, the fast decay discussed herein can be ascribed to free excitons (FE).
display the temperature-dependent TRPL spectra of ZnSe1-xOx (x = 0.027 and 0.053).
According to these figures, increasing the temperature significantly quenches the lifetime of slow component. As the temperature is increased above 100 K, the slow decay component is eliminated and the fast decay dominates the entire decay profile. Moreover, the bending of the logarithmic decay curve, i.e. a reduction in β, initially becomes more pronounced with increasing temperature up to 70 K and then gradually diminishes, i.e. the β starts to increase. To get a more quantitative measure of the β, the decay curves are fitted with Eg. (3). The stretching exponent β as a function of temperature is displayed in the inset in Figure 3.10 and Figure 3.11 for x = 0.027 and 0.053. Increasing the temperature initially decreases β to a minimum at 70 K and then monotonically increases. This phenomenon can be explained by the corresponding configuration coordinate diagram schematically shown in Figure 3.12(a). At the lowest temperature (10 K), electrons that are generated initially in the free state hop among proximal transport and trapping sites and recombine with the isoelectronic O traps (channel 1). With increasing temperature these less mobile electrons are imparted with additional energy that allow hopping to deeper trap states (channel 2), causing a rapid redshift in the LE peak and a reduction of β. Simultaneously, as the temperature approaches 70 K, portions of trapped electrons are thermally activated back to populate the higher energy states (channel 3), leading to a significant PL linewidth broadening at the high energy shoulder. At still higher temperatures, an increasing number of electrons gain sufficient energy to
delocalize into the free state (channel 4) and recombine, explaining the increase in β and the blueshift of the PL peaks. Above 100 K, the slow decay component disappears because FE dominates the recombination, resulting in a monotonic PL energy redshift with the temperature. The delocalization effect is further verified by the TRPL image of ZnSe0.947O0.053
at 80 K. In Figure 3.12(b), as time passes an energy redshift at low-energy peak is observed due to the recombination from traps. However, the high-energy peak exhibits no obvious energy shift with time, reflecting the recombination of thermally delocalized FE.
Table 3.1 Fitting parameters from the Varshni equation and the BAC model. Varshni equation BAC model O concentration (x) Eg(0) (eV) α (meV/K) β (K) EO (eV) COM (eV) 0 2.81 1.20 495 - - 0.027 2.54 0.78 495 2.90 1.89 0.053 2.44 0.72 495 2.90 1.78
Fig. 3.2. Excitation power-dependent PL spectra for ZnSe0.973O0.027 at (a) 10 K and
Fig. 3.5. Temperature-dependent PL peak energies for (a) ZnSe0.973O0.027 and (b)
ZnSe0.947O0.053. The solid and dashed curves present the fits from the Varshni
equation and the BAC model, respectively. The open circles denote the PL peak energy fitted by two Gaussian functions.
Fig. 3.6. Band gap energy of ZnSe1-xOx as a function of O concentration at 300 K.
The black squares mark the PL energy in this work, the blue circles mark the value from photoreflectance in Ref. 16, and the black curve shows the best fit by BAC model.
Fig. 3.8. TRPL spectra at 10 K as a function of monitored energies for (a) x = 0.027 and (b) 0.053.
Fig. 3.10. Temperature-dependent TRPL spectra of ZnSe0.973O0.027 and the
Fig. 3.11. Temperature-dependent TRPL spectra of ZnSe0.947O0.053 and the
Fig. 3.12. (a) Schematic diagram used in the discussion, indicating complex relaxation channels. For simplicity only two trap states are considered. (b) TRPL image of ZnSe0.947O0.053 at 80 K.
Chapter 4 Conclusions
In summary, this study investigated carrier dynamics in ZnSe1-xOx by using PL and
TRPL spectroscopy. The PL peaks exhibit an S-shaped energy shift with increasing temperature. The emission is dominated by FE at high temperature while the emission is LE dominant at low temperature. Complex recombination routes induced by isoelectronic O traps are well fitted using Kohlrausch law and clarified by temperature-dependent measurements. The deduced stretching exponent β initially decreases to a minimum at 70 K. It reflects that the recombination with the electrons captured by isoelectronic O traps is significant at low temperatures. However, at higher temperatures the recombination is dominated by the free electrons thermally delocalized from the traps. Thus, the recombination from the traps gradually quenches, and then the β increases.
References
[1] J. N. Baillargeon, K. Y. Cheng, G. E. Hofler, P. J. Pearah, and K. C. Hsieh, Appl. Phys. Lett. 60, 2540 (1992)
[2] P. J. Klar, H. Gruning, W. Heimbrodt, J. Koch, F. Hohnsdorf, W. Stolz, P. M. A. Vicente, J. Camassel, Appl. Phys. Lett. 76, 3439 (2000)
[3] A. Polimeni, M. Capizzi, M. Geddo, M. Fischer, M. Reinhardt, and A. Forchel, Phys. Rev. B 63, 195320 (2001)
[4] G. Y. Rudko, I. A. Buyanova, W. M. Chen, H. P. Xin, and C. W. Tu, Appl. Phys. Lett.
81, 3984 (2002)
[5] W. Shan, W. Walukiewicz, J. W. Ager III, E. E. Haller, J. F. Geisz, D. J. Friedman, J. M. Olson, and S. R. Kurtz, Phys. Rev. Lett. 82, 1221 (1999)
[6] W. Shan, W. Walukiewicz, K. M. Yu, J. W. Ager III, E. E. Haller, J. F. Geisz, D. J. Friedman, J. M. Olson, S. R. Kurtz, and C. Nauka, Phys. Rev. B 62, 4211 (2000)
[7] C. Skierbiszewski, P. Perlin, P. Wisniewski, W. Knap, T. Suski, W. Walukiewicz, W. Shan, K. M. Yu, J. W. Ager, E. E. Haller, J. F. Geisz, and J. M. Olson, Appl. Phys. Lett.
76, 2409 (2000)
[8] I. Suemune, K. Uesugi, and W. Walukiewicz, Appl. Phys. Lett. 77, 3021 (2000)
and C. W. Tu, Phys. Rev. B 65, 241303 (2002).
[10] H. P. Xin, C. W. Tu, Y. Zhang, and A. Mascarenhas, Appl. Phys. Lett. 76, 1267 (2000) [11] K. Akimoto, T. Miyajima, and Y. Mori, Phys. Rev. B 39, 3138 (1989)
[12] Y. Nabetani, T. Mukawa, Y. Ito, T. Kato, and T. Matsumoto, Appl. Phys. Lett. 83, 1148 (2003)
[13] K. Iwata, P. Fons, A. Yamada, H. Shibata, K. Matsubara, K. Nakahara, H. Takasu, and S. Niki, Phys. Status Solidi B-Basic Res. 229, 887 (2002)
[14] A. Lindsay, E. P. O'Reilly, Solid State Commun. 112, 443 (1999)
[15] W. Walukiewicz, W. Shan, J. W. Ager III, D. R. Chamberlin, E. E. Haller, J. F. Geisz, D. J. Friedman, J. M. Olson, and S. R. Kurtz, Proceedings of the 195th Electrochemical Society Meeting, Seattle, WA (The Electrochemical Soc. Inc., Pennington, NJ, 1999), Vol. 99-11, p. 190
[16] W. Shan, W. Walukiewicz, J. W. Ager III, K. M. Yu, J. Wu, E. E. Haller, Y. Nabetani, T. Mukawa, Y. Ito, and T. Matsumoto, Appl. Phys. Lett. 83, 299 (2003)
[17] A. Polimeni, M. Capizzi, Y. Nabetani, Y. Ito, T. Okuno, T. Kato, T. Matsumoto, and T. Hirai, Appl. Phys. Lett. 84, 3304 (2004)
[18] Y. C. Lin, W. C. Chou, W. C. Fan, J. T. Ku, F. K. Ke, W. J. Wang, S. L. Yang, W. K. Chen, W. H. Chang, and C. H. Chia, Appl. Phys. Lett. 93, 241909 (2008)
[20] J. Jackle, Philos. Mag. B-Phys. Condens. Matter Stat. Mech. Electron. Opt. Magn. Prop.
56, 113 (1987)
[21] H. X. Jiang, and J. Y. Lin, Phys. Rev. Lett. 64, 2547 (1990)
[22] J. Kakalios, R. A. Street, and W. B. Jackson, Phys. Rev. Lett. 59, 1037 (1987) [23] H. J. Queisser, Phys. Rev. Lett. 54, 234 (1985)
[24] R. A. Street, Advances in Physic 25, 397 (1976)
[25] T. Hattori, H. Yugami, and M. Ishigame, Solid State Ion. 70, 471 (1994) [26] J. C. Phillips, Rep. Prog. Phys. 59, 1133 (1996)
[27] G. Schlegel, J. Bohnenberger, I. Potapova, and A. Mews, Phys. Rev. Lett. 88, 137401 (2002)
[28] B. Sturman, E. Podivilov, M. Gorkunov, Phys. Rev. Lett. 91, 176602 (2003) [29] C. Y. Chen, J. I. Chyi, C. K. Chao, and C. H. Wu, Electron. Lett. 45, 1267 (2009)